Fig. 2.
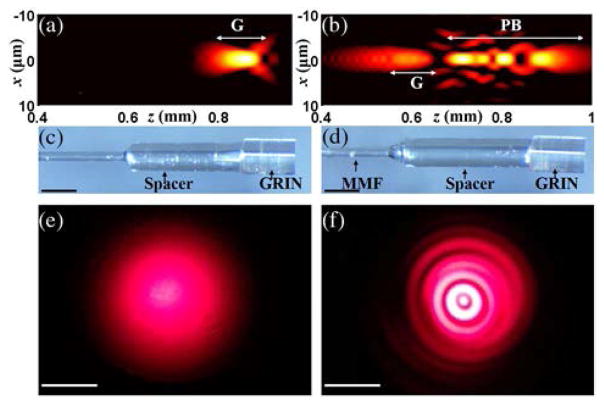
(a) Simulated, depth-dependent field intensity distribution of the Gaussian beam in a tissue medium (an aqueous environment, n = 1.34). The intensity was normalized by the peak intensity, and displayed in a log scale with a dynamic range of 15 dB. (b) The simulated, depth-dependent field intensity distribution of the CAFM beam in a tissue medium (an aqueous environment, n = 1.34). The intensity was normalized by the peak intensity, and displayed in a log scale with a dynamic range of 15 dB. (c) The conventional fiber optic probe. (d) The self-imaging wavefront division fiber optic probe. MMF, multimode fiber. (e) The transverse beam profile of the Gaussian beam with the probe ~5 cm from the surface. (f) The transverse beam profile of the CAFM beam with the probe ~5 cm from the surface, showing multiple rings corresponding to each spatial mode induced by the MMF wave-guide. The beam patterns were projected onto a screen and the images were acquired by a camera in the far field. x and z in (a) and (b) represent the lateral distance and depth, respectively; G and PB in (a) and (b) indicate the Gaussian focusing region and the pseudo-Bessel focusing region, respectively; the scale bars in (c) and (d): 500 μm; the scale bars in (e) and (f): 1 cm.

