Abstract
Background
Biopsy surveillance protocols for the assessment of Barrett’s esophagus can be subject to sampling errors, resulting in diagnostic uncertainty. Optical coherence tomography is a cross-sectional imaging technique that can be used to conduct volumetric laser endomicroscopy (VLE) of the entire distal esophagus. We have developed a biopsy guidance platform that places endoscopically visible marks at VLE-determined biopsy sites.
Objective
The objective of this study was to demonstrate in human participants the safety and feasibility of VLE-guided biopsy in vivo.
Design
A pilot feasibility study.
Setting
Massachusetts General Hospital.
Patients
A total of 22 participants were enrolled from January 2011 to June 2012 with a prior diagnosis of Barrett’s esophagus. Twelve participants were used to optimize the laser marking parameters and the system platform. A total of 30 target sites were selected and marked in real-time by using the VLE-guided biopsy platform in the remaining 10 participants.
Intervention
Volumetric laser endomicroscopy.
Main Outcome Measurements
Endoscopic and VLE visibility, and accuracy of VLE diagnosis of the tissue between the laser cautery marks.
Results
There were no adverse events of VLE and laser marking. The optimal laser marking parameters were determined to be 2 seconds at 410 mW, with a mark separation of 6 mm. All marks made with these parameters were visible on endoscopy and VLE. The accuracies for diagnosing tissue in between the laser cautery marks by independent blinded readers for endoscopy were 67% (95% confidence interval [CI], 47%–83%), for VLE intent-to-biopsy images 93% (95% CI, 78%–99%), and for corrected VLE post-marking images 100% when compared with histopathology interpretations.
Limitations
This is a single-center feasibility study with a limited number of patients.
Conclusion
Our results demonstrate that VLE-guided biopsy of the esophagus is safe and can be used to guide biopsy site selection based on the acquired volumetric optical coherence tomography imaging data. (Clinical trial registration number: NCT01439633.)
Barrett’s esophagus (BE) and associated dysplasia is a microscopic disease that is usually diagnosed by histopathologic analysis of tissues that are excised during an endoscopic biopsy procedure.1 Because endoscopy alone may not be sufficient to distinguish BE from irregular z lines2 or to identify dysplasia and intramucosal carcinoma and because the involved area is frequently much larger than the size of a biopsy specimen, endoscopic biopsy specimens are taken at random locations, with the hope of excising areas that contain the most severe disease.3–5 This technique is subject to significant sampling error, which leads to diagnostic uncertainty and suboptimal patient management.3,5
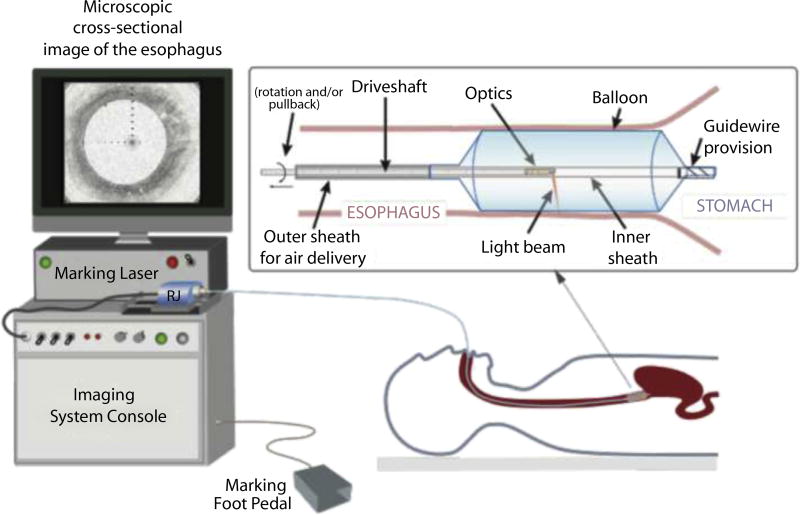
A new imaging paradigm recently has been developed that aims to reduce sampling error by acquiring comprehensive volumetric microscopic images of the entire esophagus.6,7 Currently, this technique uses optical coherence tomography (OCT) technology to obtain 10-µm–resolution, cross-sectional images of the esophageal wall.8–10 Prior studies have shown that this technique can accurately identify BE and dysplasia.11–14 To create a 3-dimensional microscopic image of the esophagus, the OCT laser beam is helically scanned over a long length of esophagus (approximately 6.0 cm) in 1 to 2 minutes by miniature optics that are in the center of a 2.5-cm diameter, transparent balloon-centering catheter (Fig. 1).6,15 Early clinical results using this imaging method demonstrate that it is a safe and effective procedure for obtaining comprehensive microscopic mapping of esophageal diseases in vivo.6
Figure 1.
Schematic of the VLE–guided biopsy system and balloon-centering catheter. The interchangeable balloon catheter is inserted into the esophagus at the gastroesophageal junction and inflated. The balloon catheter is connected to the imaging system via an optical rotary junction. The rotary junction spins a driveshaft that encloses an optical fiber. The optical fiber is terminated by focusing optics at the distal end that spin with the driveshaft. The driveshaft is pulled back while spinning to effectuate a helical OCT scan of the esophagus. A foot pedal is used to initiate laser marking. The entire procedure is monitored by real-time visualization of the displayed, cross-sectional OCT image. VLE, volumetric laser endomicroscopy; OCT, optical coherence tomography.
An important clinical application of this imaging approach, which has been termed volumetric laser endomicroscopy (VLE),16 is guiding the selection of higher yield biopsy sites based on the microscopic image data. However, biopsies cannot be excised during the scan because the dataset is continuously acquired through the balloon while it is inflated. In order to realize VLE-guided biopsy, we have developed a technique that places visible marks on the esophagus that delineate tissues corresponding to image regions of interest that are selected during the scan.17 These marks are created by transient, high-power laser transmission through the balloon catheter’s optics.17 After the balloon catheter is removed, the tissue between the marks is biopsied.17 The objective of this study was to demonstrate in human participants the safety and feasibility of VLE-guided biopsy in vivo and to describe our first human experience with this newly developed biopsy guidance platform.
METHODS
OCT VLE imaging system and balloon catheter
A schematic of the VLE imaging system and balloon-centering catheter is shown in Figure 1. The imaging system obtains microscopic images using optical frequency domain imaging (OFDI), a second-generation, high-speed form of OCT technology.7 OFDI images were acquired at a rate of 40,000 axial scans (A-lines, depth-resolved reflectivity profiles) per second.6 Each cross-sectional esophageal image contained 4096 A-lines; the resultant cross-sectional frame rate was 10 per second. The power, center wavelength, and tuning range used for OFDI imaging were 30 mW, 1350 nm, and 140 nm, respectively. The axial resolution was 7 µm in tissue. The balloon-centering catheter had a guidewire provision, an inflated diameter of 2.5 cm, and an imaging window length of 6.0 cm (Fig. 1).6 Optics centered in the balloon catheter provided a minimum transverse spot diameter of 40 µm (full-width, half-maximum) that was located approximately 0.5 mm outside the inflated balloon’s surface. The optics were translated at a rate of 1.0 mm per second, providing a cross-sectional image spacing of 100 µm. In order to fit images of each esophageal cross-section on the computer monitor, images were displayed in real time using a compressed (5:1) study aspect ratio. The 1:1 full aspect ratio images were stored for future offline assessment.
Marking laser
The 1450-nm wavelength cautery-marking laser light was coupled into an optical fiber that was multiplexed into the balloon-centering catheter’s optical fiber via a light combiner. By combining the marking and imaging lasers and launching them through the same optical catheter, it is possible to simultaneously image and mark the esophagus at any point within the imaging window of the balloon catheter (360 degrees, 2.5 cm diameter × 6-cm long balloon). As with the 1350 nm OFDI light, after transmission through the catheter’s optics, the cautery-marking laser’s light was focused to an about 40-µm spot approximately 0.5 mm outside of the inflated balloon. Different cautery-marking optical powers were tested in the patients, including 280 and 410 mW. A foot pedal was used to actuate a shutter that allowed the cautery-marking laser light to be transmitted to the patient for a preset duration of 2 seconds (Fig. 1). Prior studies have shown that laser illumination with these parameters produces thermally mediated damage that is predominantly limited to the mucosa in vivo.17
Guided biopsy procedure
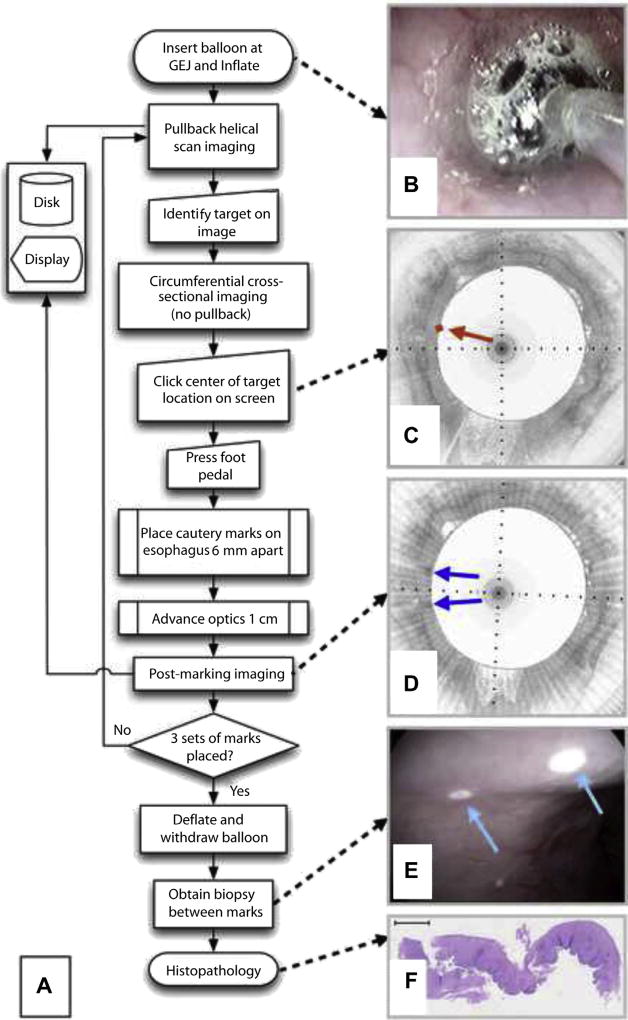
A flowchart of the guided biopsy procedure is depicted in Figure 2A. After informed consent, patients undergoing surveillance for BE and meeting the study inclusion and exclusion criteria were enrolled in the study. A total of 22 patients were enrolled. The Partners Institutional Review Board approved the study (Protocol 2010P000553). The VLE balloon-centering catheter was placed at the gastroesophageal junction over the guidewire and inflated to a pressure of approximately 0.5 atmospheres (Fig. 2B). To ensure correct balloon placement, an initial scout scan was performed, and, if necessary, the balloon was deflated and repositioned. Helical imaging of the esophagus commenced. In real time, during pullback, the operator (M.J.S.), who was experienced in OCT image interpretation, identified a 6.0 mm region of interest (target) on the cross-sectional microscopic image. The pullback was stopped while the catheter’s optics continued to rotate, allowing the same cross-sectional image to be continuously displayed live on the computer screen. The operator recorded an “intent-to-biopsy” diagnosis of squamous, columnar-lined esophagus, or both, using previously published OCT criteria11–13 applied to the image data at the target site. The mouse cursor was then positioned at the center of the target on the displayed image, and the mouse button was clicked. A pre-marking image with an overlay at the intent-to-biopsy target was saved (Fig. 2C). The optics within the imaging probe were then automatically controlled to focus the light at a location that was 3.0 mm circumferentially from the target site in the patient. A foot pedal actuated the cautery-marking laser light for 2.0 seconds, producing a superficial cautery mark on the tissue next to the target site. The optics were then automatically moved to focus light 3.0 mm on the other side of the target site, where another laser cautery mark was placed. The resultant laser cautery marks were separated by 6.0 mm, centered at the middle of the target region (Fig. 2D and E). After laser cautery marking, the catheter optics were then advanced distally, pullback imaging was reinitiated, and images of the marked tissues were acquired (post-marking images) (Fig. 2D). Pullback imaging continued until the next target site was identified. Laser cautery marking was performed at a total of 3 sites in each analyzed patient, producing 3 sets of 2 marks that flanked the 3 target sites. After the laser cautery marking process, the balloon was deflated, and the catheter was withdrawn. The marks were then located using conventional, high-definition video endoscopy (Pentax Medical EG-2990i, Montvale, NJ, USA) (Fig. 2E). The endoscopic visibility of the marks was recorded by the endoscopist (N.S.N.), and high-definition digital videos of the laser cautery marked sites were recorded. Tissue between the marks was then biopsied using Radial Jaw 4 Large Capacity biopsy forceps with needle (M00513333; Boston Scientific, Natick, Mass). Biopsy specimens were processed as usual using 5-µm thick, paraffin-embedded slides and hematoxylin and eosin staining (Fig. 2F).
Figure 2.
A, Flow chart of the VLE-guided biopsy procedure. B, Video endoscopy image of the balloon inflated within the esophagus. C, Pre-marking image showing squamous mucosa circumferentially. The center of the intent-to-biopsy site is delineated by a red diamond and arrow. D, Post-marking image in the study aspect ratio demonstrates regions of high optical coherence tomography signal flanking the target region (blue arrows). E, Video endoscopy shows 2 white laser cautery marks (cyan arrows). F, Squamous epithelium is evident in the histology of the biopsy acquired between the marks. VLE, volumetric laser endomicroscopy.
Data analysis and statistics
All VLE, videoendoscopy, and histopathology diagnoses were rendered as squamous mucosa, columnar-lined esophagus, or a mixture of both for each of the biopsy locations. The percentages of each type of tissue between the marks (VLE) or in the biopsy (histopathology) were recorded in quartiles. As mentioned earlier, pre-marking images (intent-to-biopsy) were diagnosed by the operator (M.J.S.) in real time. Recorded study aspect ratio and full aspect ratio VLE images were read by an expert OCT reader (G.J.T.), blinded to the procedure, video recordings, and histopathologic diagnoses. An endoscopist (J.S.), blinded to the procedure, histopathology, and VLE, viewed the digital video recordings to obtain an endoscopic diagnosis of the tissue between the laser cautery marks. Two board-certified GI pathologists (G.Y.L, T.A.) with a combined 30 years of experience reading GI biopsy specimens, who were blinded to the procedure, the video recordings, and the VLE results, individually rendered the histopathologic diagnosis for each biopsy. The pathologists then convened and developed a consensus diagnosis by discussing and reviewing any discrepant cases. Intent-to-biopsy, recorded study aspect ratio, and full aspect ratio VLE, and video endoscopy diagnoses were determined to correctly match histopathology if the predominant tissue diagnosis by imaging (>50% of the 6.0-mm target region) was equivalent to the majority tissue diagnosis (>50% of the biopsy sample) by histopathology.
Longitudinal and transverse targeting errors were measured using marking VLE datasets displayed in the study aspect ratio. First, the frame in the pre-marking dataset that contained the target was determined. Then an anatomic landmark in that pre-marking VLE image (vessel, dilated gland, mucosal fold, etc) was identified. The post-marking VLE dataset was then scanned to identify the frame that contained the same anatomic landmark. The longitudinal targeting error was defined from the post-marking VLE dataset as the distance in number of frames between the image that contained the landmark and the frame where the laser cautery marks were definitively visualized. The transverse targeting error was determined by measuring the distance along the circumference of the luminal surface between the center of the target and the landmark for both the pre-marking and post-marking VLE frames. The transverse targeting error was defined as the difference between these 2 values. Both transverse and longitudinal targeting errors are reported as absolute values. Data are reported as mean ± standard deviation.
RESULTS
The cautery-marking laser power emanating from the balloon-centering catheter was approximately 280 mW for the first 10 patients. One patient was excluded because of an esophageal stricture. During these procedures, a total of 14 sets of laser cautery marks were placed, with uneven success. Of these first 10 cases, only 6 sets of laser cautery marks (43%) were clearly visualized by endoscopy. For subsequent patients, the cautery-marking laser power transmitted through the balloon-centering catheter was increased to 410 mW. Case 12 was unsuccessful because of a software malfunction. For the remaining 10 cases (cases 13–22), 3 sets of marks were successfully applied to the esophagus. The subsequent results reported in this article are based on analysis of the last 10 cases in which the cautery-marking laser power transmitted by the balloon-centering catheter was fixed at 410 mW. These 10 participants were enrolled between February and June 2012. The patient characteristics are summarized in Table 1.
TABLE 1.
Summary of patient medical history (n = 10) included in the volumetric laser endomicroscopy–guided biopsy assessment
| Age (min, max) | 63 (50, 77) |
| Male, % | 90 |
| BMI (min, max) | 28.27 (21.84, 38.22) |
| Years of GERD history, % | |
| <5 | 20 |
| 5–10 | 30 |
| 10–15 | 20 |
| 15–20 | 10 |
| >20 | 20 |
| Prague Classification of BE segment, mean, cm | |
| C ± std | 5.1 ± 4.3 |
| M ± std | 5.7 ± 3.8 |
| Pathology, % | |
| BE | 100 |
| LGD | 30 |
| HGD | 30 |
| IMC | 20 |
| Alcohol history, drinks/wk, % | |
| 0 | 10 |
| 0–3 | 90 |
| Smoking history, % | |
| Never | 30 |
| Prior occasional | 10 |
| Prior regular | 60 |
| Hiatal hernia, % | 100 |
BMI, Body mass index; GERD, gastroesophageal reflux disease; BE, Barrett’s esophagus; LGD, low-grade dysplasia; HGD, high-grade dysplasia; IMC, intramucosal carcinoma; C, circumferential extent of metaplasia; M, maximum extent of metaplasia; Std, standard deviation.
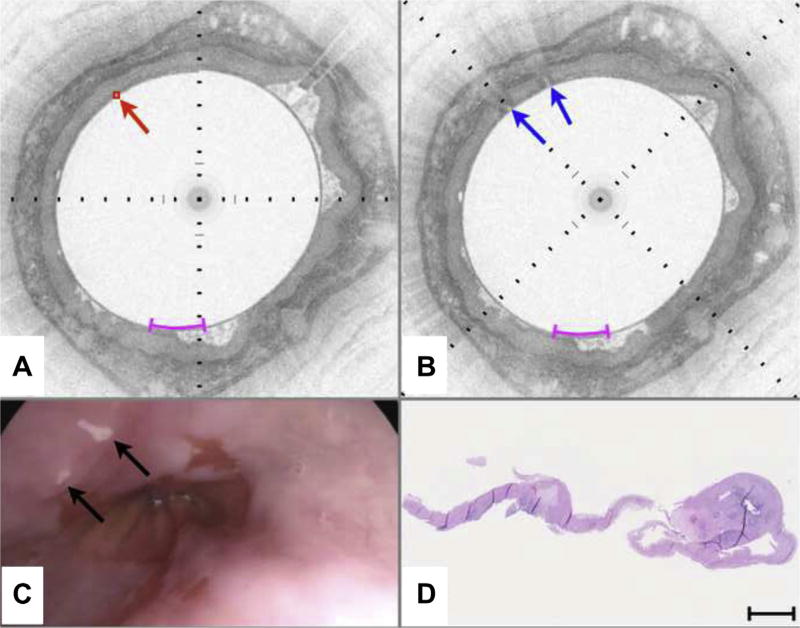
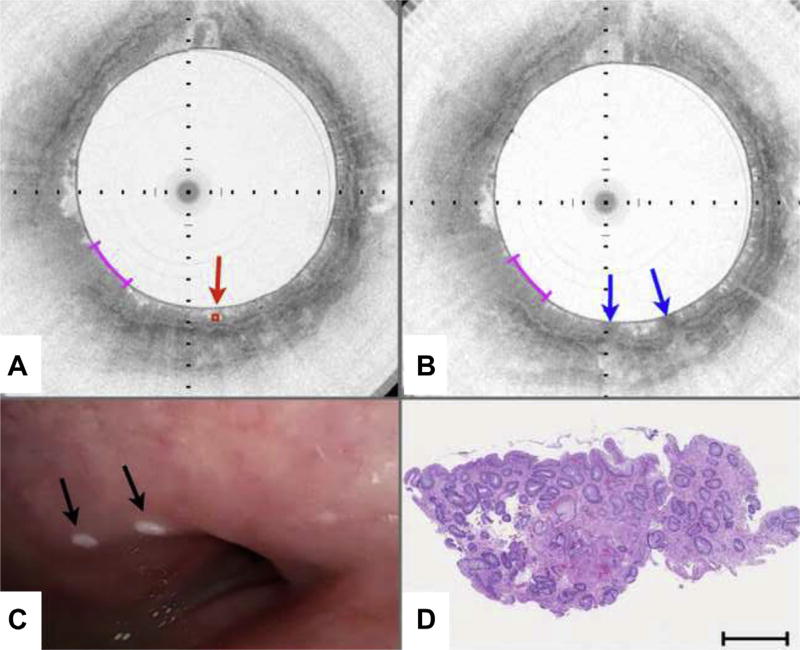
Figure 3 depicts a case of VLE-guided biopsy of squamous esophagus. The pre-marking image (Fig. 3A) shows the characteristic layered appearance of squamous mucosa that persists over the circumference of the cross-sectional image. A target was selected in an unremarkable portion of the esophageal wall (red diamond highlighted by arrow in Fig. 3A). After marking, 2 highly reflecting areas surrounding the target location can be identified (blue arrows in Fig. 3B). Video endoscopy clearly shows the 2 laser cautery spots (black arrows in Fig. 3C) as white dots on the esophageal wall. The rightmost laser cautery mark is elongated by a factor of approximately 2 compared with the leftmost mark, presumably because of balloon slippage during the 2-second cautery interval. Histopathology of the biopsy excised from between the marks (Fig. 3D) shows unremarkable squamous epithelium. Similarly, Figures 4 and 5 highlight cases of VLE-guided biopsy in columnarlined esophagus and both squamous and columnar-lined esophagus, respectively.
Figure 3.
VLE-guided biopsy of squamous mucosa in vivo. A, Pre-marking image in the study aspect ratio demonstrates that the entire esophageal wall circumference has a layered appearance consistent with squamous mucosa. An intent-to-biopsy site is selected (red box and arrow). B, The post-marking image in the study aspect ratio shows areas of high OCT signal in the squamous epithelium, surrounding the target site. C, Video endoscopy shows the laser cautery marks as focal, bright regions (black arrows) on the esophageal luminal surface. D, Histology from a biopsy excised at the marks shows squamous mucosa. Black tick marks in A and B, 350 µm in depth. Magenta scale bars in A and B, 5 mm along the circumference. Scale bar in D, 500 µm. VLE, volumetric laser endomicroscopy; OCT, optical coherence tomography.
Figure 4.
VLE–guided biopsy of columnar-lined esophageal mucosa in vivo. A, This pre-marking image displayed in the study aspect ratio has an optical coherence tomography (OCT) appearance that is consistent with columnar mucosa. An intent-to-biopsy site is selected (red box and arrow). B, The post-marking image displayed in the study aspect ratio shows areas of high OCT signal in the mucosa, flanking the intent-to-biopsy site. C, Video endoscopy shows the laser cautery marks as focal, bright regions (black arrows) on the esophageal wall. D, Histology from a biopsy specimen excised at the marks shows columnar mucosa with intestinal metaplasia. Black tick marks in A and B, 350 µm in depth. Magenta scale bars in A and B, 5 mm along the circumference. Scale bar in D, 500 µm. VLE, volumetric laser endomicroscopy; OCT, optical coherence tomography.
Figure 5.
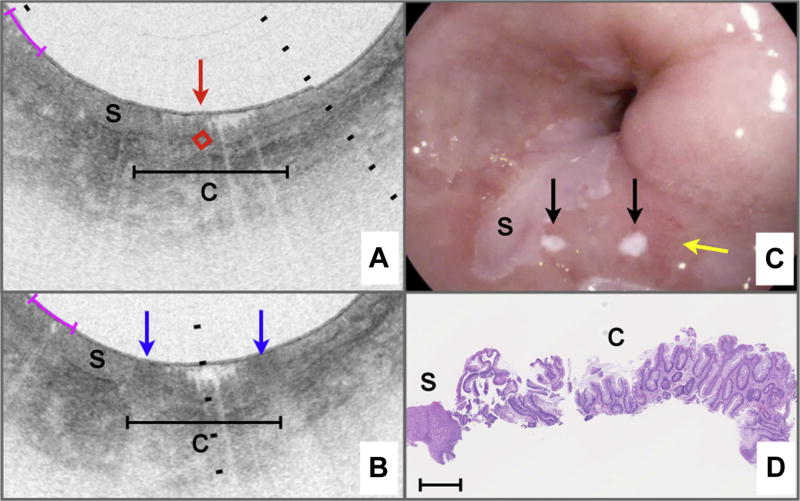
VLE–guided biopsy of columnar-lined esophageal and squamous mucosa in vivo. A, An area containing OCT features of columnar-lined esophagus (c) is identified as an intent-to-biopsy region (center of target region delineated by red diamond and arrow). This area is bordered on the left by tissue with OCT features of an island squamous mucosa (s). B, After the marking laser is activated, the superficially cauterized mucosa can be seen as darkened regions in this post-marking VLE image displayed in the study aspect ratio (blue arrows). C, Videoendoscopy performed after the balloon-centering catheter was withdrawn shows the 2 laser cautery marks (black arrows) within slightly reddened mucosa (yellow arrow), adjacent to a squamous island (s). D, Histology from the biopsy obtained at the marks shows columnar-lined esophagus with a small portion of adjacent squamous mucosa. Black tick marks in A and B, 350 µm in depth. Magenta scale bars in A and B, 3 mm along the circumference. Scale bar in D, 500 µm. VLE, volumetric laser endomicroscopy; OCT, optical coherence tomography.
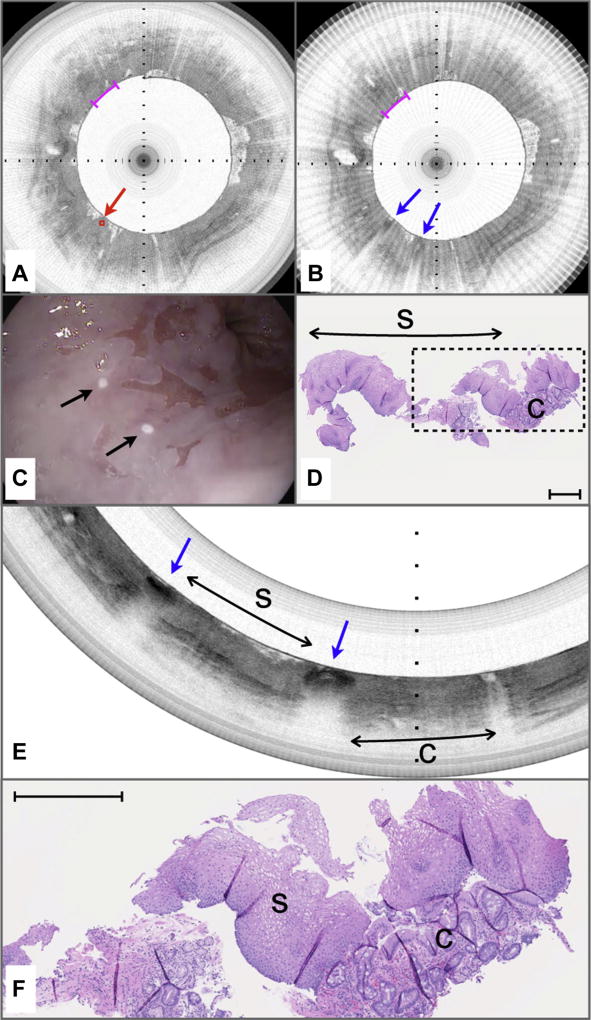
Figure 6 depicts a case that was missed by both pre-marking (intent to biopsy) and post-marking diagnoses that were rendered at a 5:1 aspect ratio. The target location in the pre-marking image (Fig. 6A) demonstrates a lack of a layered mucosal appearance and an irregular surface, indicative of columnar-lined esophageal mucosa. Likewise, the post-marking image demonstrates a similar tissue appearance in between the laser cautery sites (blue arrows in Fig. 6B). Video endoscopy indicates that the laser cautery marks likely bordered squamous mucosa (Fig. 6C). Histopathologic analysis of the excised biopsy shows a predominance of squamous epithelium with a small fragment of columnar epithelium with intestinal metaplasia (Fig. 6D). The pre-marking and post-marking OCT images for this case suffered from 2 issues. First, when the aspect ratio was 5:1 for review of pre-marking and post-marking images, a significant loss of displayed data and a compression of the images along their circumferential dimensions resulted. Second, both pre-marking and post-marking images (Fig. 6A, B) had a linear, radial striping artifact that infrequently occurs when there is noise in the imaging system; this artifact further confounded the interpretation of the images. Figure 6E depicts a reprocessed postmarking image that is displayed with the correct aspect ratio (1:1) and that has been filtered (median filter of 3 adjacent frames) to remove the striping artifact. The reprocessed image clearly shows that the majority of the tissue between the marks is squamous (Fig. 6E, s), as demonstrated by the characteristic layered architecture of this tissue type. The rightmost mark borders an area consistent with columnar-lined esophagus, which is verified in a magnified view of the corresponding histopathology that was obtained between the marks (Fig. 6F).
Figure 6.
Volumetric laser endomicroscopy (VLE)–guided biopsy of where the pre-marking and post-marking diagnoses in the study aspect ratio did not correspond to the majority histopathologic diagnosis. A, An area containing optical coherence tomography (OCT) features of columnar-lined esophagus (c) is identified as an intent-to-biopsy region (center of target region delineated by red diamond and arrow). B, After the marking laser is activated, the superficially cauterized mucosa can be seen as darkened regions in this post-marking VLE image (blue arrows). The region between the marks also was diagnosed as columnar-lined esophagus by the blinded OCT reviewer when it was assessed in the study aspect ratio as displayed. C, Videoendoscopy performed after the balloon-centering catheter was withdrawn shows the 2 laser cautery marks (black arrows) that are apparently on squamous mucosa. D, Histology from the biopsy specimen obtained at the marks shows a predominance of squamous epithelium with a small portion of columnar epithelium with intestinal metaplasia. E, The post-marking image displayed at the correct full aspect ratio and filtered to remove the radial striping artifact seen in B. This image demonstrates that the area between the marks has a layered appearance that is consistent with squamous mucosa (s). The rightmost mark borders tissue with OCT features of columnar mucosa (C). F, An expanded view of the histology in D shows squamous mucosa with a fragment of columnar-lined esophagus with intestinal metaplasia. Black tick marks in A and B, 350 µm in depth. Magenta scale bars in A and B, 3 mm along the circumference. Scale bar in D, 500 µm. Tick marks in E, 1 mm.
The mean time to select a single target site and perform laser cautery marking, comprising 2 marks that were separated by 6.0 mm, was 1.4 ± 0.44 minutes. The total duration of the guided biopsy marking procedure, from balloon catheter insertion to extraction, averaged 7.5 ± 1.6 minutes. All 30 laser cautery mark sets were clearly identified via videoendoscopy; the mean time for excision of the 3 biopsies for each patient was 5.8 ± 1.0 minutes. The total guided biopsy procedure time was 13.3 ± 2.2 minutes.
The transverse targeting error was measured to be 1.2 ± 1.3 mm (range 0.05 mm–5.1 mm). When the entire dataset was analyzed, the longitudinal targeting error was 0.5 ± 0.9 mm (range 0.0–3.6 mm). There were no longitudinal targeting errors in 21 of 30 (70%) cases. For the remaining 9 cases, in which it is presumed that peristalsis caused the balloon to move between pre-marking image acquisition and laser cautery, the longitudinal targeting error was 1.6 ± 1.0 mm.
Histopathologic analysis showed evidence of laser cautery in 17 of 30 (57%) biopsies. The cautery was observed at the periphery of the samples and did not hinder the pathologist’s ability to render a diagnosis. Histopathologic analysis revealed that 20 biopsy specimens (67%) predominantly contained columnar mucosa, and 10 (33%) predominantly contained squamous mucosa. Using the consensus histopathologic diagnosis as the criterion standard, we found that the accuracies for diagnosing tissue in between the laser cautery marks for video endoscopy was 67% (95% CI, 47%–83%), for intent to biopsy was 93% (95% CI, 78%–99%), for post-marking in the study aspect ratio was 97% (95% CI, 83%–100%), and for post-marking in the full aspect ratio was 100%. These results are summarized in Table 2.
TABLE 2.
Summary of results
| Accuracy | Sensitivity | Specificity | ||
|---|---|---|---|---|
| Consensus histopathologic diagnosis | ||||
| Columnar mucosa | 20/30 | |||
| Squamous mucosa | 10/30 | |||
| Intent-to-biopsy, % | 93 | 95 | 100 | |
| Study aspect ratio, % | 97 | 100 | 90 | |
| Full aspect ratio, % | 100 | 100 | 100 | |
| Endoscopy, % | 67 | 60 | 80 |
DISCUSSION
In this article, we have demonstrated a new paradigm for guided biopsy of the esophagus in which, during acquisition of a 3-dimensional microscopic esophageal dataset, the operator clicks on a target region of interest on the image and creates laser cautery marks that delineate the target in the patient. Our findings in humans show that VLE-guided biopsy, implemented using 410 mW cautery laser irradiation, is a safe technique that reliably provides endoscopically visible marks on the esophagus in a realistic procedure time (about 13 minutes).
Even though our device is a first prototype system, the distance between the intended mark location and the actual mark (targeting error) was low, approximately 1 mm along both circumferential and longitudinal dimensions. Our results also showed that this method accurately targets distinct esophageal tissue types—when biopsies in between the cautery sites were acquired, the intent to biopsy diagnosis matched the histopathologic diagnosis in 93% (28/30) of cases. After retrospective review of the 2 cases in which the intent-to-biopsy pre-marking diagnosis was discordant with histopathology, we found that, as is shown in Figure 6, it is likely that incorrect study aspect ratios and artifacts contributed to the misdiagnoses for these cases. The diagnoses after laser marking both in the study aspect and full aspect ratios also were highly accurate, indicating that VLE review after cautery may be an effective means for verifying that the correct site was marked.
A clear direction for this technology is the replacement of standard of care random biopsy with VLE-guided biopsy for BE surveillance procedures. Although other emerging endoscopic imaging techniques have been proposed for this purpose or have even been shown to improve biopsy yield,18,19 the advantage of VLE-guided biopsy is that the distal 6 cm of the esophagus is scanned in 3 dimensions at the microscopic level. The highest-yield biopsy sites can then be selected from this comprehensive microscopic dataset using cross-sectional microscopic morphologic criteria similar to those used for conventional histopathologic diagnosis.12 VLE-guided biopsy may therefore increase the probability that focal, microscopic regions within the esophagus that contain the most significant disease will not be missed.
Beyond guiding biopsy, as previously suggested in a recent editorial on VLE,20 this laser cautery marking procedure could be extended to outline the borders of high-grade dysplasia or intramucosal carcinoma, enabling more precise endoscopic mucosal resections or ablation therapy. It is also possible that VLE-guided biopsy could improve screening procedures—as demonstrated here and in other studies,21 video endoscopy is not as accurate as endomicroscopy for identifying esophageal columnar metaplasia. Therefore, the decision regarding whether or not to take screening biopsies and where to take those biopsies from could be enhanced by VLE-guided biopsy.
In this study, the video endoscopy movies were recorded digitally, and segments of these movies were provided to the blinded gastroenterologist who provided an endoscopic diagnosis off line. Because this methodology is not the same as performing a diagnosis during the procedure, it likely does not constitute a standard-of-care diagnosis, and, therefore, the endoscopy results should be interpreted accordingly. An additional limitation to the guided biopsy prototype technology tested here is that VLE was not indicated in patients with esophageal strictures because of the fixed balloon size of 25 mm in diameter. In addition, prior studies have demonstrated that the diagnostic accuracy of OCT may be reduced in the presence of significant inflammation.13
In this study, we tested the capability of VLE-guided biopsy to target and obtain biopsy specimens of columnarlined esophagus versus squamous mucosa and mixtures thereof. In order for VLE-guided biopsy to be effective for surveillance, targeting will need to be based on image features of high-grade dysplasia and intramucosal carcinoma. Although we expect that OFDI-based VLE will be at least as sensitive and/or specific as prior-generation OCT technologies for dysplasia,12 the accuracy of balloon-catheter VLE for dysplasia has yet to be tested. Notably, the laser cautery marking technique demonstrated here is essential for the conduct of future histopathologic correlation studies, because it provides the means for obtaining corresponding VLE image and histopathology datasets. Similarly, the time and the amount of expertise that are required to render dysplasia diagnoses from VLE datasets during the procedure are open questions—automated computer algorithms to pare down the enormous amount of microscopic information acquired by VLE could be beneficial in this respect. Finally, this is a single-center study that has been conducted in a small number of patients to demonstrate safety and feasibility and provide an initial assessment of the targeting accuracy of this guided-biopsy methodology. Larger, multicenter trials need to be conducted to evaluate VLE-guided biopsy in real-world endoscopy settings, to determine the differences in procedure time and financial cost relative to random biopsy, and ultimately to demonstrate tangible improvements in patient outcomes. Our initial experience with this new platform supports the notion that VLE-guided biopsy of the esophagus is safe and may be used to mark tissue regions of interest for subsequent biopsy and therapeutic guidance.
Take-home Message.
Volumetric laser endomicroscopy (VLE) is an imaging technique for obtaining microscopic images of the entire distal esophagus.
In this article, the authors show that VLE-guided biopsy using laser cautery marking is feasible and safe in vivo.
Acknowledgments
The authors gratefully acknowledge the support of W. Puricelli, A. Soomro, and J. Namati. We additionally would like to thank M. Shishkov for his technical assistance with device and component fabrication. We also acknowledge NinePoint Medical for use of their VLE viewer for visualization of images at a 1:1 aspect ratio.
DISCLOSURE: Study data were collected and managed with REDCap electronic data capture tools hosted at Massachusetts General Hospital. Funding was provided by grants from the National Institutes of Health R01DK091923 (G.K.T.), R01CA103769 (G.J.T.), R21CA141884 (G.J.T.), and R00CA134920 (M.J.S.). Massachusetts General Hospital has a licensing arrangement with NinePoint Medical. M. Suter, B. Bouma, N. Nishioka, and G. Tearney have the rights to receive royalties from this licensing arrangement. G. Tearney, N. Nishioka, and B. Bouma consult for NinePoint Medical, and M. Suter, B. Bouma, and G. Tearney receive sponsored research funding from NinePoint Medical.
Abbreviations
- BE
Barrett’s esophagus
- OFDI
optical frequency domain imaging
- OCT
optical coherence tomography
- VLE
volumetric laser endomicroscopy
- IMC
intramucosal carcinoma
- RJ
rotary junction
Footnotes
All other authors disclosed no financial relationships relevant to this publication.
References
- 1.Lagergren J, Bergstrom R, Lindgren A, et al. Symptomatic gastroesophageal reflux as a risk factor for esophageal adenocarcinoma. N Engl J Med. 1999;340:825–31. doi: 10.1056/NEJM199903183401101. [DOI] [PubMed] [Google Scholar]
- 2.Eloubeidi MA, Provenzale D. Does this patient have Barrett’s esophagus? The utility of predicting Barrett’s esophagus at the index endoscopy. Am J Gastroenterol. 1999;94:937–43. doi: 10.1111/j.1572-0241.1999.990_m.x. [DOI] [PubMed] [Google Scholar]
- 3.Dulai GS. Surveying the case for surveillance. Gastroenterology. 2002;122:820–3. doi: 10.1053/gast.2002.32093. [DOI] [PubMed] [Google Scholar]
- 4.Falk GW, Chittajallu R, Goldblum JR, et al. Surveillance of patients with Barrett’s esophagus for dysplasia and cancer with balloon cytology. Gastroenterology. 1997;112:1787–97. doi: 10.1053/gast.1997.v112.pm9178668. [DOI] [PubMed] [Google Scholar]
- 5.Streitz JM, Jr, Andrews CW, Jr, Ellis FH., Jr Endoscopic surveillance of Barrett’s esophagus. Does it help? J Thorac Cardiovasc Surg. 1993;105:383–7. discussion 7–8. [PubMed] [Google Scholar]
- 6.Suter MJ, Vakoc BJ, Yachimski PS, et al. Comprehensive microscopy of the esophagus in human patients with optical frequency domain imaging. Gastrointest Endosc. 2008;68:745–53. doi: 10.1016/j.gie.2008.05.014. [DOI] [PMC free article] [PubMed] [Google Scholar]
- 7.Yun SH, Tearney GJ, Vakoc BJ, et al. Comprehensive volumetric optical microscopy in vivo. Nat Med. 2006;12:1429–33. doi: 10.1038/nm1450. [DOI] [PMC free article] [PubMed] [Google Scholar]
- 8.Bouma BE, Tearney GJ, Compton CC, et al. High-resolution imaging of the human esophagus and stomach in vivo using optical coherence tomography. Gastrointest Endosc. 2000;51:467–74. doi: 10.1016/s0016-5107(00)70449-4. [DOI] [PubMed] [Google Scholar]
- 9.Sergeev A, Gelikonov V, Gelikonov G, et al. In vivo endoscopic OCT imaging of precancer and cancer states of human mucosa. Opt Express. 1997;1:432–40. doi: 10.1364/oe.1.000432. [DOI] [PubMed] [Google Scholar]
- 10.Sivak MV, Jr, Kobayashi K, Izatt JA, et al. High-resolution endoscopic imaging of the GI tract using optical coherence tomography. Gastrointest Endosc. 2000;51:474–9. doi: 10.1016/s0016-5107(00)70450-0. [DOI] [PubMed] [Google Scholar]
- 11.Evans JA, Bouma BE, Bressner J, et al. Identifying intestinal metaplasia at the squamocolumnar junction by using optical coherence tomography. Gastrointest Endosc. 2007;65:50–6. doi: 10.1016/j.gie.2006.04.027. [DOI] [PMC free article] [PubMed] [Google Scholar]
- 12.Evans JA, Poneros JM, Bouma BE, et al. Optical coherence tomography to identify intramucosal carcinoma and high-grade dysplasia in Barrett’s esophagus. Clin Gastroenterol Hepatol. 2006;4:38–43. doi: 10.1053/S1542-3565(05)00746-9. [DOI] [PMC free article] [PubMed] [Google Scholar]
- 13.Poneros JM, Brand S, Bouma BE, et al. Diagnosis of specialized intestinal metaplasia by optical coherence tomography. Gastroenterology. 2001;120:7–12. doi: 10.1053/gast.2001.20911. [DOI] [PubMed] [Google Scholar]
- 14.Isenberg G, Chak A. Should there be light in the esophageal tunnel? An appraisal of optical coherence tomography in Barrett’s esophagus. Gastrointest Endosc. 2007;65:57–9. doi: 10.1016/j.gie.2006.06.014. [DOI] [PubMed] [Google Scholar]
- 15.Vakoc BJ, Shishko M, Yun SH, et al. Comprehensive esophageal microscopy by using optical frequency-domain imaging (with video) Gastrointest Endosc. 2007;65:898–905. doi: 10.1016/j.gie.2006.08.009. [DOI] [PMC free article] [PubMed] [Google Scholar]
- 16.Carignan CS, Yagi Y. Optical endomicroscopy and the road to real-time, in vivo pathology: present and future. Diagnost Pathol. 2012;7:98. doi: 10.1186/1746-1596-7-98. [DOI] [PMC free article] [PubMed] [Google Scholar]
- 17.Suter MJ, Jillella PA, Vakoc BJ, et al. Image-guided biopsy in the esophagus through comprehensive optical frequency domain imaging and laser marking: a study in living swine. Gastrointest Endosc. 2010;71:346–53. doi: 10.1016/j.gie.2009.07.007. [DOI] [PMC free article] [PubMed] [Google Scholar]
- 18.Jayasekera C, Taylor AC, Desmond PV, et al. Added value of narrow band imaging and confocal laser endomicroscopy in detecting Barrett’s esophagus neoplasia. Endoscopy. 2012;44:1089–95. doi: 10.1055/s-0032-1325734. [DOI] [PubMed] [Google Scholar]
- 19.Wolfsen HC, Crook JE, Krishna M, et al. Prospective, controlled tandem endoscopy study of narrow band imaging for dysplasia detection in Barrett’s esophagus. Gastroenterology. 2008;135:24–31. doi: 10.1053/j.gastro.2008.03.019. [DOI] [PubMed] [Google Scholar]
- 20.Wallace MB. Somewhere over the rainbow. Gastrointest Endosc. 2010;71:354–6. doi: 10.1016/j.gie.2009.09.026. [DOI] [PubMed] [Google Scholar]
- 21.Wang A, Mattek NC, Corless CL, et al. The value of traditional upper endoscopy as a diagnostic test for Barrett’s esophagus. Gastrointest Endosc. 2008;68:859–66. doi: 10.1016/j.gie.2008.02.064. [DOI] [PMC free article] [PubMed] [Google Scholar]


