

Abstract
Idiopathic pneumonia syndrome (IPS) is a non-infectious pulmonary complication after hematopoietic cell transplantation (HCT) and is difficult to diagnose. We evaluated six candidate proteins in plasma samples at day 7 after HCT and at onset of IPS from 41 IPS cases to identify potential IPS diagnostic or prognostic biomarkers. Samples at similar times from 162 HCT recipients without documented infections and 37 HCT recipients with respiratory viral pneumonia served as controls. In multivariable models, a combination of Stimulation-2 (ST2, OR 2.8; p<0.001) and Interleukin-6 (IL-6, OR 1.4; p=0.025) was the best panel to distinguish IPS at diagnosis from unaffected controls, while tumor necrosis factor receptor 1 (TNFR1, OR 2.9; p=0.002) was the best marker when comparing patients with IPS and viral pneumonia. The area under the curve of the receiver operating characteristic (ROC) curves for discriminating between IPS and unaffected controls at day 7 post-HCT were 0.8 for ST2, 0.75 for IL-6, and 0.68 for TNFR1. Using estimated sensitivity and specificity values from cutoffs determined with the ROC analysis (cutoff level: ST2, 21 ng/mL; IL-6, 61 pg/mL; TNFR1 3421 pg/mL), we calculated positive predictive values (PPV) for a range of estimated population prevalence values of IPS. Among the three markers, ST2 showed the highest PPV for IPS occurrence. Based on an 8% assumed prevalence, a positive ST2 test increased likelihood of IPS to 50%. We conclude that a prospective validation study is warranted to determine whether a plasma biomarker panel can help with the non-invasive diagnosis and prognosis of IPS.
Keywords: Plasma biomarker, Idiopathic pneumonia syndrome, Viral pneumonia, ST2, IL-6, TNFR1
INTRODUCTION
Idiopathic pneumonia syndrome (IPS) is a non-infectious pulmonary complication with diffuse lung injury after hematopoietic cell transplantation (HCT).1, 2 IPS develops in 4-12% of HCT recipients,3–7 and according to our recent study, the mortality rate by day 100 after IPS is as high as 70%.8 Current diagnostic criteria for IPS are widespread alveolar injury with symptoms and signs of pneumonia and no active lower respiratory tract infection.1, 2 In fact, our previous study showed that approximately half of the patients with previously diagnosed IPS had viral pathogens detected in bronchoalveolar lavage (BAL) samples, suggesting that distinguishing viral pneumonia from IPS is difficult if we use only clinical criteria.8 Although the evaluation of a BAL sample is necessary to diagnose IPS, the significance of detecting viral pathogen in the pathogenicity of pneumonia, especially with low viral load, is not necessarily clear, and bronchoscopic evaluation is occasionally unfeasible due to the patient conditions. Therefore, non-invasive blood tests that could aid in IPS diagnosis (an assay that accurately identifies patients at the onset of clinical disease) and prognosis (an assay that categorizes patients by degree of risk for disease occurrence) are required.9
Mortality after IPS remains high and the current standard treatment for IPS is high-dose corticosteroids. Although TNF-α receptor inhibitor is a promising drug, it has not been established for the treatment of IPS.10–12 Considering the high mortality rate, identification of IPS cases in the early phase of IPS for potential preemptive intervention might be critical.
Plasma biomarkers may be useful tools to support disease diagnosis, risk-stratify before the onset of clinical signs, or predict the outcomes because of the simplicity of sampling. No biomarkers for IPS have been identified so far. Based on previous reports, tumor necrosis factor receptor 1 (TNFR1) and interleukin-6 (IL-6) are candidate biomarkers for IPS since they were elevated in BAL samples from patients with IPS.10, 13 Stimulation 2 (ST2) can be a candidate considering that it is elevated in acute lung injury14–18 and an important biomarker of graft-versus-host disease (GVHD).19–25 Three other proteins (lymphocyte vessel endothelial receptor [LYVE], endothelial protein C receptor [EPCR], and herpes virus entry mediator [HVEM]) were selected as potential candidate based on a separate proteomics analysis (unpublished data).
The aim of this study was to validate the usefulness of adding candidate biomarkers for the diagnosis and/or prognosis of IPS, as well as to compare their profiles to those of viral pneumonia.
METHODS
Study design
Among patients transplanted between 1988 and 2014 at the Fred Hutchinson Cancer Research Center (Fred Hutch), we identified 41 patients with IPS within 100 days after HCT based on radiographic findings and exclusion of occult virus or fungus infections by multiplex PCR assay and aspergillus galactomannan assay using frozen BAL and serum samples as recently reported.8 We routinely performed conventional cultures, shell viral culture, and direct fluorescent antibody testing to detect pathogens using BAL samples. Cases of viral pneumonia due to parainfluenza virus (PIV) or human rhinovirus (HRV) documented in BAL samples obtained within 100 days after HCT without co-pathogens were also selected as a comparative cohort.26,27 Transplant recipients who did not require bronchoscopic examination and who did not grow any bacterial or fungal blood cultures within 100 days after HCT were considered as unaffected controls. Patients’ demographic data and transplant information were retrieved from the Fred Hutch database. The study was approved by the Institutional Review Boards at Indiana University and Fred Hutch.
Laboratory testing
Cryopreserved plasma samples from day 7 post HCT and within one week prior to or no more than one day after onset of each event were analyzed. The “onset sample” for unaffected controls was the sample closest to day 24, which was the median day+1 of onset for patients with IPS. We selected six candidate proteins based on the literature and unpublished preliminary data, ST2, TNFR1, IL-6, LYVE, EPCR, and HVEM. ELISA was purchased from R&D systems (Minneapolis, USA) and a sequential ELISA workflow was used as previously reported.28
Statistical analysis
Logistic regression models were used to evaluate associations between each analyte in HCT recipients with IPS versus unaffected controls or versus those with viral pneumonia. Analyte concentrations were log2 transformed. Univariable models were fit using each analyte and an adjusted model for each analyte was constructed in a step up fashion, adding demographic and clinical variables to the model for each analyte and retaining those in the model if their inclusion modified the association of the analyte with outcome by more than 10%. Multi-analyte models were developed to determine whether combinations of proteins improved discrimination between IPS patients and control cohorts. Analytes were added to the model in a step-up fashion, selecting the model with the lowest Akaike Information Criteria (AIC). The area under the curve (AUC) of the receiver operating characteristic (ROC) curve was evaluated for each analyte to assess its ability to discriminate between patients with IPS and controls or those with viral pneumonia. Predictive values were calculated using the sensitivity and specificity for the cutoff point that is closest to the top left corner of each ROC plane and assuming a range of prevalence values (0 to 15%) for IPS. Weighted versions of Kaplan-Meier survival curves were estimated for high versus low cytokine subgroups with a log-rank test to evaluate p-values. Since the proportion of subjects with IPS was far higher in our combined cohorts than would be expected in a typical HCT population, individuals were weighted so that subjects with IPS represented a more plausible 8% prevalence of IPS for the survival analysis. Cox regression, among IPS patients, was used to assess associations between each analyte’s onset value with day 200 post-infection survival. Given the limited number of subjects, models were adjusted by the one clinical or demographic feature whose inclusion effected the greatest change (at least 10%) on the analyte’s association with outcome. Two-sided p values < 0.05 were considered statistically significant. All statistical analyses were performed using R version 3.3.2.29
RESULTS
Patient characteristics
We evaluated 41 IPS patients with cryopreserved plasma samples. As comparative cohorts, there were 1) 162 unaffected patients without bronchoscopic examination and any documented infections, and 2) 37 patients with PIV or HRV infection within 100 days after HCT. Characteristics of each cohort are shown in Table 1. The median onset days after HCT were 23 and 35 days in IPS and viral pneumonia cases, respectively. HCT recipients in unaffected controls included more recent HCT recipients, and peripheral blood stem cell as a cell source and reduced intensity conditioning were used more often among IPS or viral pneumonia cases than in unaffected controls. Clinical presentations in IPS and viral pneumonia cases are generally similar. Among the 41 IPS cases, 10 (24%) received corticosteroid at onset of IPS, while only 1 (2%) had corticosteroid at the time of day 7 sample collection.
Table 1.
Patient characteristics in each cohort (N=240)
| IPS (n=41) |
Controls (n=162) |
PIV or HRV (n=37) |
p-value (IPS vs Controls) | p-value (IPS vs PIV/HRV) | |
|---|---|---|---|---|---|
| Age at HCT, year* | 47 (1-69) | 56 (15-74) | 42 (1-66) | <0.001 | 0.25 |
| Sex | |||||
| Male | 20 (49) | 91 (56) | 24 (65) | 0.48 | 0.18 |
| Female | 21 (51) | 71 (44) | 13 (35) | ||
| Transplant year | <0.001 | 0.84 | |||
| 1988-1996 | 10 (24) | 8 (5) | 8 (22) | ||
| 1997-2005 | 14 (34) | 33 (20) | 11 (30) | ||
| 2006-2014 | 17 (41) | 121 (75) | 18 (49) | ||
| Stem cell source | <0.001 | 0.27 | |||
| Bone marrow | 23 (56) | 12 (7) | 14 (38) | ||
| Peripheral blood stem cell | 15 (37) | 150 (93) | 18 (49) | ||
| Cord blood | 3 (7) | 0 (0) | 5 (14) | ||
| Donor type | |||||
| Matched related | 19 (39) | 75 (47) | 5 (14) | 0.021 | 0.08 |
| Mismatched related** | 4 (10) | 12 (7) | 4 (11) | ||
| Matched unrelated | 11 (27) | 63 (39) | 16 (43) | ||
| Mismatched unrelated | 10 (24) | 12 (7) | 12 (32) | ||
| Sex mismatch | 0.71 | 0.59 | |||
| Match | 24 (58) | 85 (53) | 18 (48) | ||
| Male to female | 11 (27) | 44 (27) | 11 (30) | ||
| Female to male | 6 (15) | 33 (20) | 8 (22) | ||
| Conditioning regimen | <0.001 | 1.00 | |||
| Myeloablative | 34 (83) | 20 (12) | 30 (81) | ||
| Reduced intensity | 7 (17) | 142 (88) | 7 (19) | ||
| TBI level | <0.001 | 0.96 | |||
| None | 10 (24) | 4 (3) | 10 (27) | ||
| Low (≤4.5 Gy) | 11 (27) | 151 (93) | 10 (27) | ||
| High (≥10 Gy) | 20 (49) | 7 (4) | 17 (46) | ||
| GVHD prophylaxis | <0.001 | 0.68 | |||
| CNI+MTX | 27 (66) | 10 (6) | 21 (57) | ||
| CNI+MMF | 9 (22) | 138 (85) | 11 (30) | ||
| Other | 5 (12) | 14 (9) | 5 (13) | ||
| Antithymocyte use | <0.001 | 0.52 | |||
| No | 36 (88) | 161 (99) | 29 (78) | ||
| During conditioning | 4 (10) | 0 (0) | 5 (14) | ||
| Between day 7 and onset | 1 (2) | 1 (1) | 3 (8) | ||
| Acute GVHD | 0.056 | 0.47 | |||
| 0-1 | 15 (37) | 87 (54) | 10 (27) | ||
| 2-4 | 26 (63) | 75 (46) | 27 (73) | ||
| Onset day, days* | 23 (3-99) | – | 35 (6-100) | ||
| Oxygen requirement | <0.001 | 0.038 | |||
| None | 11 (27) | 162 (100) | 19 (51) | ||
| Any | 29 (71) | 0 (0) | 18 (49) | ||
| Missing | 1 (2) | 0 (0) | 0 (0) |
All values are indicated as the number (percentage).
Values are indicated as the median (range).
Haploidentical donors are included.
Abbreviations: IPS, idiopathic pneumonia syndrome; PIV, parainfluenza virus; HRV, human rhinovirus; HCT, hematopoietic cell transplantation; TBI, total body irradiation; GVHD, graft-versus-host disease, CNI, calcineurin inhibitor; MTX, methotrexate; MMF, mycophenolate mofetil
Comparison of biomarkers between IPS and controls or viral pneumonia at onset and day 7 post-HCT
The concentrations of six candidate proteins selected based on the literature and unpublished preliminary data (EPCR, HVEM, IL-6, LYVE1, ST2, and TNFR1) were measured at IPS onset and day 7 after HCT, and are shown in Supplemental Figure 1 for each group. The concentrations of IL-6, ST2, and TNFR1 at onset showed trends of increasing median values across groups from the unaffected control to the viral pneumonia to the IPS cohorts. The concentrations at day 7 after HCT, which is generally before the onset of IPS (two cases measured within one day following diagnosis), showed similar trends for IL-6 and ST2.
Univariable logistic regression models were used to predict IPS versus unaffected controls and versus viral pneumonia cases based on biomarkers sampled at onset time (Table 2). IPS cases had significantly elevated HVEM, IL-6, LYVE1, ST2, and TNFR1 in comparison with unaffected controls and the same five analytes except ST2 were elevated in comparison with viral pneumonia cases. IL-6, ST2, and TNFR1 were significantly increased at day 7 post-HCT for patients who will eventually develop an IPS as compared to unaffected controls, and only TNFR1 was significantly elevated in IPS at day 7 in comparison to viral pneumonia cases. To evaluate if the biomarkers could improve our prognostic ability for IPS occurrence over clinical criteria only, combinations of multiple analytes was analyzed. ST2 and IL-6 was the best combination for the comparison of IPS with controls both at onset and day 7 post-HCT (Table 3). On the other hand, no other marker added to the ability of TNFR1 to distinguish IPS from viral infections at onset of clinical signs.
Table 2.
Univariable logistic regression models predicting IPS in comparison to unaffected controls and to viral pneumonia cases
| Onset | Day 7 after HCT | |||||
|---|---|---|---|---|---|---|
| Odds Ratio* (95% CI) |
Odds Ratio* (95% CI) |
|||||
| AUC | P Value | AUC | P Value | |||
| IPS vs Controls | ||||||
| EPCR | 0.62 | 1.3 (0.9-1.8) | 0.22 | 0.51 | 0.9 (0.5-1.3) | 0.53 |
| HVEM | 0.66 | 2.0 (1.2-3.1) | 0.004 | 0.52 | 1.0 (0.6-1.6) | 0.98 |
| IL-6 | 0.79 | 1.6 (1.3-2.0) | <0.001 | 0.75 | 1.5 (1.2-1.8) | <0.001 |
| LYVE1 | 0.67 | 2.5 (1.5-4.3) | <0.001 | 0.53 | 1.3 (0.8-2.1) | 0.33 |
| ST2 | 0.89 | 3.0 (2.3-4.3) | <0.001 | 0.80 | 2.3 (1.7-3.1) | <0.001 |
| TNFR1 | 0.84 | 5.3 (3.1-9.8) | <0.001 | 0.68 | 2.1 (1.3-3.4) | 0.001 |
| IPS vs PIV+HRV | ||||||
| EPCR | 0.61 | 1.7 (0.9-3.5) | 0.08 | 0.53 | 0.8 (0.4-1.6) | 0.59 |
| HVEM | 0.66 | 2.3 (1.2-5.0) | 0.013 | 0.61 | 1.5 (0.8-3.0) | 0.23 |
| IL-6 | 0.70 | 1.6 (1.1-2.3) | 0.006 | 0.60 | 1.3 (0.9-1.9) | 0.11 |
| LYVE1 | 0.67 | 2.5 (1.3-5.4) | 0.006 | 0.56 | 1.4 (0.8-2.7) | 0.26 |
| ST2 | 0.63 | 1.3 (1.0-1.7) | 0.07 | 0.57 | 1.2 (0.9-1.6) | 0.29 |
| TNFR1 | 0.72 | 2.9 (1.5-6.0) | <0.001 | 0.65 | 1.8 (1.0-3.2) | 0.034 |
Odds ratios represent relative odds due to a 2-fold increase in concentration of each protein.
Abbreviations: IPS, idiopathic pneumonia syndrome; HCT, hematopoietic cell transplantation; AUC, area under the curve; CI, confidence interval; PIV, parainfluenza virus; HRV, human rhinovirus
Table 3.
Multi-analyte analysis of biomarkers comparing IPS with controls or viral pneumonia
| Onset | Day 7 after HCT | |||
|---|---|---|---|---|
| Odds Ratio* (95% CI) |
Odds Ratio* (95% CI) |
|||
| P Value | P Value | |||
| IPS vs Controls | ||||
| IL-6 | 1.4 (1.0-1.9) | 0.025 | 1.3 (1.0-1.6) | 0.066 |
| ST2 | 2.8 (2.0-4.0) | <0.001 | 2.0 (1.5-2.8) | <0.001 |
| IPS vs PIV+HRV | ||||
| EPCR | – | – | 0.5 (0.2-1.2) | 0.12 |
| TNFR1 | 2.9 (1.5-6.0) | <0.001 | 2.2 (1.2-4.5) | 0.010 |
Odds ratios represent relative odds due to a 2-fold increase in concentration of each protein.
Abbreviations: IPS, idiopathic pneumonia syndrome; HCT, hematopoietic cell transplantation; CI, confidence interval; PIV, parainfluenza virus; HRV, human rhinovirus
We further analyzed each analyte in multivariable models that also included clinical factors that proved to be important in each model (Figure 1 and Supplemental Table 1). The adjustment variables included in each model are indicated in Figure 1. At the onset of IPS, HVEM (OR 2.8; p=0.001), ST2 (OR 3.8; p=0.004), and TNFR1 (OR 3.3; p=0.013) distinguished IPS from unaffected controls. TNFR1 (OR 3.4; p<0.001) was the major protein that could discriminate IPS from viral pneumonia. For prognosis at day 7 post-HCT, IL-6 (OR 1.4; p=0.007) and ST2 (OR 2.3; p=0.013) were discriminating best IPS from unaffected controls, while there was no significant marker discriminating between IPS and viral pneumonia at this time point.
Figure 1. Multivariable logistic regression models predicting IPS.
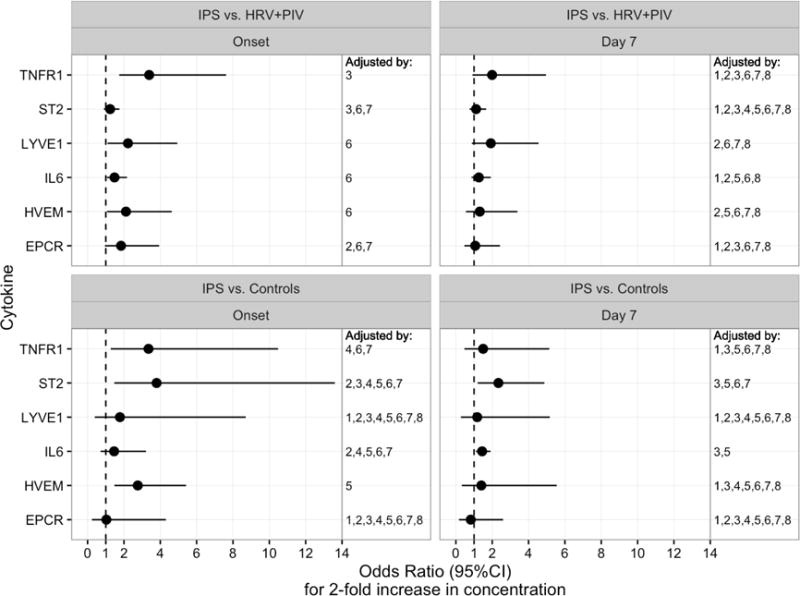
Forest plots show the odds ratios for a 2-fold increase in concentration of each protein at the onset or day 7 after HCT from IPS cases compared to controls (upper panels) or viral pneumonia (lower panels). A multivariable model for each analyte was constructed in a step up fashion by adding clinical variables to the model that modified the association of the analyte with the outcome by more than 10%. Final adjustment factors included in each model are indicated by numbers shown in the right column of each panel, indicating inclusion of selected adjustment variables numbered as follows: 1. sex, 2. transplant age, 3. presence of acute GVHD, 4. transplant year, 5. intensity of conditioning, 6. oxygen requirement at the time of sampling, 7. cell source, 8. donor type.
Abbreviations: HCT, hematopoietic cell transplantation; IPS, idiopathic pneumonia syndrome; HRV, human rhinovirus; PIV, parainfluenza virus; EPCR, endothelial protein C receptor; HVEM, herpes virus entry mediator; IL-6, interleukin-6; LYVE1, lymphocyte vessel endothelial receptor; ST2, Stimulation 2; TNFR1, tumor necrosis factor receptor 1.
Biomarker values as predictors for IPS
We next produced ROC curves for each biomarker without adjustment for clinical factors to obtain thresholds with optimized sensitivity and specificity for IPS (Figure 2). Comparing between IPS cases and controls, ST2 provided the highest AUC (0.89) followed by TNFR1 (0.84) and IL-6 (0.79) at onset (Figure 2A). Cutoff values identified from the top left point of the ROC curve that best balance between the true positive rate and false positive rate, were identified as 49 ng/mL, 5113 pg/mL, and 36 pg/mL for ST2, TNFR1, and IL-6, respectively. At day 7 after HCT, AUC values were lower, but ST2, TNFR1, and IL-6 had relatively high AUC (ST2, 0.80; TNFR1, 0.68; IL-6, 0.75) and the cutoff values defined at the top left point of the curve are 21 ng/mL for ST2, 3421 pg/mL for TNFR1, and 61 pg/mL for IL-6 (Figure 2B). In distinguishing between IPS and viral pneumonia with the onset sample, TNFR1 (top left cutoff, 7033 pg/mL) and IL-6 (top left cutoff, 45 pg/mL) showed highest AUC, although they were relatively low for all the analytes (Figure 2C). Since ST2 and IL-6 together provided the best model fit for the comparison of IPS cases with controls (Table 3), we calculated ROC curves based on the multiple cytokine models (Figure 3). AUC at onset and at day 7 after HCT were 0.91 and 0.83, respectively, which are similar to those provided by ST2 alone (Figure 2A and B).
Figure 2. ROC curves using protein concentration.
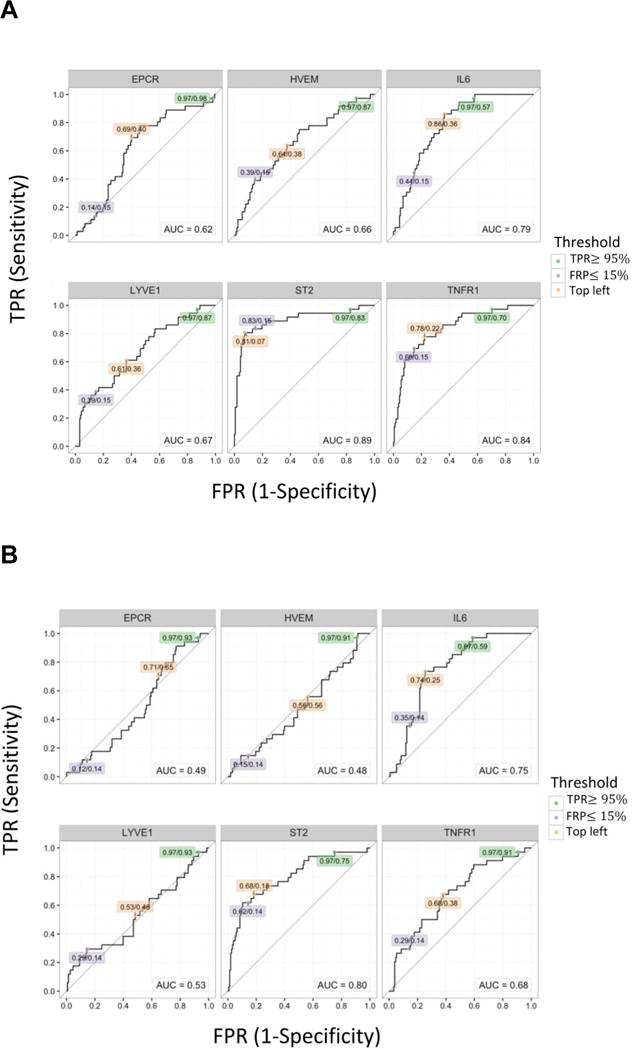

(A) ROC curves of each protein comparing to controls at the onset. (B) ROC curves of each protein comparing to controls at day 7 post-HCT. (C) ROC curves of each protein comparing to viral pneumonia at the onset. The values in labels indicate TPR/FPR at each threshold; Green: TPR ≥ 95%, Light purple: FPR ≤ 15%, Orange: top left.
Abbreviations: ROC, receiver operating characteristic; HCT, hematopoietic cell transplantation; TPR, true positive rate; FPR, false positive rate; EPCR, endothelial protein C receptor; HVEM, herpes virus entry mediator; IL-6, interleukin-6; LYVE1, lymphocyte vessel endothelial receptor; ST2, Stimulation 2; TNFR1, tumor necrosis factor receptor 1.
Figure 3. ROC curves in multiple cytokine models.
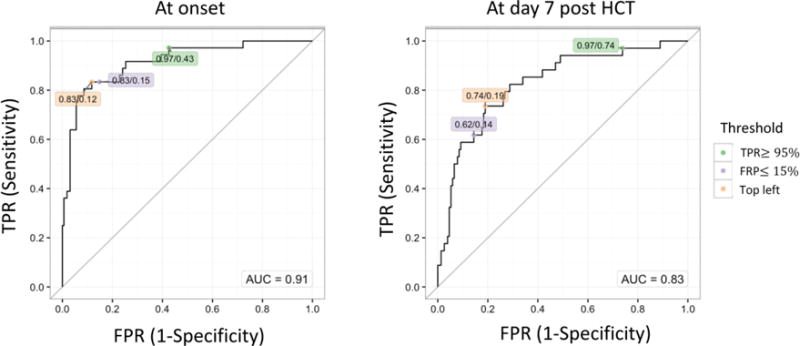
ROC curves in the combination of ST2 and IL-6 comparing to controls at the onset or at day 7 post-HCT. The values in labels indicate TPR/FPR at each threshold; Green: TPR ≥ 95%, Light purple: FPR ≤ 15%, Orange: top left.
Abbreviations: ROC, receiver operating characteristic; ST2, Stimulation 2; IL-6, interleukin-6; HCT, hematopoietic cell transplantation; TPR, true positive rate; FPR, false positive rate.
Based on the cutoff values at the top left corner of the ROC curves, sensitivity and specificity values were determined and used in combination with a hypothetical range of IPS prevalence values (0 to 15%) to estimate positive and negative predictive values for each analyte. Positive predictive values (PPV) for IPS in comparison to unaffected controls are highest in ST2 followed by TNFR1 and IL-6 (Figure 4). For instance, assuming that the prevalence of IPS among all HCT recipients is 8%, a patient with ST2 value greater than 49 ng/mL measured at the onset of symptoms has 50% chance of having an IPS diagnosis, a 6-fold increase over the a priori 8% chance of identifying an IPS case. When measured at day 7 post HCT, a patient with ST2 value greater than 21 ng/mL has a 25% chance of developing IPS in the near future, approximately 3-fold higher than the assumed 8% prevalence of IPS. As expected in view of the low prevalence of the disease, the negative predictive values (NPV) were high (>90%).
Figure 4. Prognostic values by prevalence of IPS.
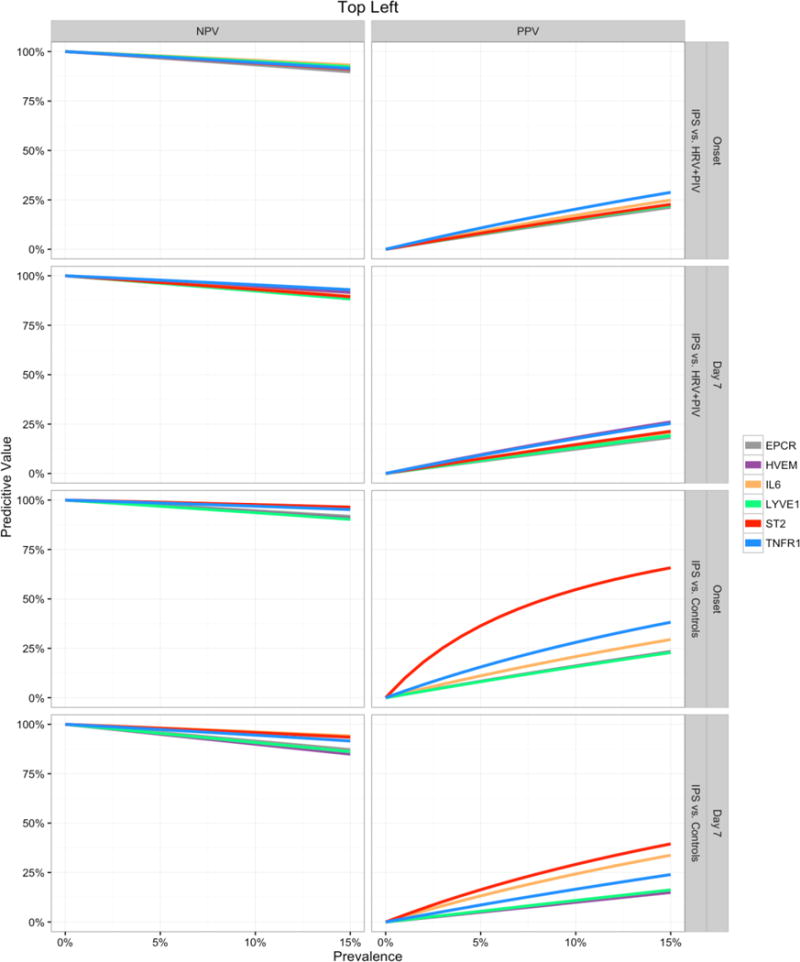
Negative Predictive Value (NPV, left panels) and Positive Predictive Value (PPV, right panels) curves for each biomarker are shown for predicting IPS at the day of onset or day 7 after HCT. Predictive values were calculated using the sensitivity and specificity values from the points closest to the top left corner of the ROC curves and are estimated for a range of hypothetical IPS prevalence values (x-axis).
Abbreviations: IPS, idiopathic pneumonia syndrome; HCT, hematopoietic cell transplantation; ROC, receiver operating characteristic; HRV, human rhinovirus; PIV, parainfluenza virus; EPCR, endothelial protein C receptor; HVEM, herpes virus entry mediator; IL-6, interleukin-6; LYVE1, lymphocyte vessel endothelial receptor; ST2, Stimulation 2; TNFR1, tumor necrosis factor receptor 1.
Survival by biomarker level
We evaluated whether biomarkers that are related to occurrence of IPS can provide reasonable predictions of survival. Since the proportion of IPS cases in our cohort is much higher than we would expect when we combine the two populations, we down-weighted the IPS cases to make their contribution to the analysis more representative (8% prevalence). We then dichotomized the patients into high or low biomarker groups using the top left cutoff values from the ROC curves at day 7 after HCT and display survival curves for groups defined by high vs. low biomarker levels. In this hypothetical population, high IL-6 (p<0.001) or ST2 (p=0.002) level at day 7 after HCT was significantly associated with higher mortality when assuming 8% IPS prevalence (Figure 5A).
Figure 5. Overall survival according to each biomarker.
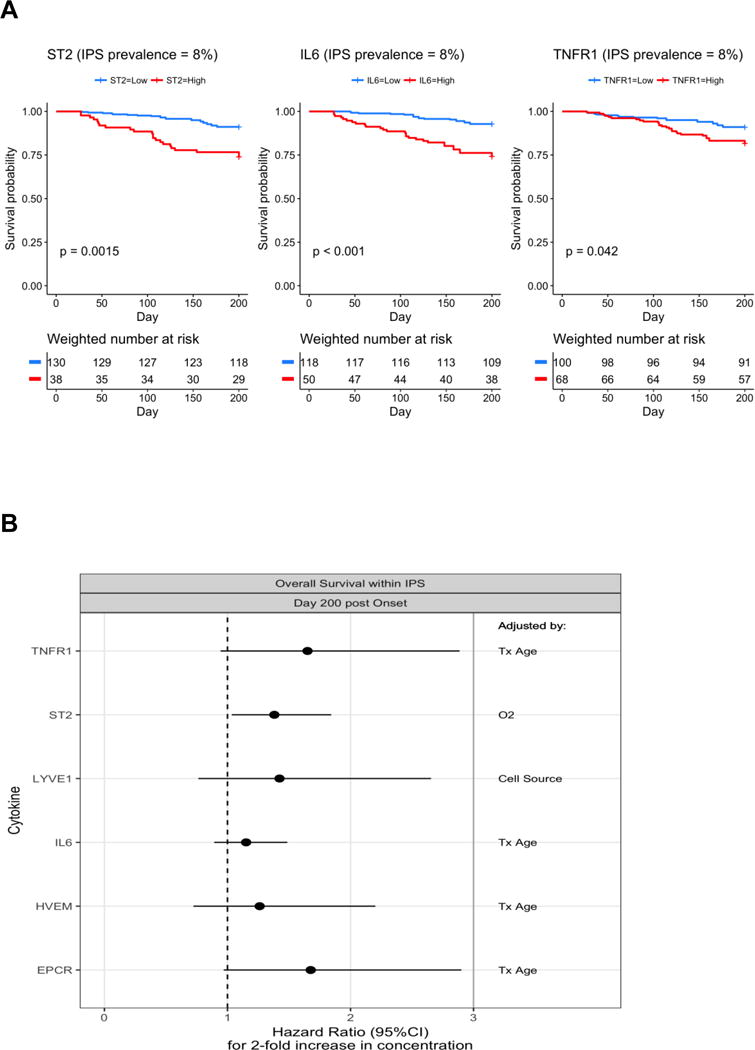
(A) Weighted Kaplan-Meier survival curves were estimated among IPS cases and controls reweighting IPS cases so that prevalence of IPS is represented as 8%. P-values resulted from similarly weighted log-rank tests. The cutoff values for dichotomizing the marker values come from the ROC analysis comparing IPS and controls at day 7 post-HCT, and are 21 ng/mL in ST2, 61 pg/mL in IL-6, and 3421 pg/mL in TNFR1. Numbers at risk are estimated from weights (below x-axis). (B) Forest plots show the associations between each analyte’s onset value and day 200 post-infection survival among the IPS cases. A multivariable model for each analyte was constructed in a step up fashion by adding one clinical variable to the model that modified the association of the analyte with the outcome by more than 10%. The final adjustment factor included in each model is shown in the right column.
Abbreviations: IPS, idiopathic pneumonia syndrome; ROC, receiver operating characteristic; HCT, hematopoietic cell transplantation; ST2, Stimulation 2; IL-6, interleukin-6; TNFR1, tumor necrosis factor receptor 1; LYVE1, lymphocyte vessel endothelial receptor; HVEM, herpes virus entry mediator; EPCR, endothelial protein C receptor; Tx, transplant; O2, oxygen requirement at the time of sampling.
Next we evaluated the prognostic value of the biomarker for mortality after IPS. Among IPS patients, higher levels of ST2 at onset were associated with an increased risk of death up to day 200 post-HCT (Hazard ratio [HR] = 1.38, p=0.028). Moderate associations were also seen for EPCR (HR = 1.68, p=0.065) and TNFR1 (HR = 1.65, p=0.079) (Figure 5B).
DISCUSSION
This study demonstrated that ST2, IL-6, and TNFR1 can help to make a diagnosis of IPS, and TNFR1 may be used to improve discrimination between IPS and respiratory viral pneumonia in addition to PCR assays for the different infectious agents. Importantly, patients with high values of both ST2 and/or IL-6 at day 7 after HCT are at high risk of future IPS occurrence, and ST2 and IL-6 are also associated with higher mortality.
Our proteomics analysis identified three potential biomarkers of IPS; ST2, IL-6, and TNFR1. ST2 and IL-6 could function as both diagnostic and prognostic markers for IPS. ST2 is an IL-1 receptor member and the receptor for its unique ligand: IL-33.30, 31 Recently it has been noted as an important biomarker of GVHD.19–25 ST2 also seems to be a candidate marker for diagnosis of IPS as compared to uncomplicated HCT patients. In our study, a formal comparison with patients developing GVHD has not been performed (see comment in the limitation of the study). ST2 did not discriminate IPS from viral pneumonia. This finding indicates that ST2 may be a marker of lung injury, which is supported by the previous reports that ST2 is elevated with acute lung injury and plays a role in protection of lung injury.14–18 Interestingly, ST2 was elevated in the early phase of HCT, suggesting that it is also a prognostic marker for the future development of IPS with the stronger PPV among the three markers elevated at day7 post-HCT. IL-6 is an inflammatory cytokine and has been previously shown to be elevated in patients with IPS.10, 13 Similar to ST2, IL-6 may function as a diagnostic marker in a comparison to unaffected controls, but not viral pneumonia.13 It was also elevated in the early phase of HCT, although not providing as strong PPV as for ST2. In the multiple analyte models, the combination of ST2 and IL-6 provided the best model fit for predicting IPS in comparison to controls both at diagnosis and day 7 after HCT. However, in terms of discrimination, the AUC in the combined models did not increase compared to that from the models using only ST2, suggesting that it may not be worth the extra cost of testing for the second biomarker, IL-6.
TNFR1 is also a biomarker associated with IPS, and was the single best marker in the comparison with viral pneumonia. For the diagnosis of IPS, exclusion of respiratory viral pneumonia is critical and several obstacles such as bronchoscopic evaluation in a patient in poor condition or availability of comprehensive assays for respiratory viruses prevent accurate diagnosis of IPS. Therefore, TNFR1 as a potential marker to help distinguish IPS from viral pneumonia is important, although it will be necessary to validate this finding in an independent cohort. Etanercept, a TNFR inhibitor, is used to treat IPS and decreased TNFR1 levels have been shown in patients who respond to etanercept.10–12
The results regarding predictive values are potentially clinically relevant. The incidence of IPS is low; between 5 and 10%. Based on our data, high values of ST2 or IL-6 at day 7 after HCT identify a subgroup with a markedly increased likelihood of IPS occurrence which would allow close monitoring early post-transplantation and biomarker-based preemptive interventions enabling personalized medicine in this more targeted population. Our calculation of PPV at the onset of the pulmonary symptoms showing that high ST2 has a PPV of approximately 50% provides an informative change in knowledge from the a priori likelihood of IPS based on the assumed 8% prevalence, especially when the patient cannot undergo bronchoscopic examination due to poor condition.
Since the incidence rate of IPS is low, approximately 8%, we carried out weighted Kaplan-Meier estimation among controls and IPS cases to generate representative mortality estimates and we showed that high ST2 or IL-6 values is associated with increased mortality in a population with typical IPS prevalence rates. Since prevention of lung injury in the early phase of disease may be important to avoid mortality following IPS, early monitoring of ST2 and IL-6 after HCT would be informative to conduct preemptive therapy. A prospective trial would be needed to test this hypothesis.
This study has strengths and limitations. The cohort in our study constitutes one of the largest available cohorts of IPS cases. Both IPS and viral pneumonia cases were extremely well-characterized in terms of the diagnostic panel that was applied.8, 26 For the first time in a biomarker study for IPS after HCT, predictive values for a range of IPS prevalence scenarios were estimated. This provides valuable and practical information regarding the degree to which knowledge about an individual’s biomarker values increases understanding of the likelihood of IPS for that individual, especially when patients cannot undergo bronchoscopic examination for diagnosis of IPS. One limitation of our study was the limited numbers of IPS subjects due to the low incidence of IPS and availability of samples. Therefore, samples were collected over a long time period, which may affect the results despite multivariable analyses including key clinical variables. Moreover, the number of subjects was insufficient to evaluate results within stratum defined by presence or absence of acute GVHD. Instead, we included acute GVHD as one of clinical variables in the multivariable analysis. Second, we evaluated PIV and HRV cases as a representative of viral pneumonia since the two respiratory viruses are very common in HCT recipients and the incidence rates of pneumonia are relatively high.32, 33 Despite of the high incidence and collection from our 25-year database, the total number of the pneumonia cases with PIV or HRV was only 37 after several restrictions (i.e. time point after HCT, co-pathogen, and serum availability) and we could not evaluate the cytokine profiles separately. Viral pneumonia resulting from different pathogens might have a different cytokine profile. Therefore, TNFR1 may not be a biomarker to distinguish IPS from other viral pneumonia such as influenza or CMV. The third limitation is the lack of a validation cohort. Establishing such a cohort is difficult because the incidence rate of IPS is low, and most centers do not identify IPS reliably and do not have biobanked samples on these patients. Thus, an independent validation cohort, optimally a prospectively enrolled cohort, is warranted to validate our findings.
In conclusion, we identified ST2, IL-6 and TNFR1 as potential biomarkers that could help to screen for IPS, and TNFR1 could be a useful marker to distinguish IPS from respiratory viral pneumonia. ST2 and IL-6 may also function as prognostic markers of future occurrence of IPS. Further studies are required to validate our findings and determine the usefulness of these IPS candidate markers.
Supplementary Material
Highlights.
High levels of ST2 and IL-6 in plasma distinguish IPS from uninfected controls.
TNFR1 at onset was the best plasma marker to distinguish IPS from viral pneumonia.
ST2 at day 7 post HCT has the highest positive predictive value for IPS occurrence.
Higher level of ST2 was associated with low survival.
Acknowledgments
This work was partially supported by grants from the National Institutes of Health (R01CA168814, R01HD074587, HL093294, and HD090215). S.P. is a recipient of Leukemia & Lymphoma Society Scholar Award (1293-15) and Lilly Physician Scientist Initiative Award. S.S. is a recipient of a Joel Meyers Endowment Scholarship Award. The authors would like to thank Zachary Stednick for assistance retrieving clinical data, and Jessica Yi, Laurel Joncas Schronce, Heather Andrew, and Jo Tono for assistance retrieving and aliquoting samples. Specimens were provided by the Vaccine and Infectious Disease Division Biospecimen Repository at Fred Hutch.
Footnotes
Publisher's Disclaimer: This is a PDF file of an unedited manuscript that has been accepted for publication. As a service to our customers we are providing this early version of the manuscript. The manuscript will undergo copyediting, typesetting, and review of the resulting proof before it is published in its final citable form. Please note that during the production process errors may be discovered which could affect the content, and all legal disclaimers that apply to the journal pertain.
Financial disclosure
S.P. has a patent on “Methods of detection of graft-versus-host disease” licensed to Viracor-IBT Laboratories. All other authors declare no competing financial interests.
Conflict of interest statement: No author has a conflict of interest with regard to the contents of this manuscript.
Authorship statement: S.S. codesigned the study, collected the clinical data, assisted in data interpretation, and wrote the manuscript. J.U. performed ELISA assays. I.J. and W.L. did the statistical analyses and edited the manuscript. T.S. performed sample management and edited the manuscript. J.K. and M.H. performed the PCR assay and edited the manuscript. K.J. managed the PCR assay and edited the manuscript. M.B. codesigned the study, assisted in data interpretation, and wrote the manuscript. S.P. codesigned the study, assisted in data interpretation, and wrote the manuscript.
References
- 1.Clark JG, Hansen JA, Hertz MI, Parkman R, Jensen L, Peavy HH. NHLBI workshop summary. Idiopathic pneumonia syndrome after bone marrow transplantation. The American review of respiratory disease. 1993;147:1601–1606. doi: 10.1164/ajrccm/147.6_Pt_1.1601. [DOI] [PubMed] [Google Scholar]
- 2.Panoskaltsis-Mortari A, Griese M, Madtes DK, et al. An official American Thoracic Society research statement: noninfectious lung injury after hematopoietic stem cell transplantation: idiopathic pneumonia syndrome. American journal of respiratory and critical care medicine. 2011;183:1262–1279. doi: 10.1164/rccm.2007-413ST. [DOI] [PMC free article] [PubMed] [Google Scholar]
- 3.Fukuda T, Hackman RC, Guthrie KA, et al. Risks and outcomes of idiopathic pneumonia syndrome after nonmyeloablative and conventional conditioning regimens for allogeneic hematopoietic stem cell transplantation. Blood. 2003;102:2777–2785. doi: 10.1182/blood-2003-05-1597. [DOI] [PubMed] [Google Scholar]
- 4.Keates-Baleeiro J, Moore P, Koyama T, Manes B, Calder C, Frangoul H. Incidence and outcome of idiopathic pneumonia syndrome in pediatric stem cell transplant recipients. Bone marrow transplantation. 2006;38:285–289. doi: 10.1038/sj.bmt.1705436. [DOI] [PubMed] [Google Scholar]
- 5.Zhu KE, Hu JY, Zhang T, Chen J, Zhong J, Lu YH. Incidence, risks, and outcome of idiopathic pneumonia syndrome early after allogeneic hematopoietic stem cell transplantation. European journal of haematology. 2008;81:461–466. doi: 10.1111/j.1600-0609.2008.01149.x. [DOI] [PubMed] [Google Scholar]
- 6.Solh M, Arat M, Cao Q, Majhail NS, Weisdorf D. Late-onset noninfectious pulmonary complications in adult allogeneic hematopoietic cell transplant recipients. Transplantation. 2011;91:798–803. doi: 10.1097/TP.0b013e31820c85fa. [DOI] [PubMed] [Google Scholar]
- 7.Sakaguchi H, Takahashi Y, Watanabe N, et al. Incidence, clinical features, and risk factors of idiopathic pneumonia syndrome following hematopoietic stem cell transplantation in children. Pediatric blood & cancer. 2012;58:780–784. doi: 10.1002/pbc.23298. [DOI] [PubMed] [Google Scholar]
- 8.Seo S, Renaud C, Kuypers JM, et al. Idiopathic pneumonia syndrome after hematopoietic cell transplantation: evidence of occult infectious etiologies. Blood. 2015;125:3789–3797. doi: 10.1182/blood-2014-12-617035. [DOI] [PMC free article] [PubMed] [Google Scholar]
- 9.Paczesny S, Hakim FT, Pidala J, et al. National Institutes of Health Consensus Development Project on Criteria for Clinical Trials in Chronic Graft-versus-Host Disease: III. The 2014 Biomarker Working Group Report. Biology of blood and marrow transplantation: journal of the American Society for Blood and Marrow Transplantation. 2015;21:780–792. doi: 10.1016/j.bbmt.2015.01.003. [DOI] [PMC free article] [PubMed] [Google Scholar]
- 10.Yanik GA, Ho VT, Levine JE, et al. The impact of soluble tumor necrosis factor receptor etanercept on the treatment of idiopathic pneumonia syndrome after allogeneic hematopoietic stem cell transplantation. Blood. 2008;112:3073–3081. doi: 10.1182/blood-2008-03-143412. [DOI] [PMC free article] [PubMed] [Google Scholar]
- 11.Yanik GA, Horowitz MM, Weisdorf DJ, et al. Randomized, Double-Blind, Placebo-Controlled Trial of Soluble Tumor Necrosis Factor Receptor: Enbrel (Etanercept) for the Treatment of Idiopathic Pneumonia Syndrome after Allogeneic Stem Cell Transplantation: Blood and Marrow Transplant Clinical Trials Network Protocol. Biology of blood and marrow transplantation: journal of the American Society for Blood and Marrow Transplantation. 2014 doi: 10.1016/j.bbmt.2014.02.026. [DOI] [PMC free article] [PubMed] [Google Scholar]
- 12.Yanik GA, Grupp SA, Pulsipher MA, et al. TNF-receptor inhibitor therapy for the treatment of children with idiopathic pneumonia syndrome. A joint Pediatric Blood and Marrow Transplant Consortium and Children’s Oncology Group Study (ASCT0521) Biology of blood and marrow transplantation: journal of the American Society for Blood and Marrow Transplantation. 2015;21:67–73. doi: 10.1016/j.bbmt.2014.09.019. [DOI] [PMC free article] [PubMed] [Google Scholar]
- 13.Varelias A, Gartlan KH, Kreijveld E, et al. Lung parenchyma-derived IL-6 promotes IL-17A-dependent acute lung injury after allogeneic stem cell transplantation. Blood. 2015;125:2435–2444. doi: 10.1182/blood-2014-07-590232. [DOI] [PMC free article] [PubMed] [Google Scholar]
- 14.Bajwa EK, Mebazaa A, Januzzi JL. ST2 in Pulmonary Disease. The American journal of cardiology. 2015;115:44B–47B. doi: 10.1016/j.amjcard.2015.01.040. [DOI] [PubMed] [Google Scholar]
- 15.Bajwa EK, Volk JA, Christiani DC, et al. Prognostic and diagnostic value of plasma soluble suppression of tumorigenicity-2 concentrations in acute respiratory distress syndrome. Critical care medicine. 2013;41:2521–2531. doi: 10.1097/CCM.0b013e3182978f91. [DOI] [PMC free article] [PubMed] [Google Scholar]
- 16.Cohen ES, Scott IC, Majithiya JB, et al. Oxidation of the alarmin IL-33 regulates ST2-dependent inflammation. Nature communications. 2015;6:8327. doi: 10.1038/ncomms9327. [DOI] [PMC free article] [PubMed] [Google Scholar]
- 17.Oshikawa K, Yanagisawa K, Tominaga S, Sugiyama Y. ST2 protein induced by inflammatory stimuli can modulate acute lung inflammation. Biochemical and biophysical research communications. 2002;299:18–24. doi: 10.1016/s0006-291x(02)02578-0. [DOI] [PubMed] [Google Scholar]
- 18.Zeng S, Wu J, Liu J, Qi F, Liu B. IL-33 Receptor (ST2) Signalling is Important for Regulation of Th2-Mediated Airway Inflammation in a Murine Model of Acute Respiratory Syncytial Virus Infection. Scandinavian journal of immunology. 2015;81:494–501. doi: 10.1111/sji.12284. [DOI] [PubMed] [Google Scholar]
- 19.Vander Lugt MT, Braun TM, Hanash S, et al. ST2 as a marker for risk of therapy-resistant graft-versus-host disease and death. The New England journal of medicine. 2013;369:529–539. doi: 10.1056/NEJMoa1213299. [DOI] [PMC free article] [PubMed] [Google Scholar]
- 20.Yu J, Storer BE, Kushekhar K, et al. Biomarker Panel for Chronic Graft-Versus-Host Disease. Journal of clinical oncology: official journal of the American Society of Clinical Oncology. 2016;34:2583–2590. doi: 10.1200/JCO.2015.65.9615. [DOI] [PMC free article] [PubMed] [Google Scholar]
- 21.Ponce DM, Hilden P, Mumaw C, et al. High day 28 ST2 levels predict for acute graft-versus-host disease and transplant-related mortality after cord blood transplantation. Blood. 2015;125:199–205. doi: 10.1182/blood-2014-06-584789. [DOI] [PMC free article] [PubMed] [Google Scholar]
- 22.Levine JE, Braun TM, Harris AC, et al. A prognostic score for acute graft-versus-host disease based on biomarkers: a multicentre study. The Lancet Haematology. 2015;2:e21–29. doi: 10.1016/S2352-3026(14)00035-0. [DOI] [PMC free article] [PubMed] [Google Scholar]
- 23.Hartwell MJ, Ozbek U, Holler E, et al. An early-biomarker algorithm predicts lethal graft-versus-host disease and survival. JCI insight. 2017;2:e89798. doi: 10.1172/jci.insight.89798. [DOI] [PMC free article] [PubMed] [Google Scholar]
- 24.McDonald GB, Tabellini L, Storer BE, Lawler RL, Martin PJ, Hansen JA. Plasma biomarkers of acute GVHD and nonrelapse mortality: predictive value of measurements before GVHD onset and treatment. Blood. 2015;126:113–120. doi: 10.1182/blood-2015-03-636753. [DOI] [PMC free article] [PubMed] [Google Scholar]
- 25.Abu Zaid M, Wu J, Wu C, et al. Plasma biomarkers of risk for death in a multicenter phase 3 trial with uniform transplant characteristics post-allogeneic HCT. Blood. 2016 doi: 10.1182/blood-2016-08-735324. [DOI] [PMC free article] [PubMed] [Google Scholar]
- 26.Seo S, Xie H, Campbell AP, et al. Parainfluenza virus lower respiratory tract disease after hematopoietic cell transplant: viral detection in the lung predicts outcome. Clinical infectious diseases: an official publication of the Infectious Diseases Society of America. 2014;58:1357–1368. doi: 10.1093/cid/ciu134. [DOI] [PMC free article] [PubMed] [Google Scholar]
- 27.Seo S, Waghmare A, Scott EM, et al. Human rhinovirus detection in the lower respiratory tract of hematopoietic cell transplant recipients: association with mortality. Haematologica. 2017;102:1120–1130. doi: 10.3324/haematol.2016.153767. [DOI] [PMC free article] [PubMed] [Google Scholar]
- 28.Fiema B, Harris AC, Gomez A, et al. High throughput sequential ELISA for validation of biomarkers of acute graft-versus-host disease. Journal of visualized experiments: JoVE. 2012 doi: 10.3791/4247. [DOI] [PMC free article] [PubMed] [Google Scholar]
- 29.the 98th Meeting of Blood Products Advisory Committee2010
- 30.Bergers G, Reikerstorfer A, Braselmann S, Graninger P, Busslinger M. Alternative promoter usage of the Fos-responsive gene Fit-1 generates mRNA isoforms coding for either secreted or membrane-bound proteins related to the IL-1 receptor. The EMBO journal. 1994;13:1176–1188. doi: 10.1002/j.1460-2075.1994.tb06367.x. [DOI] [PMC free article] [PubMed] [Google Scholar]
- 31.Schmitz J, Owyang A, Oldham E, et al. IL-33, an interleukin-1-like cytokine that signals via the IL-1 receptor-related protein ST2 and induces T helper type 2-associated cytokines. Immunity. 2005;23:479–490. doi: 10.1016/j.immuni.2005.09.015. [DOI] [PubMed] [Google Scholar]
- 32.Schiffer JT, Kirby K, Sandmaier B, Storb R, Corey L, Boeckh M. Timing and severity of community acquired respiratory virus infections after myeloablative versus non-myeloablative hematopoietic stem cell transplantation. Haematologica. 2009;94:1101–1108. doi: 10.3324/haematol.2008.003186. [DOI] [PMC free article] [PubMed] [Google Scholar]
- 33.Milano F, Campbell AP, Guthrie KA, et al. Human rhinovirus and coronavirus detection among allogeneic hematopoietic stem cell transplantation recipients. Blood. 2010;115:2088–2094. doi: 10.1182/blood-2009-09-244152. [DOI] [PMC free article] [PubMed] [Google Scholar]
Associated Data
This section collects any data citations, data availability statements, or supplementary materials included in this article.