

Abstract
The identification of novel genetic modifiers of age-at-onset of Alzheimer’s disease could advance our understanding of AD and provide novel therapeutic targets. A previous genome scan for modifiers of age-at-onset among families affected by early-onset Alzheimer’s disease caused by the PSEN2 N141I variant identified two loci with significant evidence for linkage: 1q23.3 and 17p13.2. Here, we describe the fine-mapping of these two linkage regions, and test for replication in six independent data sets. By fine-mapping these linkage signals in a single large family, we reduced the linkage regions to 11% their original size and nominated 54 candidate variants. Among the 11 variants associated with age-at-onset of Alzheimer’s disease in a larger sample of Germans from Russia, the strongest evidence implicated promoter variants influencing NCSTN on 1q23.3 and ZBTB4 on 17p13.2. The association between ZBTB4 and age-at-onset of Alzheimer’s disease was replicated by multiple variants in independent, trans-ethnic data sets. Our results demonstrate association between age-at-onset of Alzheimer’s disease and both ZBTB4 and NCSTN. ZBTB4 is a transcriptional repressor that regulates the cell cycle, including the apoptotic response to amyloid beta, while NCSTN is part of the gamma secretase complex, known to influence amyloid beta production. These genes therefore suggest important roles for amyloid beta and cell cycle pathways in age-at-onset of Alzheimer’s disease.
Keywords: genetic modifiers, dementia, linkage analysis, association, survival analysis, non-coding variants, age-at-onset, fine-mapping, complex traits, apoptotic response, amyloid beta
Introduction
Alzheimer’s disease (AD) explains the diagnosis of dementia in >70% of persons aged ≥80 years (Brookmeyer et al., 2011). AD is characterized by the deposition of amyloid (Aβ) plaques and neurofibrillary tangles in the brain, resulting in progressive dementia (Sala Frigerio & De Strooper, 2016). Rare variants in APP, PSEN1, and PSEN2 cause a highly-penetrant autosomal dominant form of early-onset AD (EOAD). The APOE ε4 allele is strongly associated with increased risk of late-onset AD (LOAD), and several other loci are associated with small but significant effects (Karch & Goate, 2015) in genome-wide associations studies (GWAS).
The identification of genetic modifiers of age-at-onset (AAO) of AD offers promise for both a better understanding of AD biology and new potential interventions. Variants that affect AAO of AD can be considered AD risk or protective variants, as reduced (or increased) AAO means greater (or lower) chance of becoming affected before death from other causes. AAO modifiers identified in EOAD families are likely to be relevant to LOAD due to their shared biology. Although the boundary between EOAD and LOAD is typically defined near age 65 years, familial AD is not discretely divided into these two categories. Families segregating dominant EOAD variants may include relatives affected by LOAD (Lee et al., 2015, Marchani et al., 2010), while multiplex families affected by LOAD may include relatives affected prior to the age of 65 years (Choi et al., 2011, Wu et al., 2012, Zhao et al., 2013). The shared genetic basis of EOAD and LOAD has been revealed by targeted sequencing analyses, where AD risk variants in probands ascertained from LOAD families have been identified (Cruchaga et al., 2012). Furthermore, APOE, the most well-established genetic modifier of AAO of AD, influences AAO of AD in families affected by EOAD (Marchani et al., 2010, Pastor et al., 2003, Velez et al., 2016b) and persons affected by LOAD (Naj et al., 2014).
AAO of AD is heritable, and much of that heritability remains to be explained. Heritability estimates for AAO of AD from twin studies range from 57-78%, suggesting the presence of genetic modifiers (Meyer & Breitner, 1998, Pedersen et al., 2001). Variation in APOE is estimated to only explain between 4–15% of the genetic variance in AAO of AD (Bennett et al., 1995, Daw et al., 2000, Slooter et al., 1998, Tunstall et al., 2000). Association testing within candidate genes (Leduc et al., 2015), GWAS (Lalli et al., 2015), and linkage studies (Lee et al., 2015, Marchani et al., 2010, Zhao et al., 2013) have found evidence for additional modifiers of AAO of AD in samples with and without causal EOAD variants. Several of these loci are significant or suggestive across independent genome-scans for AAO modifiers, including 5q15 (Lee et al., 2008, Szigeti et al., 2014), 7q31.33 (Choi et al., 2011, Marchani et al., 2010, Wang et al., 2015), 8p22 (Naj et al., 2014, Szigeti et al., 2013), 9q33.1 (Choi et al., 2011, Wang et al., 2015), 13q33.3(Lee et al., 2008, Naj et al., 2014), and 20p12.3 (Velez et al., 2016a, Wang et al., 2015). One of these loci, 7q31.33, is supported by analyses of Volga German PSEN2 families affected by EOAD (Marchani et al., 2010) and independent LOAD data sets with European ancestry (Choi et al., 2011, Wang et al., 2015). Additional research, including fine-mapping and functional studies, is needed to identify the AAO modifiers within these loci.
We have previously provided strong evidence for the existence of genetic modifiers of AAO on chromosomes 1q23.3 and 17p13.2 in Volga German EOAD families sharing a founder causal variant in PSEN2 (Marchani et al., 2010). Each of these linkage signals were driven by a single large pedigree, the R family, with a range of AAO of AD spanning 40 years. Here, we fine-map these two linkage regions within the R family, identify the sequence variants driving these signals, and provide independent evidence of association between AAO of AD and variants within NCSTN and ZBTB4.
Materials and Methods
Discovery Data Set
The R family possessed significant evidence for linkage between AAO of AD and both 1q23.3 and 17p13.2 after adjustment for the Volga German PSEN2 variant and APOE genotype (Marchani et al., 2010). AAO of AD spanned four decades within this 65-member family (Table 1), including at least two cases without the PSEN2 N141 allele. Dense SNP genotypes were generated for the 32 most informative relatives using the Illumina HumanOmni1 SNP array by the Northwest Genomics Center (NWGC) at the University of Washington. Six informative relatives were selected for whole-exome sequencing (WES), and whole-genome sequencing (WGS) was performed on four of these by the NWGC using the same bioinformatics pipeline (Supplemental Methods). Candidate variants were genotyped in all available relatives using a TaqMan SNP Genotyping Assay from ThermoFisher (Waltham, Massachusetts, USA) where possible, or else Sanger sequencing (Table S1).
Table 1.
Sample Description.
| AAO | ||||||||||
|---|---|---|---|---|---|---|---|---|---|---|
| Data set | Ancestry | Nsubjects | Nfamilies | Ncases | mean | range | % female | NMZ | Ncryptic | Data |
| R family | Volga German | 39 | 1 | 17 | 55 | [45-85] | 47% | 0 | 0 | SNP,WES, WGS |
| Germans from Russia | Germans from Russia | 316 | 67 | 165 | 67 | [44-95] | 56% | NA | NA | MIPs |
| ADSP Europeans | European | 215 | 43 | 172 | 74 | [45-95] | 68% | 0 | 0 | WGS |
| ADSP Hispanics | Caribbean Hispanic | 350 | 67 | 236 | 74 | [48-101] | 57% | 0 | 0 | WGS |
| ADSP WES | European | 10,528 | NA | 5,567 | 76 | [40-111] | 58% | 0 | 5 | WES |
| CU Hispanics | Caribbean Hispanic | 3,655 | 2,518 | 1,571 | 75 | [30-100] | 66% | 0 | 2 | SNP |
| NIALOAD Europeans | European | 3,988 | 1,714 | 1,664 | 73 | [48-98] | 63% | 14 | 2 | SNP |
| NIALOAD Hispanics | Hispanic | 1,169 | 156 | 393 | 74 | [42-98] | 64% | 1 | 7 | SNP |
N: number of subjects with both genotype and phenotype data available, AAO: age-at-onset of Alzheimer’s disease in years, MZ: pairs of subjects who appear to be monozygotic twins, cryptic: pairs of subjects with high (>0.1) empirical kinship estimates from different families, WGS: whole genome sequencing, WES: whole exome sequencing, SNP array: genome-wide single nucleotide polymorphism array, MIPs: targeted sequencing with molecular inversion probes.
The Germans from Russia (GFR, Table 1) represent multiplex AD families whose ancestors migrated from Germany to the Black Sea and Volga River (Volga Germans) regions of Russia, and from there to the Americas (Bird et al., 1988). All families were ascertained by Dr. Bird for multiplex AD and screened for the PSEN2 N141I variant. Individuals diagnosed with definite or probable AD were considered affected by AD. Genotype data for 331 GFR individuals were generated by targeted high-throughput sequencing using single-molecule molecular inversion probes (smMIPs (Hiatt et al., 2013), Table S2), restriction fragment length polymorphisms (RFLPs), TaqMan assays, and Sanger sequencing (Tables S3; Supplemental Methods). We excluded variants missing ≥20% of genotypes, which efficiently separated the concordant vs. discordant variants when smMIPs and traditional genotypes were compared (Table S4, Figure S1). The study protocol was approved by the University of Washington Institutional Review Board, and informed consent was obtained for all participants.
Replication Data Sets
Six independent AD data sets were used for the replication phase (Table 1), each focusing on late-onset AD. We extracted the shared polymorphic SNPs within +/− 25 kilobases of candidate variants from the Discovery Data Set in the five data sets with genome-wide data. These shared SNPs were tested for association and meta-analyzed by ancestry group using Fisher’s method (Fisher, 1925). Analyses of WES data were restricted to variants within the canonical transcript of candidate genes. GWAS testing of a subset of polymorphic single nucleotide variants (SNVs) estimated the genomic inflation factor (λ (Devlin & Roeder, 1999)), a measure of how well the observed p-values match those expected under the null. All sequence positions refer to build GRCh37/hg19 of the human reference genome.
The Alzheimer’s Disease Sequencing Project (ADSP) data were downloaded through the Database of Genotypes and Phenotypes (dbGaP; phs000572.v7.p4). Ascertainment focused on late-onset Alzheimer’s disease, excluding families known to carry causal variants in APP, PSEN1, PSEN2, MAPT, and/or GRN (Beecham et al., in press, Blue et al., 2015). Analyses were performed on the VCFs with consensus-called genotypes, as well as phenotype and covariate files including APOE genotype, affectation status, and AAO of AD. WGS data was collected for 578 persons drawn from 111 families ascertained for familial AD. Individuals with definite or probable AD were considered cases, the remaining persons were considered to be at-risk of AD. Families with Caribbean Hispanic or European ancestry were analyzed separately. 785,814 SNVs for the ADSP Europeans and 890,336 SNVs for the ADSP Hispanics were used to estimate λ. Within the ADSP WES data set, analysis was restricted to persons documented as having non-Hispanic European ancestry. Individuals marked as a prevalent or incident case of AD within the year 0 phenotype file were considered affected with AD; otherwise, they were considered as at-risk of developing AD. The λ for the ADSP WES sample was estimated from 22,659 SNVs.
The Columbia University Study of Caribbean Hispanics with Familial and Sporadic Late Onset Alzheimer’s disease (CU Hispanics) data were downloaded through dbGaP (phs000496.v1.p1), including SNP genotypes, APOE genotypes, and phenotype data for 3,655 CU Hispanics. No information regarding known causal AD variants was available. Individuals were ascertained for both sporadic and familial AD. We used the documented AAO of AD and affectation status. 904,994 SNVs from the Illumina HumanOmni1-Quad v1.0B SNP array were used to estimate λ.
The National Institute on Aging’s Late-Onset Alzheimer’s Disease Study and the National Cell Repository for Alzheimer’s Disease (NIALOAD) data were originally ascertained from multiplex LOAD families or neurologically-confirmed controls. Genotypes for 620,901 loci collected using the Illumina 610Quad SNP array, as well as APOE genotypes were available. No data were available regarding causal variants in known AD genes. Individuals with northwestern European (Wijsman et al., 2011) or Hispanic ancestry were analyzed separately. AAO of dementia was used as the AAO variable, with affectation status as previously described (Wijsman et al., 2011). Persons with differences between age-at-diagnosis of AD and AAO of dementia >10 years were excluded from analysis (Figure S2). A subset of 543,347 SNVs in the NIALOAD Europeans, and 454,993 SNVs in the NIALOAD Hispanics were used to estimate λ.
Statistical analysis
Linkage analyses in the R family identified tagging variants and narrowed linked haplotype(s). Microsatellites (STRs) from the original linkage scan (Marchani et al., 2010) were combined with SNPs with high heterozygosity and low missingness to provide a dense marker map (~1 marker/0.6 sex-averaged centiMorgan under the Haldane map function, cM (Matise et al., 2007)). Linkage regions were defined by STRs with single-marker evidence for linkage, plus two flanking STRs on either side: chr1: 93,335,507-167,604,465bp, and chr17: 432,537-31,290,190bp.
Linkage analyses were performed by joint oligogenic segregation and linkage analyses using Loki v2.4.7 (Daw et al., 1999, Heath, 1997) and the published parameters (Marchani et al., 2010). For each linkage region, we performed 1,000 joint oligogenic segregation and linkage analyses to estimate the null distribution of the linkage signal, measured by the Bayes’ Factor (BF (Kass & Raftery, 1995)). The Measured Genotype (MG) approach (Almasy & Blangero, 2004, Boerwinkle et al., 1986) identified variants tagging the haplotype driving each linkage signal: variants associated with the linkage signal should have low BF and large values for size, the square root of genetic variance explained by the variant, when included as both a marker and a covariate in the linkage analysis. Here, we define these “topSNPs” as those with BF below the 1st percentile derived from the null distribution and size estimates above the 99th percentile of the variants tested. Using the array data in the R family, MG analyses evaluated 11,574 SNPs on chromosome (chr) 1 and 6,512 SNPs on chr17 which fell within the linkage regions, had HapMap reference European frequencies, an observed minor allele frequency (MAF) ≥5%, missingness ≤ 5%, and no Mendelian inconsistencies. MG approach analyses of candidate sequence variants and founder haplotypes followed a similar protocol: markers include all STRs and the variant being tested, 1000 burn-in iterations, saving every 20th of 1 million realizations.
Inheritance vectors were estimated using the MORGAN v3.0.1 program gl_auto (Thompson, 2011), which uses a Markov chain Monte Carlo approach to sample realizations of inheritance vectors consistent with the pedigree structure and genotype data (Supplemental Methods). The program IBDgraph (Koepke & Thompson, 2013, Thompson, 2011) identified equivalence classes among the thousands of sampled inheritance vectors, where all realizations within the class share the same pattern of identity-by-descent (IBD). We estimated equivalence classes at the position of the linkage scan marker with the strongest evidence for linkage to AAO of AD to identify the most common haplotype. A dummy variable indicating carrier status for this haplotype was tested by the MG approach to determine whether the haplotype tagged the linkage signal. The marker boundaries of the linked haplotype were then used to define the sequence positions of the linked haplotype. Biallelic SNVs and small insertions/deletions within the linked haplotypes underwent quality control (Supplemental Methods), and those with maximum alternate allele frequency (AAF) ≤0.15 in reference subpopulations were prioritized. These candidate variants were binned into identity-by-state (IBS) classes given the observed genotypes. Representatives of each IBS class, including all coding changes, were genotyped in all available members of the R family, and then MG analyses identified those most effectively tagging the haplotype driving each linkage signal (Supplemental Methods).
Association testing in the GFR data set was performed on Martingale residuals for AAO of AD using the WQLS test statistic (Bourgain et al., 2003) implemented in QM_QXM (Thornton & Mcpeek, 2007, Thornton et al., 2012) using the Hardy-Weinberg variance estimator. AAO of AD was adjusted for the count of APOE ε2, APOE ε4, and PSEN2 N141I alleles using a Cox proportional hazards model. Sex was not included as a covariate as the evidence for its effects on AD risk have been inconsistent (ex., (Lindsay et al., 2002, Ryman et al., 2014)). The WQLS test uses pedigree-based kinship estimates and is robust to non-normal quantitative traits like Martingale residuals.
The replication data sets were drawn from admixed populations or populations with geographic structure, and required association methods incorporated estimates of kinship and population structure (Table 1). Within each replication data set, kinship was estimated empirically using KING (Manichaikul et al., 2010). Samples with pedigree errors were removed, and evidence of cryptic relatedness (kinship > 0.1) was noted. AAO of AD was adjusted for the count of APOE ε2 and APOE ε4 alleles using a Cox proportional hazards model. Principal components (PCs) were estimated by PC-Air (Conomos et al., 2015), and a genetic relatedness matrix (GRM) was built by PC-Relate (Conomos et al., 2016) which adjusted the GRM for PCs 1 and 2. Association testing was performed using a linear mixed model adjusting for this GRM and PCs 1 and 2 within the GENESIS software package (Conomos & Thornton, 2016). The skewed distribution of Martingale residuals is inappropriate for this linear mixed model, and so the deviance residuals were analyzed as a quantitative trait with a normal distribution. The number of independent tests within each data set were estimated using GEC v0.2 (Li et al., 2012).
Cox proportional hazards analyses evaluated the direction of effect of candidate variants, adjusting for the same covariates as the AAO of AD phenotype. Alternative models for modeling APOE as a covariate had minimal effects on the mean squared error (Table S5).
Results
The Discovery Data Set
The MG approach combined with estimates of IBD to dramatically narrow both linkage regions observed in the R family. We identified 11 topSNPs on chr1 and 28 topSNPs on chr17 which best explained the evidence for linkage on each chromosome (<1st percentile for BF, >99th percentile for size, Figure 1, Tables S6, S7). The risk alleles at topSNPs (Table S7) tagged the haplotype driving each linkage signal, narrowing the linkage regions by 30%: chr1:108,528,710-164,628,310bp and chr17: 3,781,764-21,771,953bp. Patterns of IBD among carriers of the topSNP risk alleles were estimated at the position of the STR with the strongest evidence for linkage to AAO of AD on chr1 (D1S484) and chr17 (D17S938) using a Markov chain Monte Carlo approach. A single equivalence class explained all of the sampled inheritance vector realizations at D1S484, while another class explained 98.7% of the inheritance vector realizations at D17S938. The patterns of IBD sharing summarized by these inheritance vectors are illustrated in Figure S3. Linkage analyses including covariates indicating carrier status for the most-common haplotype within the largest equivalence class at D1S484 or D17S938 explained their respective linkage signals (Figure S4). This approach further narrowed the regions of interest by 84%: chr1:157,842,192-165,403,666 and chr17:5,918,562-10,269,514bp.
Figure 1. Size of quantitative trait loci at SNPs included as a covariate in measured genotype analyses within the R family.
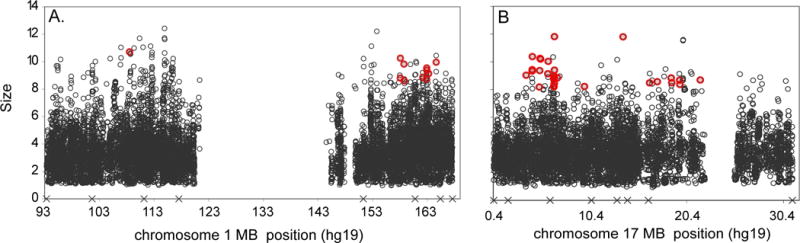
Panel A: chromosome 1, Panel B: chromosome 17. The empty space in the middle of panel A corresponds to the centromere. The topSNPs are highlighted in red. X marks the position of the microsatellite markers included in the linkage analysis. For context, APOE has an average effect size of 5.51 in the chr1 analyses and 5.26 in the chr17 analyses.
Within the IBD haplotype, 1,251 WGS variants on chr1 and 1,273 WGS variants on chr17 passed QC filters, had reference AAF ≤ 0.15, and were predicted to alter either protein structure or gene regulation. MG analyses of representatives from each IBS class of variants found that rs911229 and rs17846715 best explained the linkage signal on chr1 (Figure S5), while rs33989543 and rs190521854 best explained the linkage signal on chr17 (Figure S6). These IBS classes defined our targeted regions of interest: chr1:159,752,066-162,345,199bp and chr17: 6,930,118-7,721,931bp. Within these boundaries, we identified 36 variants of interest on chr1 and 17 variants of interest on chr17 (Table S2). Most of these variants were not captured in the WES data and are non-coding.
Eleven variants were nominally associated with AAO in both the R family and the entire GFR sample (p<0.05, Table 2, Table S8), out of an estimated 17.29 independent tests on chr1 and 10.18 independent tests on chr17. The strongest signals on chr1 implicated NCSTN, while the strongest signals on chr17 implicated ZBTB4. The ZBTB4 variant rs71370498 occurs within a promoter (ENSR00000122480 (Mclaren et al., 2016)), with corresponding histone modifications and DNAse I hypersensitivity sites (DHS) in >20 tissues, including multiple brain and derived neuronal tissues (Ward & Kellis, 2012). Variant rs71370498 is also predicted to alter six transcription factor binding site (TFBS) motifs (Ward & Kellis, 2012), suggesting a mechanism by which the variant could influence the expression of ZBTB4. This variant is significantly associated with AAO of AD in the GFR, after adjustment for the number of independent tests (p<0.005), and the alternate allele at rs71370498 significantly increases the hazard of AD among the GFR (z=2.06, p=0.039). The NCSTN variant rs73029438 also falls within a conserved promoter (ENSR00000019473 (Mclaren et al., 2016)), bears the corresponding histone modification and DHS in>20 tissues, and is predicted to alter TFBS motifs (Ward & Kellis, 2012). The alternate allele tended to increase the hazard of AD among the GFR, although the effect was not significant (z=0.903, p>0.05).
Table 2.
Variants associated with AAO of AD in both the R family and Germans from Russia.
| 1000 genomes AAF | WQLS statistic (p-value, df=1) | |||||||||||
|---|---|---|---|---|---|---|---|---|---|---|---|---|
| CHR | BP | REF | ALT | Name | AFR | AMR | EUR | AAFGFR | GFR | R | Locus | Impact |
| 1 | 159769187 | A | G | 1:159769187 | NA | NA | NA | 0.03 | 5.6901 (0.0171) |
8.1272 (0.0044) |
FCRL6 | CTCF binding site |
| 1 | 160267555 | G | A | rs10159339 | 0.02 | 0.02 | 0.03 | 0.05 | 6.7950 (0.0091) |
8.1272 (0.0044) |
NCSTN | COPA intron |
| 1 | 160312501 | C | T | rs73029438 | 0.13 | 0.02 | 0.02 | 0.05 | 6.7950 (0.0091) |
8.1272 (0.0044) |
NCSTN | Promoter variant, COPA intron |
| 1 | 160622992 | G | A | rs573672060 | NA | NA | NA | 0.03 | 4.7057 (0.0301) |
8.1272 (0.0044) |
SLAMF1 | Intergenic |
| 1 | 161751887 | G | A | rs562413208 | NA | NA | NA | 0.03 | 5.6901 (0.0171) |
8.1272 (0.0044) |
ATF6 | ATF6 intron, open chromatin region |
| 1 | 161843348 | C | A | 1:161843348 | NA | NA | NA | 0.03 | 5.6901 (0.0171) |
8.1272 (0.0044) |
ATF6 | ATF6 intron |
| 1 | 162206053 | T | G | 1:162206053 | NA | NA | NA | 0.03 | 5.6901 (0.0171) |
8.1272 (0.0044) |
NOS1AP | NOS1AP intron, open chromatin region |
| 17 | 7166660 | C | T | rs77549883 | 0.01 | 0.05 | 0.1 | 0.12 | 3.892 (0.0485) |
5.7796 (0.0162) |
CLDN7 | CLDN7 intron |
| 17 | 7363474 | C | G | rs34055023 | 0 | 0.15 | 0.03 | 0.04 | 4.6945 (0.0303) |
11.506 (0.0007) |
ZBTB4 | ZBTB4 3′ UTR |
| 17 | 7383137 | G | C | rs71370498 | 0.02 | 0.16 | 0.05 | 0.05 | 5.5847 (0.0181) |
13.3124 (0.0003) |
ZBTB4 | ZBTB4 intron, promoter |
| 17 | 7740170 | T | C | rs62059712 | 0.01 | 0.02 | 0.08 | 0.10 | 3.9782 (0.0461) |
8.3028 (0.0040) |
KDM6B | Upstream of KDM6B |
Alternate allele frequencies (AAF) are given for the African (AFR), Native American (AMR), and European (EUR) population samples in the 1000 genomes reference. AAFGFR = observed frequency in the Germans from Russia (GFR), not accounting for relatedness. CHR = chromosome, BP = hg19 sequence position of the variant, REF = reference allele, ALT = alternate allele, R = R family.
Independent replication of GFR loci
Association testing of SNPs shared by five independent data sets replicated association between ZBTB4 and AAO of AD, while none of the SNPs surrounding NCSTN were significant (Table 3). Three SNPs, rs2302761, rs2302762, and rs8071847, were significantly associated with AAO of AD in a meta-analysis of the Hispanic data sets after correcting for the number of independent tests on chr17 (p< 0.0081, Table 3). One of these SNPs, rs2302762, was also nominally associated with AAO of AD in the ADSP Europeans (p=0.0391). rs2302761 and rs8071847 are common SNPs in linkage disequilibrium among the 1000 genomes Europeans (AAF = 0.19, r2=0.84, D′=0.92 (Ward & Kellis, 2012)). Both SNPs are eQTLs for ZBTB4 (Consortium, 2015, Westra et al., 2013). This haplotype block spans both ZBTB4 and the promoter element containing rs71370498, the SNP associated with AAO of AD among the GFR. The third common SNP, rs2302762, falls within another promoter near ZBTB4 (1000 genomes Europeans AAF = 0.69, ENSR00000122477 (Mclaren et al., 2016)). Additional support from individual SNPs in single data sets include rs7217258, which was significantly associated with AAO of AD among the CU Hispanics (p = 0.0034), and rs7219550 which was nominally associated with AAO of AD among the NIALOAD Europeans (p=0.0386). Each test was well-controlled, with λ estimates near 1: ADSP Europeans = 0.9944, ADSP Hispanics = 1.0044, CU Hispanics = 0.9978, NIALOAD Europeans = 1.0022, and NIALOAD Hispanics = 0.9952. These results provide trans-ethnic support for the association of ZBTB4 with AAO of AD.
Table 3.
Association results at shared SNPs surrounding NCSTN and ZBTB4.
| Wald statistic (p value, df=1) | meta-analysis X2 (p-value) |
|||||||||
|---|---|---|---|---|---|---|---|---|---|---|
| CHR | BP | SNP | Impact | ADSP Europeans |
ADSP Hispanics |
CU Hispanics |
NIALOAD Europeans |
NIALOAD Hispanics |
Europeans (df = 4) |
Hispanics (df = 6) |
| 1 | 160,312,265 | rs10752637 | COPA intron | 0.0067 (0.9347) |
0.1037 (0.7474) |
0.1958 (0.6582) |
0.0255 (0.8731) |
0.0849 (0.7708) |
0.4066 (0.9819) | 1.9396 (0.9252) |
| 1 | 160,319,055 | rs12239946 | NCSTN intron | 0.4810 (0.4880) |
1.1554 (0.2824) |
0.3841 (0.5354) |
0.3880 (0.5334) |
1.9050 (0.1675) |
2.4958 (0.6106) | 7.3514 (0.2896) |
| 1 | 160,321,359 | rs6664438 | NCSTN intron | 1.9225 (0.1656) |
0.4179 (0.5180) |
0.8913 (0.3451) |
1.5938 (0.2068) |
0.0030 (0.9563) |
2.6921 (0.1498) | 3.5326 (0.7396) |
| 1 | 160,324,771 | rs6677637 | NCSTN intron | 1.9225 (0.1656) |
0.0108 (0.9170) |
1.4273 (0.2322) |
1.5938 (0.2068) |
0.1000 (0.7518) |
6.7487 (0.1498) | 3.6641 (0.7220) |
| 1 | 160,331,019 | rs4656256 | Downstream of NCSTN | 2.5175 (0.1126) |
0.6245 (0.4294) |
2.6682 (0.1024) |
1.9057 (0.1674) |
0.1095 (0.7407) |
6.7487 (0.0937) | 6.8494 (0.3350) |
| 1 | 160,333,742 | rs4656902 | Downstream of NCSTN | 2.7367 (0.0981) |
0.8000 (0.3711) |
0.2031 (0.6523) |
2.0129 (0.1560) |
0.0212 (0.8843) |
8.3605 (0.0792) | 3.0831 (0.7983) |
| 17 | 7,358,520 | rs2302761 | CHRNB1 intron | 0.0308 (0.8607) |
5.3895 (0.0203) |
2.0620 (0.1510) |
0.1867 (0.6657) |
5.6331 (0.0176) |
1.1139 (0.8921) | 19.6562 (0.0032*) |
| 17 | 7,358,861 | rs2302762 | CHRNB1 intron | 4.2570 (0.0391) |
1.5768 (0.2092) |
7.5426 (0.0060*) |
0.0235 (0.8782) |
2.3568 (0.1247) |
6.7437 (0.1501) | 17.5153 (0.0076*) |
| 17 | 7,360,110 | rs2302764 | CHRNB1 3′ UTR | 2.3815 (0.1228) |
0.0791 (0.7785) |
4.6354 (0.0313) |
0.0001 (0.9908) |
0.9663 (0.3256) |
4.2132 (0.3779) | 9.6719 (0.1392) |
| 17 | 7,370,605 | rs3853894 | ZBTB4 5′ UTR | 0.1179 (0.7313) |
0.1764 (0.6745) |
0.8597 (0.3538) |
2.4508 (0.1175) |
0.1640 (0.6855) |
4.9091 (0.2968) | 3.6207 (0.7278) |
| 17 | 7,381,366 | rs2241235 | ZBTB4 intron | 1.4933 (0.2217) |
0.0252 (0.8737) |
0.2386 (0.6252) |
0.4268 (0.5136) |
0.9064 (0.3411) |
4.3456 (0.3613) | 3.3606 (0.7624) |
| 17 | 7,395,549 | rs7217258 | POL2RA intron | 1.3299 (0.2488) |
1.1974 (0.2738) |
8.5761 (0.0034*) |
0.0137 (0.9067) |
1.1249 (0.2889) |
2.9780 (0.5615) | 16.4383 (0.0116) |
| 17 | 7,401,671 | rs7219550 | POL2RA intron | 0.5949 (0.4405) |
0.0188 (0.8911) |
1.1077 (0.2926) |
4.2767 (0.0386) |
0.0430 (0.8356) |
8.1466 (0.0864) | 3.0478 (0.8028) |
| 17 | 7,407,327 | rs8071847 | POL2RA intron | 0.0369 (0.8477) |
4.1598 (0.0414) |
4.0132 (0.0451) |
0.1999 (0.6548) |
4.1110 (0.0426) |
1.1772 (0.8818) | 18.8766 (0.0044*) |
= p<0.05 after correcting for maximum number of independent tests estimated across data sets. For the shared SNPs, the number of independent tests surrounding NCSTN ranged from 3.78 in the ADSP Europeans to 4.89 in the CU Hispanics, while the number of independent tests surrounding ZBTB4 ranged from 4.86 in the ADSP Europeans to 6.21 in the ADSP Hispanics. CHR = chromosome, BP = hg19 sequence position of the variant, REF = reference allele, ALT = alternate allele
Association testing of exome variants among the ADSP WES data set found nominally significant evidence of association between AAO of AD and multiple SNPs in ZBTB4 and a single SNP in NCSTN (Table 4, Table S9). Three of the five ZBTB4 SNVs nominally associated with AAO of AD (p< 0.05) were missense variants, as was the single NCSTN SNV (Mclaren et al., 2016). The NCSTN SNV, rs200632380, falls within the same promoter as rs73029438 (Mclaren et al., 2016), the SNP associated with AAO of AD among the GFR. The associated SNVs were rare, as all but rs11871207 were observed in a single individual. These tests were also well controlled, with λ = 0.9934.
Table 4.
Nominally significant association results within NCSTN and ZBTB4 in the ADSP WES data.
| 1000 genomes AAF | |||||||||||
|---|---|---|---|---|---|---|---|---|---|---|---|
| CHR | BP | REF | ALT | SNP | AFR | AMR | EUR | IMPACT | GENE | Wald Statistic (df=1) | p-value |
| 1 | 160,313,235 | C | G | rs200632380 | NA | NA | NA | Missense | NCSTN | 6.6323 | 0.0010 |
| 17 | 7,365,339 | T | C | NA | NA | NA | NA | Missense | ZBTB4 | 5.3596 | 0.0206 |
| 17 | 7,365,630 | C | T | NA | NA | NA | NA | Missense | ZBTB4 | 6.2873 | 0.0122 |
| 17 | 7,365,893 | G | A | NA | NA | NA | NA | Missense | ZBTB4 | 4.4090 | 0.0357 |
| 17 | 7,367,080 | G | A | rs11871207 | 0.0408 | 0.0043 | 0.0000 | Synonymous | ZBTB4 | 3.8709 | 0.0491 |
| 17 | 7,385,864 | C | T | NA | NA | NA | NA | Intronic | ZBTB4 | 4.4202 | 0.0355 |
Association results across all 96 NCSTN SNVs and 208 ZBTB4 SNVs are presented in Table S9. Alternate allele frequencies (AAF) are given for the African (AFR), Native American (AMR), and European (EUR) population samples in the 1000 genomes reference. CHR = chromosome, BP = hg19 sequence position of the variant, REF = reference allele, ALT = alternate allele.
Discussion
Fine-mapping of linkage regions has revealed that promoter variants in ZBTB4 and NCSTN are associated with AAO of AD among the GFR. Although the original linkage signals were discovered in Volga German families, the support for ZBTB4 across replication samples of both European-American and Caribbean Hispanic ancestry suggest that its importance to the AAO of AD extends across populations. The association between AAO of AD and both promoter variants and eQTLs in independent data sets reinforces the potential role of regulatory variants in the AAO of AD. We show below that both ZBTB4 and NCSTN are connected to known AD biology, nominating specific molecular and cellular mechanisms that may influence AAO of AD.
ZBTB4 can be connected to AD pathogenesis via Aβ and cell death pathways. ZBTB4 is a zinc finger protein family member which acts as a transcriptional repressor (Filion et al., 2006) and plays an important role in the regulation of cell cycle (Yamada et al., 2009). Aβ exposure degrades HIPK2 and increases the amount of unfolded p53 in AD tissues (Lanni et al., 2010, Lanni et al., 2007, Stanga et al., 2010). This interaction has been proposed to lead to the pathogenesis of AD(Stanga et al., 2010). It is possible ZBTB4 could alter the pathogenesis of AD, as the degradation of HIPK2 causes increased ZBTB4 expression (Yamada et al., 2009) and ZBTB4 suppresses the apoptotic response to p53 activation (Weber et al., 2008). Furthermore, animal models suggest that ZBTB4 expression can influence age-related cognitive impairment, as rats that are not cognitively impaired by aging have upregulated ZBTB4 (Haberman et al., 2011). This suggests that variants altering ZBTB4 expression and/or regulation may influence AD through mechanisms related to cell cycle and apoptosis.
NCSTN is part of the gamma secretase complex along with PSEN1 and PSEN2, two EOAD genes (Li et al., 2014). Alterations in NCSTN expression levels influence the production of the Aβ intrinsic to the pathology of AD (Murphy et al., 2003, Yu et al., 2000). The GFR variant rs73029438 falls within the same NCSTN promoter as two SNPs repeatedly associated with risk of sporadic AD in Chinese data sets (Ma et al., 2009, Zhong et al., 2009). A haplotype defined by non-coding NCSTN variants is also associated with risk of early-onset AD in Dutch families (Dermaut et al., 2002) and similarly enriched in Finnish AD cases vs. controls (Helisalmi et al., 2004) (Haplotype B; NCSTN:c.636A>G and c.747C>T, (Ward & Kellis, 2012)). These results suggest that it may be through the alteration of Aβ production that variants influencing NCSTN may influence the pathogenesis of the disease.
In addition to the ZBTB4 and NCSTN promoter variants, several additional variants on the linked haplotypes in the R family were also nominally associated with AAO of AD in the GFR (Table 2). It is possible that the cumulative effects of these variants contribute to the proportion of variance in AAO of AD explained by the linked haplotypes. This would be consistent with the eQTL and complex trait literature in humans (Lowe & Reddy, 2015, Albert & Kruglyak, 2015) and model organisms (De Luca et al., 2003, Mackay, 2004). It is therefore noteworthy that the Aβ and cell cycle/death pathways implicated by NCSTN and ZBTB4 are influenced by the variable expression of several of the additional genes associated with AAO of AD among the GFR: KDM6B (Ene et al., 2012), NOS1AP (Maher et al., 2014), and ATF6 (Kaneko et al., 2010). The coding and regulatory consequences of the variants associated with AAO of AD provide strong gene targets for the next stage of functional analyses. Their shared pathways may be used to define cellular and molecular phenotypes to test for association with either candidate variants or AAO of AD.
We have reduced linkage regions to their underlying haplotypes, and prioritized variants within them. Our strongest evidence of association with AAO of AD across multiple data sets implicates both regulatory and missense variants in ZBTB4. Although our association testing was blind to the function of the associated genes, the function of both ZBTB4 and NCSTN can be directly and indirectly linked to AD risk and pathology. Future bioinformatics annotation and functional assays will be performed to determine how each variant influences the target gene, and whether these effects are independent. This may yield insight that can be leveraged into new therapeutic agents.
Supplementary Material
Acknowledgments
We thank the patients and their families for their contribution to this research. We also thank our collaborators who contributed data to this study. Genotyping and data analysis presented here was supported by the National Institutes of Health [grant numbers R00AG040184 and P50AG005136].
The Genetic Studies of Alzheimer’s disease in Caribbean Hispanics (EFIGA, dbGaP Study Accession: phs000496.v1.p1) were funded by the National Institutes of Health [grant numbers 5R37AG015473, RF1AG015473, and R56AG051876]. We acknowledge the EFIGA study participants and the EFIGA research and support staff for their contributions to this study.
The National Institute on Aging Late-Onset Alzheimer’s Disease study was supported by the National Institutes of Health [grant numbers U24AG026395 and R01AG041797].
Funding for the Alzheimer Disease Sequencing Project (ADSP, dbGaP Study Accession: phs000572.v7.p4) data was provided by the National Institutes of Health (NIH) [grant numbers U54HG003273, U54HG003067, U54HG003079, U01AG032984, R01AG033193, UF1AG047133, U01AG049505, U01AG049506, U01AG049507, U01AG049508, 5RC2HL102419¸ HL105756, U24AG021886, U01AG016976, U24AG041689] and the National Heart Lung and Blood Institute (NHLBI)[contracts HHSN268201100005C, HHSN268201100006C, HHSN268201100007C, HHSN268201100008C, HHSN268201100009C, HHSN268201100010C, HHSN268201100011C, and HHSN268201100012C]. The ADSP is comprised of: two Alzheimer’s Disease (AD) genetics consortia and three National Human Genome Research Institute (NHGRI) funded Large Scale Sequencing Centers (LSSC). The two AD genetics consortia are the Alzheimer’s Disease Genetics Consortium (ADGC) funded by the National Institute on Aging (NIA), and the Cohorts for Heart and Aging Research in Genomic Epidemiology (CHARGE) funded by NIA, NHLBI, other NIH institutes and other foreign governmental and non-governmental organizations. The ADGC cohorts include: Adult Changes in Thought, the Alzheimer’s Disease Centers (ADC), the Chicago Health and Aging Project, the Memory and Aging Project, Mayo Clinic, Mayo PD, Miami University, the Multi-Institutional Research in Alzheimer’s Genetic Epidemiology, the National Cell Repository for Alzheimer’s Disease (NCRAD), Religious Orders Study, the Texas Alzheimer’s Research and Care Consortium, Vanderbilt University, the Washington Heights-Inwood Columbia Aging Project and the Washington University Sequencing Project. The CHARGE cohorts include: the Atherosclerosis Risk in Communities Study, the Austrian Stroke Prevention Study, the Cardiovascular Health Study, the Erasmus Rucphen Family Study, the Framingham Heart Study, and the Rotterdam Study. The three LSSC are: the Human Genome Sequencing Center at the Baylor College of Medicine, the Broad Institute Genome Center, and the Washington University Genome Institute. Biological samples and associated phenotypic data used in primary data analyses were stored at Study Investigators’ institutions, and at NCRAD at Indiana University funded by NIA. Associated phenotypic data used in primary and secondary data analyses were provided by Study Investigators, the NIA funded ADCs, and the National Alzheimer’s Coordinating Center (NACC) and stored at Study Investigators’ institutions, NCRAD, NIA Alzheimer’s Disease Data Storage Site at the University of Pennsylvania, funded by NIA, and at dbGaP funded by NIH. Contributors to the genetic analysis data included study investigators on projects that were individually funded by NIA, and other NIH institutes, and by private U.S. organizations, or foreign governmental or nongovernmental organizations.
We thank the Exome Aggregation Consortium and the groups that provided exome variant data for comparison. A full list of contributing groups can be found at http://exac.broadinstitute.org/about.
Footnotes
No conflicts of interest are declared by the authors.
References
- Albert FW, Kruglyak L. The role of regulatory variation in complex traits and disease. Nat Rev Genet. 2015;16:197–212. doi: 10.1038/nrg3891. [DOI] [PubMed] [Google Scholar]
- Almasy L, Blangero J. Exploring positional candidate genes: linkage conditional on measured genotype. Behav Genet. 2004;34:173–177. doi: 10.1023/B:BEGE.0000013731.03827.69. [DOI] [PubMed] [Google Scholar]
- Beecham GW, Naj A, Martin ER, Haines JL, Farrer L, Mayeux R, Pericak-Vance MA, Schellenberg G, DeStefano A, Bis JC, Choi SH, van Duijn C, Fornage M, Boerwinkle E, Goate A, Foroud T, Seshadri STADSPDaSS. The Alzheimer Disease Sequencing Project: study design and sample selection. Neurology: Genetics. doi: 10.1212/NXG.0000000000000194. in press. [DOI] [PMC free article] [PubMed] [Google Scholar]
- Bennett C, Crawford F, Osborne A, Diaz P, Hoyne J, Lopez R, Roques P, Duara R, Rossor M, Mullan M. Evidence that the APOE locus influences rate of disease progression in late onset familial Alzheimer’s Disease but is not causative. Am J Med Genet. 1995;60:1–6. doi: 10.1002/ajmg.1320600102. [DOI] [PubMed] [Google Scholar]
- Bird TD, Lampe TH, Nemens EJ, Miner GW, Sumi SM, Schellenberg GD. Familial Alzheimer’s disease in American descendants of the Volga Germans: probable genetic founder effect. Ann Neurol. 1988;23:25–31. doi: 10.1002/ana.410230106. [DOI] [PubMed] [Google Scholar]
- Blue E, Kunkle B, Vardarajan B, Jaworski J, Project., F.A.W.G.o.t.A.D.S. Whole genome sequencing in families to find new Alzheimer Disease genes: The analysis and current results from the Family Analysis Working Group of the Alzheimer’s Disease Sequencing Project. Annual meeting of the American Society of Human Genetics; Baltimore, MD, USA. 2015. [Google Scholar]
- Boerwinkle E, Chakraborty R, Sing CF. The use of measured genotype information in the analysis of quantitative phenotypes in man. I. Models and analytical methods. Ann Hum Genet. 1986;50:181–194. doi: 10.1111/j.1469-1809.1986.tb01037.x. [DOI] [PubMed] [Google Scholar]
- Bourgain C, Hoffjan S, Nicolae R, Newman D, Steiner L, Walker K, Reynolds R, Ober C, McPeek MS. Novel case-control test in a founder population identifies P-selectin as an atopy-susceptibility locus. Am J Hum Genet. 2003;73:612–626. doi: 10.1086/378208. [DOI] [PMC free article] [PubMed] [Google Scholar]
- Brookmeyer R, Evans DA, Hebert L, Langa KM, Heeringa SG, Plassman BL, Kukull WA. National estimates of the prevalence of Alzheimer’s disease in the United States. Alzheimers Dement. 2011;7:61–73. doi: 10.1016/j.jalz.2010.11.007. [DOI] [PMC free article] [PubMed] [Google Scholar]
- Choi Y, Marchani EE, Bird TD, Steinbart EJ, Blacker D, Wijsman EM. Genome scan of age-at-onset in the NIMH Alzheimer disease sample uncovers multiple loci, along with evidence of both genetic and sample heterogeneity. Am J Med Genet B Neuropsychiatr Genet. 2011;156B:785–798. doi: 10.1002/ajmg.b.31220. [DOI] [PMC free article] [PubMed] [Google Scholar]
- Conomos MP, Miller MB, Thornton TA. Robust inference of population structure for ancestry prediction and correction of stratification in the presence of relatedness. Genet Epidemiol. 2015;39:276–293. doi: 10.1002/gepi.21896. [DOI] [PMC free article] [PubMed] [Google Scholar]
- Conomos MP, Reiner AP, Weir BS, Thornton TA. Model-free Estimation of Recent Genetic Relatedness. Am J Hum Genet. 2016;98:127–148. doi: 10.1016/j.ajhg.2015.11.022. [DOI] [PMC free article] [PubMed] [Google Scholar]
- Conomos MP, Thornton T. GENESIS: GENetic EStimation and Inference in Structured samples (GENESIS): Statistical methods for analyzing genetic data from samples with population structure and/or relatedness. R package version 2.4.0 2016 [Google Scholar]
- Consortium, G.T. Human genomics. The Genotype-Tissue Expression (GTEx) pilot analysis: multitissue gene regulation in humans. Science. 2015;348:648–660. doi: 10.1126/science.1262110. [DOI] [PMC free article] [PubMed] [Google Scholar]
- Cruchaga C, Haller G, Chakraverty S, Mayo K, Vallania FL, Mitra RD, Faber K, Williamson J, Bird T, Diaz-Arrastia R, Foroud TM, Boeve BF, Graff-Radford NR, St Jean P, Lawson M, Ehm MG, Mayeux R, Goate AM, Consortium, N.-L.N.F.S. Rare variants in APP, PSEN1 and PSEN2 increase risk for AD in late-onset Alzheimer’s disease families. PLoS One. 2012;7:e31039. doi: 10.1371/journal.pone.0031039. [DOI] [PMC free article] [PubMed] [Google Scholar]
- Daw EW, Heath SC, Wijsman EM. Multipoint oligogenic analysis of age-at-onset data with applications to Alzheimer disease pedigrees. Am J Hum Genet. 1999;64:839–851. doi: 10.1086/302276. [DOI] [PMC free article] [PubMed] [Google Scholar]
- Daw EW, Payami H, Nemens EJ, Nochlin D, Bird TD, Schellenberg GD, Wijsman EM. The number of trait loci in late-onset Alzheimer disease. Am J Hum Genet. 2000;66:196–204. doi: 10.1086/302710. [DOI] [PMC free article] [PubMed] [Google Scholar]
- De Luca M, Roshina NV, Geiger-Thornsberry GL, Lyman RF, Pasyukova EG, Mackay TF. Dopa decarboxylase (Ddc) affects variation in Drosophila longevity. Nat Genet. 2003;34:429–433. doi: 10.1038/ng1218. [DOI] [PubMed] [Google Scholar]
- Dermaut B, Theuns J, Sleegers K, Hasegawa H, Van den Broeck M, Vennekens K, Corsmit E, St George-Hyslop P, Cruts M, van Duijn CM, Van Broeckhoven C. The gene encoding nicastrin, a major gamma-secretase component, modifies risk for familial early-onset Alzheimer disease in a Dutch population-based sample. Am J Hum Genet. 2002;70:1568–1574. doi: 10.1086/340732. [DOI] [PMC free article] [PubMed] [Google Scholar]
- Devlin B, Roeder K. Genomic control for association studies. Biometrics. 1999;55:997–1004. doi: 10.1111/j.0006-341x.1999.00997.x. [DOI] [PubMed] [Google Scholar]
- Ene CI, Edwards L, Riddick G, Baysan M, Woolard K, Kotliarova S, Lai C, Belova G, Cam M, Walling J, Zhou M, Stevenson H, Kim HS, Killian K, Veenstra T, Bailey R, Song H, Zhang W, Fine HA. Histone demethylase Jumonji D3 (JMJD3) as a tumor suppressor by regulating p53 protein nuclear stabilization. PLoS One. 2012;7:e51407. doi: 10.1371/journal.pone.0051407. [DOI] [PMC free article] [PubMed] [Google Scholar]
- Filion GJ, Zhenilo S, Salozhin S, Yamada D, Prokhortchouk E, Defossez PA. A family of human zinc finger proteins that bind methylated DNA and repress transcription. Mol Cell Biol. 2006;26:169–181. doi: 10.1128/MCB.26.1.169-181.2006. [DOI] [PMC free article] [PubMed] [Google Scholar]
- Fisher RA. Statistical Methods for Research Workers. Oliver & Boyd; Edinburgh: 1925. [Google Scholar]
- Haberman RP, Colantuoni C, Stocker AM, Schmidt AC, Pedersen JT, Gallagher M. Prominent hippocampal CA3 gene expression profile in neurocognitive aging. Neurobiol Aging. 2011;32:1678–1692. doi: 10.1016/j.neurobiolaging.2009.10.005. [DOI] [PMC free article] [PubMed] [Google Scholar]
- Heath SC. Markov chain Monte Carlo segregation and linkage analysis for oligogenic models. Am J Hum Genet. 1997;61:748–760. doi: 10.1086/515506. [DOI] [PMC free article] [PubMed] [Google Scholar]
- Helisalmi S, Dermaut B, Hiltunen M, Mannermaa A, Van den Broeck M, Lehtovirta M, Koivisto AM, Iivonen S, Cruts M, Soininen H, Van Broeckhoven C. Possible association of nicastrin polymorphisms and Alzheimer disease in the Finnish population. Neurology. 2004;63:173–175. doi: 10.1212/01.wnl.0000133153.98139.4e. [DOI] [PubMed] [Google Scholar]
- Hiatt JB, Pritchard CC, Salipante SJ, O’Roak BJ, Shendure J. Single molecule molecular inversion probes for targeted, high-accuracy detection of low-frequency variation. Genome Res. 2013;23:843–854. doi: 10.1101/gr.147686.112. [DOI] [PMC free article] [PubMed] [Google Scholar]
- Kaneko M, Koike H, Saito R, Kitamura Y, Okuma Y, Nomura Y. Loss of HRD1-mediated protein degradation causes amyloid precursor protein accumulation and amyloid-beta generation. J Neurosci. 2010;30:3924–3932. doi: 10.1523/JNEUROSCI.2422-09.2010. [DOI] [PMC free article] [PubMed] [Google Scholar]
- Karch CM, Goate AM. Alzheimer’s disease risk genes and mechanisms of disease pathogenesis. Biol Psychiatry. 2015;77:43–51. doi: 10.1016/j.biopsych.2014.05.006. [DOI] [PMC free article] [PubMed] [Google Scholar]
- Kass RE, Raftery AE. Bayes Factors. Journal of the American Statistical Association. 1995;90:773–795. [Google Scholar]
- Koepke H, Thompson E. Efficient identification of equivalences in dynamic graphs and pedigree structures. J Comput Biol. 2013;20:551–570. doi: 10.1089/cmb.2013.0032. [DOI] [PMC free article] [PubMed] [Google Scholar]
- Lalli MA, Bettcher BM, Arcila ML, Garcia G, Guzman C, Madrigal L, Ramirez L, Acosta-Uribe J, Baena A, Wojta KJ, Coppola G, Fitch R, de Both MD, Huentelman MJ, Reiman EM, Brunkow ME, Glusman G, Roach JC, Kao AW, Lopera F, Kosik KS. Whole-genome sequencing suggests a chemokine gene cluster that modifies age at onset in familial Alzheimer’s disease. Mol Psychiatry. 2015;20:1294–1300. doi: 10.1038/mp.2015.131. [DOI] [PMC free article] [PubMed] [Google Scholar]
- Lanni C, Nardinocchi L, Puca R, Stanga S, Uberti D, Memo M, Govoni S, D’Orazi G, Racchi M. Homeodomain interacting protein kinase 2: a target for Alzheimer’s beta amyloid leading to misfolded p53 and inappropriate cell survival. PLoS One. 2010;5:e10171. doi: 10.1371/journal.pone.0010171. [DOI] [PMC free article] [PubMed] [Google Scholar]
- Lanni C, Uberti D, Racchi M, Govoni S, Memo M. Unfolded p53: a potential biomarker for Alzheimer’s disease. J Alzheimers Dis. 2007;12:93–99. doi: 10.3233/jad-2007-12109. [DOI] [PubMed] [Google Scholar]
- Leduc V, De Beaumont L, Theroux L, Dea D, Aisen P, Petersen RC, Alzheimer’s Disease Neuroimaging, I. Dufour R, Poirier J. HMGCR is a genetic modifier for risk, age of onset and MCI conversion to Alzheimer’s disease in a three cohorts study. Mol Psychiatry. 2015;20:867–873. doi: 10.1038/mp.2014.81. [DOI] [PMC free article] [PubMed] [Google Scholar]
- Lee JH, Barral S, Cheng R, Chacon I, Santana V, Williamson J, Lantigua R, Medrano M, Jimenez-Velazquez IZ, Stern Y, Tycko B, Rogaeva E, Wakutani Y, Kawarai T, St George-Hyslop P, Mayeux R. Age-at-onset linkage analysis in Caribbean Hispanics with familial late-onset Alzheimer’s disease. Neurogenetics. 2008;9:51–60. doi: 10.1007/s10048-007-0103-3. [DOI] [PMC free article] [PubMed] [Google Scholar]
- Lee JH, Cheng R, Vardarajan B, Lantigua R, Reyes-Dumeyer D, Ortmann W, Graham RR, Bhangale T, Behrens TW, Medrano M, Jimenez-Velazquez IZ, Mayeux R. Genetic Modifiers of Age at Onset in Carriers of the G206A Mutation in PSEN1 With Familial Alzheimer Disease Among Caribbean Hispanics. JAMA Neurol. 2015;72:1043–1051. doi: 10.1001/jamaneurol.2015.1424. [DOI] [PMC free article] [PubMed] [Google Scholar]
- Li MX, Yeung JM, Cherny SS, Sham PC. Evaluating the effective numbers of independent tests and significant p-value thresholds in commercial genotyping arrays and public imputation reference datasets. Hum Genet. 2012;131:747–756. doi: 10.1007/s00439-011-1118-2. [DOI] [PMC free article] [PubMed] [Google Scholar]
- Li Y, Bohm C, Dodd R, Chen F, Qamar S, Schmitt-Ulms G, Fraser PE, St George-Hyslop PH. Structural biology of presenilin 1 complexes. Mol Neurodegener. 2014;9:59. doi: 10.1186/1750-1326-9-59. [DOI] [PMC free article] [PubMed] [Google Scholar]
- Lindsay J, Laurin D, Verreault R, Hebert R, Helliwell B, Hill GB, McDowell I. Risk factors for Alzheimer’s disease: a prospective analysis from the Canadian Study of Health and Aging. Am J Epidemiol. 2002;156:445–453. doi: 10.1093/aje/kwf074. [DOI] [PubMed] [Google Scholar]
- Lowe WL, Jr, Reddy TE. Genomic approaches for understanding the genetics of complex disease. Genome Res. 2015;25:1432–1441. doi: 10.1101/gr.190603.115. [DOI] [PMC free article] [PubMed] [Google Scholar]
- Ma Z, Han D, Zuo X, Wang F, Jia J. Association between promoter polymorphisms of the nicastrin gene and sporadic Alzheimer’s disease in North Chinese Han population. Neurosci Lett. 2009;458:136–139. doi: 10.1016/j.neulet.2009.04.048. [DOI] [PubMed] [Google Scholar]
- Mackay TF. The genetic architecture of quantitative traits: lessons from Drosophila. Curr Opin Genet Dev. 2004;14:253–257. doi: 10.1016/j.gde.2004.04.003. [DOI] [PubMed] [Google Scholar]
- Maher A, El-Sayed NS, Breitinger HG, Gad MZ. Overexpression of NMDAR2B in an inflammatory model of Alzheimer’s disease: modulation by NOS inhibitors. Brain Res Bull. 2014;109:109–116. doi: 10.1016/j.brainresbull.2014.10.007. [DOI] [PubMed] [Google Scholar]
- Manichaikul A, Mychaleckyj JC, Rich SS, Daly K, Sale M, Chen WM. Robust relationship inference in genome-wide association studies. Bioinformatics. 2010;26:2867–2873. doi: 10.1093/bioinformatics/btq559. [DOI] [PMC free article] [PubMed] [Google Scholar]
- Marchani EE, Bird TD, Steinbart EJ, Rosenthal E, Yu CE, Schellenberg GD, Wijsman EM. Evidence for three loci modifying age-at-onset of Alzheimer’s disease in early-onset PSEN2 families. Am J Med Genet B Neuropsychiatr Genet. 2010;153B:1031–1041. doi: 10.1002/ajmg.b.31072. [DOI] [PMC free article] [PubMed] [Google Scholar]
- Matise TC, Chen F, Chen W, De La Vega FM, Hansen M, He C, Hyland FC, Kennedy GC, Kong X, Murray SS, Ziegle JS, Stewart WC, Buyske S. A second-generation combined linkage physical map of the human genome. Genome Res. 2007;17:1783–1786. doi: 10.1101/gr.7156307. [DOI] [PMC free article] [PubMed] [Google Scholar]
- McLaren W, Gil L, Hunt SE, Riat HS, Ritchie GR, Thormann A, Flicek P, Cunningham F. The Ensembl Variant Effect Predictor. Genome Biol. 2016;17:122. doi: 10.1186/s13059-016-0974-4. [DOI] [PMC free article] [PubMed] [Google Scholar]
- Meyer JM, Breitner JC. Multiple threshold model for the onset of Alzheimer’s disease in the NAS-NRC twin panel. Am J Med Genet. 1998;81:92–97. doi: 10.1002/(sici)1096-8628(19980207)81:1<92::aid-ajmg16>3.0.co;2-r. [DOI] [PubMed] [Google Scholar]
- Murphy MP, Das P, Nyborg AC, Rochette MJ, Dodson MW, Loosbrock NM, Souder TM, McLendon C, Merit SL, Piper SC, Jansen KR, Golde TE. Overexpression of nicastrin increases Abeta production. FASEB J. 2003;17:1138–1140. doi: 10.1096/fj.02-1050fje. [DOI] [PubMed] [Google Scholar]
- Naj AC, Jun G, Reitz C, Kunkle BW, Perry W, Park YS, Beecham GW, Rajbhandary RA, Hamilton-Nelson KL, Wang LS, Kauwe JS, Huentelman MJ, Myers AJ, Bird TD, Boeve BF, Baldwin CT, Jarvik GP, Crane PK, Rogaeva E, Barmada MM, Demirci FY, Cruchaga C, Kramer PL, Ertekin-Taner N, Hardy J, Graff-Radford NR, Green RC, Larson EB, St George-Hyslop PH, Buxbaum JD, Evans DA, Schneider JA, Lunetta KL, Kamboh MI, Saykin AJ, Reiman EM, De Jager PL, Bennett DA, Morris JC, Montine TJ, Goate AM, Blacker D, Tsuang DW, Hakonarson H, Kukull WA, Foroud TM, Martin ER, Haines JL, Mayeux RP, Farrer LA, Schellenberg GD, Pericak-Vance MA, Alzheimer Disease Genetics, C. Albert MS, Albin RL, Apostolova LG, Arnold SE, Barber R, Barnes LL, Beach TG, Becker JT, Beekly D, Bigio EH, Bowen JD, Boxer A, Burke JR, Cairns NJ, Cantwell LB, Cao C, Carlson CS, Carney RM, Carrasquillo MM, Carroll SL, Chui HC, Clark DG, Corneveaux J, Cribbs DH, Crocco EA, DeCarli C, DeKosky ST, Dick M, Dickson DW, Duara R, Faber KM, Fallon KB, Farlow MR, Ferris S, Frosch MP, Galasko DR, Ganguli M, Gearing M, Geschwind DH, Ghetti B, Gilbert JR, Glass JD, Growdon JH, Hamilton RL, Harrell LE, Head E, Honig LS, et al. Effects of multiple genetic loci on age at onset in late-onset Alzheimer disease: a genome-wide association study. JAMA Neurol. 2014;71:1394–1404. doi: 10.1001/jamaneurol.2014.1491. [DOI] [PMC free article] [PubMed] [Google Scholar]
- Pastor P, Roe CM, Villegas A, Bedoya G, Chakraverty S, Garcia G, Tirado V, Norton J, Rios S, Martinez M, Kosik KS, Lopera F, Goate AM. Apolipoprotein Eepsilon4 modifies Alzheimer’s disease onset in an E280A PS1 kindred. Ann Neurol. 2003;54:163–169. doi: 10.1002/ana.10636. [DOI] [PubMed] [Google Scholar]
- Pedersen NL, Posner SF, Gatz M. Multiple-threshold models for genetic influences on age of onset for Alzheimer disease: findings in Swedish twins. Am J Med Genet. 2001;105:724–728. doi: 10.1002/ajmg.1608. [DOI] [PubMed] [Google Scholar]
- Ryman DC, Acosta-Baena N, Aisen PS, Bird T, Danek A, Fox NC, Goate A, Frommelt P, Ghetti B, Langbaum JB, Lopera F, Martins R, Masters CL, Mayeux RP, McDade E, Moreno S, Reiman EM, Ringman JM, Salloway S, Schofield PR, Sperling R, Tariot PN, Xiong C, Morris JC, Bateman RJ, Dominantly Inherited Alzheimer, N. Symptom onset in autosomal dominant Alzheimer disease: a systematic review and meta-analysis. Neurology. 2014;83:253–260. doi: 10.1212/WNL.0000000000000596. [DOI] [PMC free article] [PubMed] [Google Scholar]
- Sala Frigerio C, De Strooper B. Alzheimer’s Disease Mechanisms and Emerging Roads to Novel Therapeutics. Annu Rev Neurosci. 2016;39:57–79. doi: 10.1146/annurev-neuro-070815-014015. [DOI] [PubMed] [Google Scholar]
- Slooter AJ, Cruts M, Kalmijn S, Hofman A, Breteler MM, Van Broeckhoven C, van Duijn CM. Risk estimates of dementia by apolipoprotein E genotypes from a population-based incidence study: the Rotterdam Study. Arch Neurol. 1998;55:964–968. doi: 10.1001/archneur.55.7.964. [DOI] [PubMed] [Google Scholar]
- Stanga S, Lanni C, Govoni S, Uberti D, D’Orazi G, Racchi M. Unfolded p53 in the pathogenesis of Alzheimer’s disease: is HIPK2 the link? Aging (Albany NY) 2010;2:545–554. doi: 10.18632/aging.100205. [DOI] [PMC free article] [PubMed] [Google Scholar]
- Szigeti K, Kellermayer B, Lentini JM, Trummer B, Lal D, Doody RS, Yan L, Liu S, Ma C, Texas Alzheimer R, Care C. Ordered subset analysis of copy number variation association with age at onset of Alzheimer’s disease. J Alzheimers Dis. 2014;41:1063–1071. doi: 10.3233/JAD-132693. [DOI] [PMC free article] [PubMed] [Google Scholar]
- Szigeti K, Lal D, Li Y, Doody RS, Wilhelmsen K, Yan L, Liu S, Ma C, Texas Alzheimer, R. & Care, C. Genome-wide scan for copy number variation association with age at onset of Alzheimer’s disease. J Alzheimers Dis. 2013;33:517–523. doi: 10.3233/JAD-2012-121285. [DOI] [PMC free article] [PubMed] [Google Scholar]
- Thompson E. The structure of genetic linkage data: from LIPED to 1M SNPs. Hum Hered. 2011;71:86–96. doi: 10.1159/000313555. [DOI] [PMC free article] [PubMed] [Google Scholar]
- Thornton T, McPeek MS. Case-control association testing with related individuals: a more powerful quasi-likelihood score test. Am J Hum Genet. 2007;81:321–337. doi: 10.1086/519497. [DOI] [PMC free article] [PubMed] [Google Scholar]
- Thornton T, Zhang Q, Cai X, Ober C, McPeek MS. XM: association testing on the X-chromosome in case-control samples with related individuals. Genet Epidemiol. 2012;36:438–450. doi: 10.1002/gepi.21638. [DOI] [PMC free article] [PubMed] [Google Scholar]
- Tunstall N, Owen MJ, Williams J, Rice F, Carty S, Lillystone S, Fraser L, Kehoe P, Neill D, Rudrasingham V, Sham P, Lovestone S. Familial influence on variation in age of onset and behavioural phenotype in Alzheimer’s disease. Br J Psychiatry. 2000;176:156–159. doi: 10.1192/bjp.176.2.156. [DOI] [PubMed] [Google Scholar]
- Velez JI, Lopera F, Patel HR, Johar AS, Cai Y, Rivera D, Tobon C, Villegas A, Sepulveda-Falla D, Lehmann SG, Easteal S, Mastronardi CA, Arcos-Burgos M. Mutations modifying sporadic Alzheimer’s disease age of onset. Am J Med Genet B Neuropsychiatr Genet. 2016a;171:1116–1130. doi: 10.1002/ajmg.b.32493. [DOI] [PubMed] [Google Scholar]
- Velez JI, Lopera F, Sepulveda-Falla D, Patel HR, Johar AS, Chuah A, Tobon C, Rivera D, Villegas A, Cai Y, Peng K, Arkell R, Castellanos FX, Andrews SJ, Silva Lara MF, Creagh PK, Easteal S, de Leon J, Wong ML, Licinio J, Mastronardi CA, Arcos-Burgos M. APOE*E2 allele delays age of onset in PSEN1 E280A Alzheimer’s disease. Mol Psychiatry. 2016b;21:916–924. doi: 10.1038/mp.2015.177. [DOI] [PMC free article] [PubMed] [Google Scholar]
- Wang KS, Tonarelli S, Luo X, Wang L, Su B, Zuo L, Mao C, Rubin L, Briones D, Xu C. Polymorphisms within ASTN2 gene are associated with age at onset of Alzheimer’s disease. J Neural Transm (Vienna) 2015;122:701–708. doi: 10.1007/s00702-014-1306-z. [DOI] [PubMed] [Google Scholar]
- Ward LD, Kellis M. HaploReg: a resource for exploring chromatin states, conservation, and regulatory motif alterations within sets of genetically linked variants. Nucleic Acids Res. 2012;40:D930–934. doi: 10.1093/nar/gkr917. [DOI] [PMC free article] [PubMed] [Google Scholar]
- Weber A, Marquardt J, Elzi D, Forster N, Starke S, Glaum A, Yamada D, Defossez PA, Delrow J, Eisenman RN, Christiansen H, Eilers M. Zbtb4 represses transcription of P21CIP1 and controls the cellular response to p53 activation. EMBO J. 2008;27:1563–1574. doi: 10.1038/emboj.2008.85. [DOI] [PMC free article] [PubMed] [Google Scholar]
- Westra HJ, Peters MJ, Esko T, Yaghootkar H, Schurmann C, Kettunen J, Christiansen MW, Fairfax BP, Schramm K, Powell JE, Zhernakova A, Zhernakova DV, Veldink JH, Van den Berg LH, Karjalainen J, Withoff S, Uitterlinden AG, Hofman A, Rivadeneira F, t Hoen PA, Reinmaa E, Fischer K, Nelis M, Milani L, Melzer D, Ferrucci L, Singleton AB, Hernandez DG, Nalls MA, Homuth G, Nauck M, Radke D, Volker U, Perola M, Salomaa V, Brody J, Suchy-Dicey A, Gharib SA, Enquobahrie DA, Lumley T, Montgomery GW, Makino S, Prokisch H, Herder C, Roden M, Grallert H, Meitinger T, Strauch K, Li Y, Jansen RC, Visscher PM, Knight JC, Psaty BM, Ripatti S, Teumer A, Frayling TM, Metspalu A, van Meurs JB, Franke L. Systematic identification of trans eQTLs as putative drivers of known disease associations. Nat Genet. 2013;45:1238–1243. doi: 10.1038/ng.2756. [DOI] [PMC free article] [PubMed] [Google Scholar]
- Wijsman EM, Pankratz ND, Choi Y, Rothstein JH, Faber KM, Cheng R, Lee JH, Bird TD, Bennett DA, Diaz-Arrastia R, Goate AM, Farlow M, Ghetti B, Sweet RA, Foroud TM, Mayeux R, Group, N.-L.N.F.S. Genome-wide association of familial late-onset Alzheimer’s disease replicates BIN1 and CLU and nominates CUGBP2 in interaction with APOE. PLoS Genet. 2011;7:e1001308. doi: 10.1371/journal.pgen.1001308. [DOI] [PMC free article] [PubMed] [Google Scholar]
- Wu L, Rosa-Neto P, Hsiung GY, Sadovnick AD, Masellis M, Black SE, Jia J, Gauthier S. Early-onset familial Alzheimer’s disease (EOFAD) Can J Neurol Sci. 2012;39:436–445. doi: 10.1017/s0317167100013949. [DOI] [PubMed] [Google Scholar]
- Yamada D, Perez-Torrado R, Filion G, Caly M, Jammart B, Devignot V, Sasai N, Ravassard P, Mallet J, Sastre-Garau X, Schmitz ML, Defossez PA. The human protein kinase HIPK2 phosphorylates and downregulates the methyl-binding transcription factor ZBTB4. Oncogene. 2009;28:2535–2544. doi: 10.1038/onc.2009.109. [DOI] [PubMed] [Google Scholar]
- Yu G, Nishimura M, Arawaka S, Levitan D, Zhang L, Tandon A, Song YQ, Rogaeva E, Chen F, Kawarai T, Supala A, Levesque L, Yu H, Yang DS, Holmes E, Milman P, Liang Y, Zhang DM, Xu DH, Sato C, Rogaev E, Smith M, Janus C, Zhang Y, Aebersold R, Farrer LS, Sorbi S, Bruni A, Fraser P, St George-Hyslop P. Nicastrin modulates presenilin-mediated notch/glp-1 signal transduction and betaAPP processing. Nature. 2000;407:48–54. doi: 10.1038/35024009. [DOI] [PubMed] [Google Scholar]
- Zhao W, Marchani EE, Cheung CY, Steinbart EJ, Schellenberg GD, Bird TD, Wijsman EM. Genome scan in familial late-onset Alzheimer’s disease: a locus on chromosome 6 contributes to age-at-onset. Am J Med Genet B Neuropsychiatr Genet. 2013;162B:201–212. doi: 10.1002/ajmg.b.32133. [DOI] [PMC free article] [PubMed] [Google Scholar]
- Zhong L, Dong-hai Q, Hong-ying L, Qing-feng L. Analysis of the nicastrin promoter rs10752637 polymorphism and its association with Alzheimer’s disease. Eur J Neurosci. 2009;30:1831–1836. doi: 10.1111/j.1460-9568.2009.06942.x. [DOI] [PubMed] [Google Scholar]
Associated Data
This section collects any data citations, data availability statements, or supplementary materials included in this article.