

Abstract
Under anaerobic conditions, Escherichia coli is able to metabolize molecular hydrogen via the action of several [NiFe]-hydrogenase enzymes. Hydrogenase-2, which is typically present in cells at low levels during anaerobic respiration, is a periplasmic-facing membrane-bound complex that functions as a proton pump to convert energy from hydrogen (H2) oxidation into a proton gradient; consequently, its structure is of great interest. Empirically, the complex consists of a tightly bound core catalytic module, comprising large (HybC) and small (HybO) subunits, which is attached to an Fe–S protein (HybA) and an integral membrane protein (HybB). To date, efforts to gain a more detailed picture have been thwarted by low native expression levels of Hydrogenase-2 and the labile interaction between HybOC and HybA/HybB subunits. In the present paper, we describe a new overexpression system that has facilitated the determination of high-resolution crystal structures of HybOC and, hence, a prediction of the quaternary structure of the HybOCAB complex.
Keywords: crystallography, electrochemistry, hydrogen metabolism, iron–sulfur clusters, metalloenzymes, NiFe hydrogenase
Introduction
Hydrogen (H2) metabolism is an important feature of microbial physiology. In bacteria, molecular H2 can be used as an electron donor during respiration and, conversely, proton reduction to H2 is commonly employed to dispose of excess reducing equivalents during fermentation. Depending on the prevailing environmental conditions, the model organism Escherichia coli produces three [NiFe]-hydrogenase isoenzymes [1]. The unusual active site of [NiFe]-hydrogenases, the structure of which is remarkably conserved, has attracted a great deal of attention: it consists of a Ni atom which is co-ordinated by four cysteines, two of which are bridging to an Fe atom that is further co-ordinated by two CN− and one CO ligand [2,3]. The bridging position between the Ni and Fe atoms can be occupied by a further ligand — a hydroxide in oxidized inactive states (‘Ni-A’ or ‘Ni-B’, as defined by characteristic EPR (electron paramagnetic resonance) spectra, noting that Ni-A is modified further due to aerobic oxidation of active site cysteine to sulfenic acid) [4] or a hydride in active states (‘Ni-C’ and ‘Ni-R’) [2]. Minimally, [NiFe]-hydrogenases comprises a core catalytic heterodimer having a large subunit containing the active site and a small electron-transferring subunit that contains at least one Fe–S cluster [2].
In E. coli, Hydrogenase-1 (Hyd-1) is produced under anaerobic conditions in the late stationary phase of cell growth and is a member of the Group 1d hydrogenases that are characterized as oxygen-tolerant H2 oxidizers or are linked directly to O2 respiration [1,5,6]. Hydrogenase-3 (Hyd-3) is part of the formate hydrogenlyase complex that is produced under fermentative conditions and required for disproportionation of formate to CO2 and H2 [1,7]: it is classified as a Group 4 hydrogenase dedicated to H2 evolution [6]. Finally, Hydrogenase-2 (Hyd-2) is a member of the Group 1c [NiFe]-hydrogenases that are involved in anaerobic respiration, are O2-sensitive, and are bidirectional in that they can oxidize or evolve H2 with high efficiency [5,6,8–10]. Importantly, Hyd-2 has been proposed to function as a H2-driven proton pump, and in the present paper, we describe investigations to elucidate its structure.
Hydrogenase-2 is encoded by the hybOABCDEFG operon [11,12] (Figure 1A), which is expressed under anaerobic respiratory conditions, and allows H2 to be used as an electron donor for fumarate reduction [9,11,13]. Expression of the hyb operon is repressed by nitrate [14] and by the action of the iron–sulfur cluster regulator ‘IscR’ under aerobic conditions [15,16]. The structural genes are hybOABC, where hybC encodes the large subunit (often referred to as α) and hybO encodes the small subunit (often referred to as β). The HybOC heterodimer is located at the periplasmic side of the inner membrane, where it is anchored by a single C-terminal transmembrane (TM) domain on the small subunit HybO (Supplementary Figure S1) [17,18]. The HybOC module also associates with HybA, a protein containing four [4Fe–4S] clusters that is anchored at the periplasmic side of the membrane by a C-terminal TM domain, and with HybB, an integral membrane protein comprised of 10 TM helices (Supplementary Figure S1) [1]. The HybOC heterodimer is capable of both H2 oxidation and proton reduction, and the assumed role of HybAB is to couple this activity to the redox status of the quinone pool [9].
Figure 1. Schematic representation of the modified hyb operons of strains used in this study.

(A) A representation of the engineered hyb operon of strain FTH013 [5] used for Hyd-2-N production. (B) A representation of the genotype of overexpression host strain HJ001-hyp that carries in-frame ΔhybOA and is transformed with plasmid pOc: this was used to produce Hyd-2-NOP. See Supplementary Table S1 for more information on plasmids and strains.
In this paper, we report crystal structures of HybOC to high resolution, made possible by the design and optimization of a novel overexpression system for its increased production in E. coli. We compare the electrochemical and enzymatic profiles of the overproduced enzyme with native Hyd-2, which show it is essentially identical. Finally, consideration of the possible interactions of HybOC with homology models of HybA and HybB leads to a proposal for the complete structure of the membrane-bound complex.
Experimental
Molecular biology
E. coli K-12 strains used in this work (Supplementary Table S1) are based on MC4100 [19]. IC011 (as MC4100, ΔhyaB, ΔhycE, ΔhybOA) and HJ001 (as IC011 ΔiscR) have been recently described [20]. The HJ001-hyp strain was prepared by first cloning a synthetic hypA1-X operon, based on the sequences of Ralstonia eutropha [NiFe]-hydrogenase maturases [20], into pFAT122 [21] as an EcoRI/SalI fragment. This strain was then combined with a SalI/KpnI fragment from pFAT123 [21], resulting in a pBluescript (AmpR) vector carrying a ΔtatD::hypA1-X allele. The entire ΔtatD::hypA1-X allele was then transferred as an XbaI/KpnI fragment to pMAK705 and transferred to the chromosome of HJ001 as previously described [22]. The resultant HJ001-hyp strain carries the entire synthetic hypA1-X operon in place of tatD, which has no known role in hydrogenase activity [21]. The hybO gene was amplified from a colony suspension of strain FTH013 using primers AmplifyHybO_F and AmplifyHybO_R (see Supplementary Table S1). The resulting PCR product was composed of hybO without the N-terminal Tat sequence (i.e. starting at codon 38, Glu) and without the C-terminal TM domain, such that HybO is truncated at codon 330 (Gly) and immediately followed by the C-terminal his-tag. The amplification primers also encoded an overlapping region complementary to plasmid pQE-80L. The pQE-80L plasmid was amplified using primers OpenpQE80_F and OpenpQE80_R which contained complementary regions, overlapping with the amplified hybO PCR product. The two fragments were assembled using standard protocols via the Gibson assembly and the resultant plasmid called pOC.
Enzyme production and purification
Native Hyd-2 (Hyd-2-N) for all electrochemical (protein film electrochemistry, PFE) and viologen-based assays was produced and purified from strain FTH013 using a recently published procedure [23]. Strain FTH013 was cultured anaerobically at 37°C in Luria broth supplemented with glycerol (0.5%, w/v) and sodium fumarate (0.4%, w/v). Cells were harvested in late exponential phase (9 h following inoculation, 1% inoculum used), resuspended in Tris 100 mM, pH 7.5, EDTA 1 mM, NaCl 50 mM, with added DNase (0.003%, w/v) and lysozyme (0.012%, w/v), and frozen at −80°C. Purification of Hyd-2-N relied on the chromosomally encoded C-terminal his-tag on hybO: cells were thawed at room temperature and lysed by two passes through a cell disruptor system (Constant Systems) at 20 kPSI. Unbroken cells were pelleted by centrifugation at 3750 rpm and passed through a cell disruptor at 25 kPSI. Cell membranes were pelleted from the lysed cells by ultracentrifugation at 45 000 rpm, 4°C for 60 min and resuspended in Tris (100 mM, pH 7.5), NaCl (350 mM), before being mechanically homogenized by hand. The homogenized membranes were solubilized in Triton X-100 (to 3%, v/v) stirring for 40 min at 4°C, and debris was pelleted at 45 000 rpm for 60 min at 4°C. Imidazole (40 mM) and DTT (1 mM) were added to the resulting supernatant solution before it was applied to a Ni-affinity column (5 ml column volume, His-trap HP, GE Healthcare), pre-equilibrated with Tris (20 mM, pH 7.2), NaCl (350 mM), imidazole (60 mM), Triton X-100 (0.02%, v/v) and DTT (1 mM). Following a 20-column volume wash to remove unbound protein, Hyd-2-N was eluted from the Ni-affinity column by imidazole gradient (60–750 mM) over 16 column volumes. Fractions were assessed for content and purity by the absorbencies at 280 and 420 nm and by SDS–PAGE electrophoresis, pooled and concentrated using centrifugal concentrators with a 50 000 molecular mass cutoff (Vivaspin).
For electrochemical analyses, the concentrated Hyd-2-N was buffer-exchanged (PD-10 desalting columns, GE Healthcare) into Tris (50 mM, pH 7.2), NaCl (350 mM), Triton X-100 (0.02%, v/v), glycerol (10%, v/v) and DTT (1 mM) and snap-frozen in N2(l).
Recombinant, overproduced Hyd-2 [Hyd-2-NOP (native, overproduced)] was produced from E. coli HJ001-hyp transformed with pOC plasmid. Cells were grown anaerobically in Luria broth with 0.5% (v/v) glycerol and 0.4% (w/v) sodium fumarate, with added ampicillin (100 µg/ml). Transcription from the plasmid was induced by isopropyl β-d-1-thiogalactopyranoside (IPTG, final concentration 1 mM) at an OD600 of 0.25. Cells were harvested 9 h after induction in the late exponential phase, resuspended and frozen as outlined above. Purification of Hyd-2-NOP followed the previously published procedure for ΔTM hydrogenases [23]: frozen cell pellets were thawed at room temperature and protease inhibitor tablets were added (cOmplete, mini EDTA-free protease inhibitor cocktail, Roche, 1 tablet per 30 l culture) and allowed to stir into solution for 20 min at 4°C. Cells were lysed by two passes through a cell disruptor system (Constant Systems) at 20 kPSI. Debris was pelleted by ultracentrifugation at 45 000 rpm for 30 min at 4°C. Imidazole (50 mM) and DTT (1 mM) were added to the resulting supernatant solution before being applied to a Ni-affinity column (5 ml column volume, His-trap FF Crude, GE Healthcare) pre-equilibrated with Tris (50 mM, pH 7.2), NaCl (350 mM), imidazole (50 mM) and DTT (1 mM). Unbound proteins were washed from the column over 20 column volumes. A 16 column volume imidazole gradient (50–500 mM) was used to elute Hyd-2-NOP. Fractions were assessed for content and purity by the absorbencies at 280 and 420 nm and by SDS–PAGE electrophoresis, then pooled and concentrated using centrifugal concentrators with a 50 000 molecular mass cutoff (Vivaspin).
For electrochemical analyses, the concentrated Hyd-2-NOP was buffer-exchanged (PD-10 desalting columns, GE Healthcare) into Tris (50 mM, pH 7.2), NaCl (350 mM), glycerol (10% v/v), and DTT (1 mM), and snap-frozen in N2(l). For structural analyses, the concentrated Hyd-2-NOP was buffer-exchanged (PD-10 desalting columns, GE Healthcare) into Tris (20 mM, pH 7.2), NaCl (150 mM), DDM (0.02%, w/v), and DTT (1 mM) before further purification by size-exclusion chromatography (Superdex 200 Increase 10/300, GE Healthcare). Fractions were assessed for content and purity by the absorbencies at 280 and 420 nm and by SDS–PAGE electrophoresis, pooled and concentrated using centrifugal concentrators with a 50 000 molecular mass cutoff (Vivaspin) to a concentration of 5 mg ml−1, and determined using the method of Bradford [24].
Rocket immunoelectrophoresis
E. coli strains IC011, HJ001, and HJ001-hyp were separately transformed with pON or pOC (see Supplemantary Table S1). The cells were then cultured anaerobically in sealed 500 ml Duran bottles containing LB medium supplemented with 0.5% (v/v) glycerol, 0.4% (w/v) sodium fumarate, 50 µg/ml ampicillin, and 1 mM IPTG from the outset. Following growth at 37°C for 16 h, cells were harvested by centrifugation, washed in 50 mM Tris–HCl (pH 8.0), and suspended at 1 g of cell paste (wet weight) to 10 ml of 50 mM Tris–HCl (pH 8.0). Cell suspensions were then lysed by sonication, and cell debris and membranes were removed by ultracentrifugation. To prepare the gel, a 1% (w/v) agarose suspension was prepared in 20 mM sodium barbitone (pH 8.3) buffer. To 5 ml of this suspension was added 5 µl of a Hyd-2 rabbit serum raised against Hyd-2-N as purified previously [5] from strain FTH013 (see Supplementary Table S1). The mixture was then poured over a 5 × 5 cm glass plate and allowed to set before 2 mm diameter wells were inserted using a leather hole punch. Next, 2 µl of protein sample was added to each well and the agarose plates were subjected to electrophoresis for 16 h at 2 mA per plate using 20 mM sodium barbitone (pH 8.3) as buffer (4°C). Following electrophoresis, the plates were removed and incubated in 50 mM Tris–HCl (pH 7.5) containing 0.5 mM benzyl viologen and 1 mM tetrazolium red under a 100% H2 atmosphere, typically for 12 h at 37°C or until red formazan precipitate became visible.
Protein film electrochemistry
Protein film electrochemistry is a technique in which small amounts of hydrogenase are adsorbed onto a suitable working electrode for the measurement of enzyme activity under controlled potential. The all-glass electrochemical cell was located inside an anaerobic glove box (MBraun; [O2] < 0.5 ppm). A three-electrode configuration was used, in which a saturated calomel reference electrode (SCE) was located in a side arm connected to the main compartment of the cell by a luggin capillary. The main compartment, equipped with gas inlet and outlet ports and typically accommodating 2 ml of buffer-electrolyte solution, housed the pyrolytic graphite ‘edge’ (PGE) working electrode (which could be rotated at high speed) and a Pt counter electrode. For each experiment, the PGE (geometric surface area 0.03 cm2) was sanded (Hookit P400 sand paper), and hydrogenase solution (0.5–2 µl at 1–5 mg/ml) was applied by repeated ‘add/withdraw’ pipetting for 30 s as previously described [25]. The electrode was then rinsed with ultrapure H2O (Millipore, 18 MΩ cm) to remove unabsorbed protein and attached to the electrode rotator motor. Potential values were converted to the standard hydrogen electrode (SHE) scale (ESCE = ESHE + 0.241 V at 25°C) to allow easy comparison with published biochemical data [26].
Solution assays
Solution assays for determining the rate of H2 oxidation were carried out following an established procedure [25]. A micro-Eppendorf tube of the enzyme was placed under a 100% H2 environment for 12–18 h to ensure full reductive activation of the enzyme. To measure H2 oxidation activity, the reduction of 2 mM benzyl viologen (E = −358, ε = 8.4 mM−1 cm−1 at 604 nm) [27] was monitored at 604 nm under anaerobic conditions in a sealed cuvette containing 1 ml of KiPO4 buffer at pH 6.0 saturated with H2. An appropriate quantity of the enzyme (1–10 µg) was injected to initiate the reaction. The solution was stirred for the duration of the reaction. The enzyme was then placed under 100% Ar for at least 12 h. To measure H2 production, the oxidation of 0.40 mM fully reduced methyl viologen (E = −446, ε = 13.9 mM−1 cm−1 at 604 nm) [27] was monitored at 604 nm under anaerobic conditions in a sealed cuvette containing 1 ml of KiPO4 buffer at pH 6.0 saturated with Ar.
Size-exclusion chromatography with multi-angle laser light scattering
A sample of Hyd-2-NOP at a concentration of 5 mg ml−1 was injected into a superdex S200 increase column connected to an Akta pure chromatography system. Data were collected using a flow rate of 0.5 ml min−1. Light scattering measurements were collected using a Dawn Helios-II (Wyatt Technologies, U.S.A.) and refractive index was measured using Optilab T-rex refractometer (Wyatt Technologies, U.S.A.). Scattering data were analyzed using the conjugate analysis module in the Astra package. Conjugate analysis uses the light scattering signal in combination with the UV and refractive index signals to differentiate between scattering from protein and detergent, enabling the molecular mass of the protein embedded in the detergent micelle to be accurately determined. The extinction coefficient of the protein was calculated from the amino acid sequence, while that of DDM was taken to be zero. The dn/dc values used in the analysis were 0.185 ml g−1 for protein and 0.143 ml g−1 for DDM.
Protein crystallization
Following Ni-affinity and SEC, purified Hyd-2-NOP was concentrated to 5 mg ml−1 using centrifugal concentrators with a 50 000 molecular mass cutoff (Vivaspin). Protein concentration was assessed by the Bradford assay [25]. Crystals of Hyd-2-NOP were obtained using the sitting drop vapor diffusion technique, whereby 100 nl of protein solution was mixed with an equal volume of crystallization solution using a Mosquito robot (TTP labtech, U.K.) followed by incubation at 293 K in an aerobic atmosphere. Crystals of H2-reduced Hyd-2-NOP were obtained in a similar manner, but the Hyd-2 solution was exposed to an atmosphere of 100% H2 to activate the enzyme prior to crystallization in an anaerobic glove box containing a 100% nitrogen atmosphere. Long rod-shaped crystals appeared within 24 h from a mixture of Bis–tris (100 mM, pH 5.5), MgCl2 (200 mM) and PEG 3350 (25%, w/v). Prior to X-ray data collection, crystals were manually transferred to a cryoprotecting solution of Bis–tris (100 mM, pH 5.5), MgCl2 (200 mM), PEG 3350 (27%, w/v), and glycerol (15%, v/v) for 60 s before flash-cooling by immersion in N2(l).
X-ray data collection and structure determination
Diffraction data for the as-isolated enzyme were collected at beamline P14, PETRA III (Hamburg) at a wavelength of 0.976 Å using a Pilatus 6M hybrid pixel array detector, whereas data for the reduced enzyme were collected at beamline I03 (Diamond Light Source, U.K.) at a wavelength of 0.9794 Å using a Pilatus 6M detector. All data sets were collected at 100 K using a helical line scan to minimize photo-reduction during exposure to X-rays. All data reduction was performed using DIALS [28] and Aimless [29]. Initial phase estimates for the as-isolated enzyme were generated using Phaser [30] with pdb file 5A4M as a search model. Initial electron density maps were fragmented and difficult to interpret, manual addition of [4Fe4S] clusters in the proximal position and resetting the occupancy of the other metal centers using COOT [31] followed by 50 cycles of all atom refinement in REFMAC5 [32] greatly improved the electron density allowing automated model building using BUCCANEER [33]. Subsequent rounds of modeling and refinement were performed manually using COOT and REFMAC5, using TLS restraints and isotropic B-factors. Phase estimates for the reduced structures were calculated by rigid-body positional refinement of the as-isolated Hyd-2 model into the unit cell of the reduced structures using REFMAC5 followed by iterative rounds of manual rebuilding (COOT) and restrained refinement (REFMAC5). Structure superpositions were performed using LSQKAB [34], and analysis of protein interfaces was carried out using PISA [35]. The occupancy of the SD oxygen atom at Cys546 was estimated by deleting the carbonyl oxygen atom of nearby residue Arg428 (an atom present at 100% occupancy) and the SD oxygen atom of Cys546. Electron density maps were recalculated for the structure with the missing atoms followed by comparison of the relative heights of the Fo–Fc map peaks for the missing O atoms.
Results
Overproduction of Hyd-2 catalytic core
HybO and HybA are synthesized as precursor proteins with N-terminal twin-arginine (Tat) signal peptides for periplasmic targeting, and both also carry C-terminal TM domains for attachment to the membrane [18]. These structural and biosynthetic features limit the amount of Hyd-2 found in the cell at native levels [0.015 mg of Hyd-2 (g of cells)−1] [5]. Previous strategies to purify Hyd-2 have involved the protease treatment of membranes, which cleaved the HybO TM and liberated an active fragment of Hyd-2 (HybOC) [17]. Similarly, detergent solubilization of membranes with inclusion of a chromosomally encoded hexa-histidine affinity tag (His-tag) on the C-terminus of HybO (strain FTH013 in this study denoted Hyd-2-N and used in all electrochemical comparisons, see Figure 1A and Supplementary Table S1) allowed isolation of HybOC, with a small amount of co-purifying HybA [5]. To increase the yield of active Hyd-2 for biochemical and structural experiments, we designed an innovative overexpression system.
In principle, overproduction of HybOC should be possible if all cofactor biosynthesis, cofactor insertion, and enzyme maturation processes are kept in perfect balance. Moreover, previous work suggested that cellular levels of the small subunit (HybO) may be a limiting factor in Hyd-2 assembly, since excess large subunit (HybC) was often found in the cytoplasm in anaerobically grown cells [36]. This observation suggested that overexpression of the hybO gene encoding the small subunit alone could be a useful strategy. To test this hypothesis, an E. coli mutant strain was chosen (IC011, Supplementary Table S1), which lacked the genes for the Hyd-1 and Hyd-3 large subunits and also carried in-frame, nonpolar deletions of hybO and hybA [20]. Although still encoding the Hyd-2 large subunit HybC, this strain has no hydrogenase activity. Thus, when a soluble protein extract was examined by Rocket immunoelectrophoresis [13,37], no dye-linked Hyd-2 activity was detected (Figure 2A). Next, two plasmids were prepared that encoded truncated, His-tagged versions of E. coli HybO. Both plasmids encode hybO with a truncation of the C-terminal TM domain at codon 330 and deletion of the N-terminal Tat signal. The plasmid pON has an N-terminal His-tag, whereas pOC has a C-terminal His-tag (Supplementary Table S1).
Figure 2. Overproduction of active Hyd-2 using a plasmid-encoded small subunit.

(A and B) Nondenaturing Rocket immunoelectrophoresis was performed using horizontal thin-layers of 1% (w/v) agarose containing 5 µl of anti-Hyd-2 serum buffered with 20 mM barbitone–HCl at pH 8.3. Following electrophoresis, activity staining with 10 mM Tris–HCl (pH 7.5) containing 0.5 mM benzyl viologen and 1 mM tetrazolium red was carried out under a 100% H2 atmosphere. Soluble protein extracts of the FTD674 strain producing truncated Hyd-2 were applied as positive controls (+), and three different host strains IC011 (ΔhyaB, ΔhycE, ΔhybOA), HJ001 (ΔhyaB, ΔhycE, ΔhybOA, ΔiscR), and HJ001-hyp (ΔhyaB, ΔhycE, ΔhybOA, ΔiscR, ΔtatD::hypA1-X) were transformed with either pQE-80L vector (VC) pQE-80L with hybO ΔTat ΔTM N-terminal his-tag (pON), or pQE-80L with hybO ΔTat ΔTM C-terminal his-tag (pOc). (C) Identical soluble extracts used in (A and B) were also analyzed by Western immunoblotting (anti-his-tag antibody) following separation by SDS–PAGE and transfer to the nitrocellulose membrane.
The E. coli IC011 strain was transformed with either empty vector, pON, or pOC and grown anaerobically in the presence of 1 mM IPTG before a soluble protein extract was prepared. Under identical conditions, a control strain (‘FTD674’, Supplementary Table S1) producing a soluble version of Hyd-2 at native levels [18] was also cultured, and the relative amounts of active Hyd-2 were then assessed by Rocket immunoelectrophoresis [13,37] and Western immunoblotting (Figure 2A,C). Under these conditions, direct replacement of the HybO Tat signal peptide with an N-terminal His-tag (pON) led to poor protein production and no Hyd-2 activity. However, the plasmid encoding signal-less HybO carrying a C-terminal His-tag (pOC) produced stable small subunit that was able to interact with the large subunit (HybC) and generate an active Hyd-2 enzyme. Moreover, the amount of enzyme produced by the plasmid-based system exceeded native levels.
To further boost the yield of recombinant Hyd-2 to levels that would facilitate structural characterization by X-ray crystallography, an innovative combination of genetic engineering strategies was adopted. Not only is the hyb operon repressed by IscR [15], but removal of the iscR gene also has proved beneficial for overproduction of Fe–S cluster-containing proteins [38]. A version of the IC011 strain carrying a ΔiscR allele (HJ001) [20] was transformed with pON or pOC. Once more, the inclusion of an N-terminal His-tag appeared detrimental to protein stability and enzyme assembly, whereas the strain producing HybO with a C-terminal His-tag generated active Hyd-2 in excess of that observed for the native enzyme (Figure 2A).
To maximize [NiFe]-cofactor biosynthesis capability for HybC in the host strains, hyaB and hycE, which encode the large Ni- and Fe-containing subunits of Hyd-1 and Hyd-3, respectively, were deleted. It has previously been shown that a synthetic version of the R. eutropha hypA1B1F1C1D1E1X operon, encoding cofactor maturases, is active in E. coli [20]. A version of the hypA1-X operon, including the constitutive E. coli tat promoter [20], was integrated into the chromosome of strain HJ001 at the nonessential tatD locus to give the new strain ‘HJ001-hyp’ (see Figure 1B and Supplementary Table S1). The pON and pOC plasmids were then used to transform HJ001-hyp, and the cells were cultured under anaerobic overexpression conditions. The analysis of the soluble cell fractions revealed that active Hyd-2 was produced at high levels in this host strain, so long as the plasmid encoding C-terminally His-tagged HybO was used (Figure 2B,C). Based on these results, a protocol was developed that resulted, reproducibly, in an order-of-magnitude increase in production of Hyd-2, i.e. ∼0.15 mg of Hyd-2 (g of cells)−1.
Purification and catalytic activity of recombinant Hyd-2
Based on the high yield of protein purified from the cytoplasm of HJ001-Hyp with pOC (produced from strain HJ001-hyp.pOC) and termed ‘Hyd-2-NOP’ (NOP), this combination of strain and plasmid was used to overproduce protein for structural characterization (Supplementary Figure S2). A full enzymatic characterization was performed for Hyd-2-NOP, to ensure that the protein was fully formed and functionally comparable to Hyd-2-N, which is isolated from the periplasmic membrane of strain FTH013, having undergone full post-translational maturation and has previously been extensively characterized [5].
PFE produces, in a single experiment, a characteristic profile of the catalytic oxidation and reduction activities of an enzyme that is adsorbed on an electrode. In cyclic voltammetry, the electrode potential is cycled between two limits and the resulting catalytic activity is directly measured as current [39–42]. The previously published electrochemical profile of Hyd-2-N showed it to be a reversible hydrogenase for which proton reduction is inhibited by the product H2 [5,10]. The electrochemical profile of recombinant, overproduced Hyd-2-NOP adsorbed on a PGE electrode is also consistent with these characteristics, in that the enzyme requires only a minimal overpotential to catalyze either H2 oxidation or H+ reduction. The catalytic cyclic voltammogram of Hyd-2-NOP cuts sharply through the zero-current axis, and the H+ reduction current decreases with increasing H2 partial pressure (see Supplementary Figure S3–S6 for full electrochemical measurements and comparison).
The electrochemical profiles of Hyd-2-N and Hyd-2-NOP are similar, despite the fact that the Hyd-2-N HybOC catalytic core is co-purified with variable amounts of HybA [5], a protein containing a relay chain of four Fe–S clusters (Supplementary Figure S1): conversely, hybA is deleted from the chromosome of strain HJ001-hyp, used to produce Hyd-2-NOP. Clearly, the presence of HybA has a negligible effect on the shape of the electrochemical profile.
The EPR spectra for samples of Hyd-2-NOP prepared under different conditions (Supplementary Figure S7) are identical with those published for Hyd-2-N [5,43]. Turnover frequencies obtained by conventional assays are also within error for the two enzymes. Additionally, Hyd-2-N and Hyd-2-NOP share key metrics of enzymatic activity, and steady-state kinetic parameters are in good agreement with those previously published for Hyd-2-N (Table 1).
Table 1. Key enzymatic parameters for Hyd-2-N and Hyd-2-NOP, showing good agreement between the two enzymes.
| Parameter | Hyd-2-N | Hyd-2-NOP |
|---|---|---|
| Solution assay oxidation turnover frequency using benzyl viologen (s−1)1 | 204 ± 16 | 204 ± 17 |
| Solution assay H2 production turnover frequency using methyl viologen (s−1)1 | 10 ± 3 | 7 ± 1 |
| at −0.175 V (µM)2 | 21 ± 4 | 23 ± 7 |
| ΔH‡ at −0.200 V (kJ mol−1)3 | 43 ± 3 | 47 ± 2 |
| Eswitch (mV)4 | −51 ± 10 | −37 ± 27 |
| at −0.670 V (µM)3 | 219 ± 14 | 240 ± 11 |
All measurements were carried out at pH 6.0.
Measured at room temperature (20°C).
See Supplementary Figures S3, S4, S5, and S6 for details.
Measured at 30°C.
Structure of recombinant overproduced Hyd-2
Overall fold
The crystal structure of recombinant Hyd-2-NOP produced using the new strategy was solved to a maximum resolution of 1.5 Å (reduced) or 2.2 Å (as-isolated) (Table 2). Reduced structures were generated in either of two ways: by exposing Hyd-2-NOP to a 100% H2 atmosphere for 12 h prior to crystallization or by the addition of 5 mM DTT to the cryoprotecting solution and soaking as-isolated crystals for 1–2 min prior to flash-cooling. All structures reveal, as previously predicted (native PAGE, analytical unltracentrifugation, AUC, and measurements) [17], that the catalytic core of Hyd-2 is a dimer of heterodimers [Figure 3, [HybOC]2 — for clarity in this specific case, we use this notation instead of (αβ)2]. This arrangement is similar to that observed previously for O2-tolerant hydrogenases [44–46] (also reviewed in ref. [47]) and recently for the Actinobacterial-like-[NiFe]-hydrogenase from R. eutropha [48]. Analysis of the HybOC subunits using the DALI server (http://ekhidna.biocenter.helsinki.fi/dali_server/) [49] shows that they display a classic oxidoreductase fold similar to [NiFe]-hydrogenases from a wide variety of organisms and nearly identical with the fold of E. coli Hyd-1 (Supplementary Figure S8) [44]. The dimer of heterodimers is stabilized by 17 salt bridges and a further 16 hydrogen bonds in an extensive interface that spans both copies of the small and large subunits and buries 2678 Å2 of the solvent-accessible surface. Analysis of Hyd-2-NOP by SEC-MALLS (size-exclusion chromatography with multi-angle laser light scattering) in the presence of detergent confirmed the stability of the [HybOC]2 dimer with only minimal amounts of enzyme present in the HybOC monomeric form (Figure 4). The two copies of the HybOC dimer in the asymmetric unit show clear electron density for residues 10–276 (of 293 + 6 His giving 299) of HybO and for residues 2–552 (of 552) of HybC. Since residues 277–299 of HybO were still present in the crystals (Supplementary Figure S9), the lack of visible density suggests that they are flexible and disordered in the crystal lattice.
Table 2. X-ray data collection and refinement statistics for Hyd-2-NOP.
Values in parentheses refer to data in the highest resolution shell. Resolution limits for the refined model were determined using the paired refinement protocol [79].
| Sample | As-isolated/aerobic | Chemically reduced | Hydrogen reduced |
|---|---|---|---|
| Data collection | |||
| PDB ID | 6EHQ | 6EHS | 6EN9 |
| Space group | P212121 | P212121 | P212121 |
| Unit cell dimensions (Å) | a = 99.06, b = 100.09, c = 168.14 | a = 99.89, b = 100.07, c = 168.80 | a = 99.60, b = 100.54, c = 168.58 |
| Resolution (Å) | 85.4–2.2 (2.24–2.10) | 65.2–1.5 (1.53–1.50) | 86.35–1.5 (1.53–1.50) |
| Total reflections | 549 679 (27 487) | 2 394 760 (111 154) | 1 380 818 (74 652) |
| Unique reflections | 84 222 (4242) | 269 411 (12 174) | 255 707 (13 573) |
| Completeness (%) | 98.7 (95.5) | 100 (99.9) | 99.2 (98.2) |
| Multiplicity | 6.5 (6.5) | 8.9 (8.4) | 5.4 (5.5) |
| 6.4 (1.7) | 11.2 (1.4) | 10.9 (1.6) | |
| Rmerge (%) | 19.0 (98) | 10.8 (145) | 7.3 (85.8) |
| Rpim (%) | 12.0 (62.9) | 5.6 (79.5) | 3.9 (43.9) |
| CC1/2 | 0.978 (0.681) | 0.998 (0.554) | 0.998 (0.714) |
| Refinement | |||
| Rwork/Rfree (%) | 16.3/18.9 | 15.6/18.4 | 15.2/17.5 |
| No. of atoms | 13 242 | 13 570 | 13 903 |
| Macromolecule | 12 718 | 12 723 | 12 723 |
| Solvent | 524 | 847 | 1 180 |
| Average B-factors | |||
| Macromolecule | 30.6 | 19.85 | 19.28 |
| Solvent | 29.2 | 24.26 | 25.7 |
| RMSD bond lengths (Å) | 0.0128 | 0.0167 | 0.017 |
| RMSD angles (°) | 1.53 | 1.72 | 1.78 |
| Ramachandran plot (%) favored/outliers | 96.3/0 | 96.3/2 | 96.3/0 |
| Clashscore | 0.44 | 1.57 | 1.42 |
Figure 3. The structure of the catalytic core of Hyd-2-NOP containing two copies of the large and small subunits arranged as a dimer of heterodimers ([HybOC]2).

In one heterodimer, the small subunit (HybO) is colored blue and the large subunit (HybC) gold, in the second, both subunits are shown in gray to accentuate the position of the metals centers (displayed as spheres with iron–sulfur clusters colored bronze/yellow and the NiFe center bronze/green). Panels show the coordination of each metal center.
Figure 4. SEC-MALLS profile of Hyd-2-NOP in buffer containing detergent (Tris–HCl 20 mM, NaCl 150 mM, DTT 1 mM, and DDM 0.02%, pH 7.2).
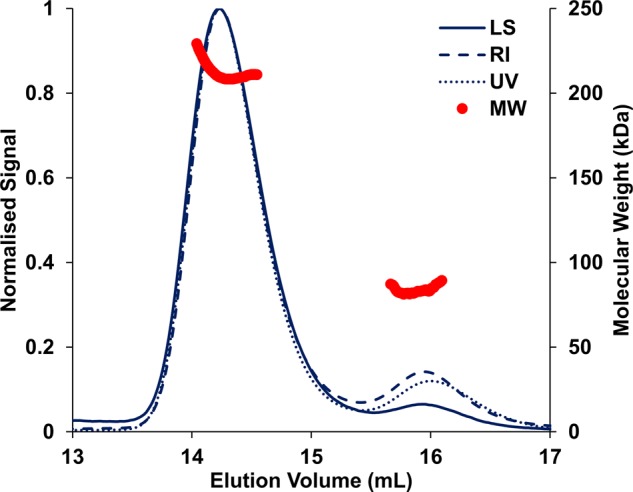
The displayed molecular mass corresponds to the protein component of each peak alone (see Methods). UV absorbance was measured at 280 nm. LS: laser scattering; RI: refractive index; MW: molecular mass.
Large subunit
Each HybOC heterodimer contains a NiFe catalytic center within the large (HybC) subunit. The Ni and Fe atoms in the active site are co-ordinated by four cysteine thiolate ligands (Cys61, Cys64, Cys546 and Cys549) and three of the remaining coordination positions of the Fe are occupied by small inorganic ligands (2 CN− and CO). The active site is structurally identical with that of Hyd-1 [44] with the similarity extending into the ‘canopy’ residues (Asp103, Arg479 and Asp544) above the active site, which comprise part of the second coordination sphere (Supplementary Figure S10).
Residual electron density occupying the bridging position between Ni and Fe was assigned to a hydroxide ligand in the as-isolated enzyme, since the proteins were purified aerobically. The bridging hydroxide was visible in both as-isolated and chemically reduced proteins, an observation that can be explained in terms of the difficulty in activating enzyme that is in the unready state, and the need for H2 to be present in addition to a supply of electrons [2]. Both as-isolated and chemically reduced crystals showed evidence for oxygenation of Cys546 (Supplementary Figure S10) [4].
In the H2-reduced structure, there is no evidence for oxygenation of any of the coordinating thiolate groups, and the distance between the Ni and Fe atoms has decreased from 2.85 to 2.65 Å. Repositioning of the Ni atom causes the coordinating thiolates (Cys61 and Cys546) to rotate ∼10° towards the metal atom, resulting in a contraction of the active site cavity that allows the carboxylate group of residue Glu14 to move 0.35 Å closer to the NiFe center. Residue Glu14 is the equivalent residue to Glu28 in Hyd-1 that has been shown to be essential for proton-coupled electron transfer [50]. A small peak in the Fo–Fc difference electron density is observed in the bridging position in one active site, and superposition of the Ni-R form of the NiFe center from Desulfovibrio vulgaris Miyazaki F (pdb:4U9H) [51] places the hydrogen atom located in that study within the difference density. The reduced D. vulgaris enzyme also has a similar separation of the Ni and Fe atoms at the catalytic center. A similar sized peak is also observed between the Ni and Fe atoms in the second active site, but its centroid is located much closer to the Ni (1.6 Å) than the Fe atom (2.45 Å), and superposition of the Ni-R catalytic center of pdb:4U9H does not place the hydrogen atom in the density (Supplementary Figure S11). Similar to most Group 1 [NiFe]-hydrogenases, during maturation, the final 15 amino acids encoded at the C-terminus of HybC are proteolytically processed [52], leaving a C-terminal His (552) to bind to a structural magnesium ion [2,53]. The structure of HybC confirms the presence of a magnesium ion co-ordinated by His552, Glu42, and the main chain carbonyl of Ala498.
Small subunit
As for all other Group 1 [NiFe]-hydrogenases, the small subunit (HybO) contains three iron–sulfur clusters that are separated from each other by a maximum distance of 10.7 Å and are thus well suited to mediate rapid long-range electron transfer to and from the active site in HybC (Supplementary Figure S12) [54]. Interestingly, the dimer of heterodimers structure places the two distal clusters within 12.3 Å of each other, implying that interdomain electron transfer could occur between each HybOC module [54]. The distal [4Fe–4S] cluster is located close to the surface of the small subunit and is co-ordinated by three cysteine residues (Cys195, Cys220, and Cys225) and one histidine (His192). The medial [3Fe–4S] cluster forms the central part of the electron transfer chain and is co-ordinated by Cys235, Cys255, and Cys258. The electron transfer chain in all Group 1 [NiFe]-hydrogenases has a [3Fe–4S] cluster in the medial position, with the exception of the relative small group of NiFeSe sub-class of Group 1a, where it is replaced by a [4Fe–4S] cluster.
The proximal [4Fe–4S] cluster, that closest to the catalytic NiFe center, displays standard cubane geometry in both the chemically reduced and H2-reduced structures and is completely co-ordinated by cysteine ligands (Cys22, Cys25, Cys120, and Cys154). Additional features were visible in the 2Fo–Fc map close to the proximal cluster for the as-isolated enzyme following prolonged exposure to air during protein purification (Figure 5). Anomalous difference density maps showed that these features were caused by the movement of an Fe atom, and the result was interpreted in terms of oxidative disruption of the cluster, similar to that observed for the [NiFe]-hydrogenase of Allochromatium vinosum and Desulfovibrio desulfuricans [55,56]. Interestingly, as the Fe atom moves away from the rest of the cluster and loses its coordination contact with Cys25, a nearby aspartate residue (Asp81) rotates to co-ordinate the Fe in its new position. From the relative intensities of the peaks in the anomalous difference maps for the migrated Fe, ∼50% of the protein molecules in the crystal are modified in this way.
Figure 5. Structure of the proximal [4Fe–4S] cluster of HybO with 2Fo–Fc electron density shown as a gray mesh.

(A) In as-isolated crystal, modelling the cluster in a cubane conformation resulted in the appearance of additional Fo–Fc electron density peaks (green mesh) next to the cluster. These peaks were interpreted as an alternate conformation adopted by the cluster upon oxidative damage (B), whereby the Fe atom co-ordinated by Cys25 moves away from the core of the cluster. Rotation of nearby Asp 81 allows the acidic group to co-ordinate the shifted Fe, and an additional water molecule (red sphere) occupies the remaining density next to the damaged cluster. (C) The proximal cluster and associated electron density for reduced Hyd-2 show the cluster is in a single, cubane-like conformation with no uninterpreted Fo–Fc density.
Discussion
The low expression levels and subsequent poor yield of E. coli Hyd-2 have hampered detailed biochemical investigations of this enzyme. Overproduction of multi-subunit, multi-cofactor metalloenzymes is challenging and often requires carefully co-ordinated co-expression of large numbers of accessory genes [57]. In the case of E. coli Hyd-2, we reasoned that one limiting factor was the availability of the Fe–S cluster-containing small subunit (HybO) of the central catalytic core, since Western immunoblots showed that the large subunit (HybC) is present in excess in the cytoplasm [36]. To this end, we developed an overexpression system that allowed us to obtain greatly enhanced amounts of active Hyd-2 suitable for a full biochemical and structural characterization. In terms of host strain development, in-frame and unmarked deletions in hybOA would not be expected to affect transcription and translation of the downstream hybBCDEFG genes. Strains without the hybOA allele have no Hyd-2 activity, clearly showing, in agreement with the work of Pinske et al. [58], that the large subunit HybC is unable to exhibit benzyl viologen-linked H2 oxidation activity without its small subunit partner. Introduction of hybO alone on a plasmid was sufficient not only to restore Hyd-2 activity but also to boost the amount of Hyd-2 in the cell an order of magnitude above native levels. Importantly, the version of HybO studied here was completely devoid of the N-terminal Tat signal peptide and C-terminal TM domain, thus demonstrating that, for this type of Tat substrate, the signal peptide probably has no additional role in enzyme biosynthesis beyond protein targeting.
Further host strain engineering, by de-repression of Fe–S cluster biosynthesis (and hyb operon expression) and by supplying additional copies of [NiFe] cofactor biosynthesis proteins, led to a highly active protein product. The new enzyme form contains a full complement of metal cofactors with enzymatic characteristics in excellent agreement with those for the native enzyme.
The active site region is very similar to that of the H2-oxidizing homolog Hyd-1, supporting proposals that characteristic properties of specific [NiFe]-hydrogenases, such as O2 tolerance [59–61] and bias with regard to H2 oxidation vs. H2 evolution [62–65], are determined much more by the nature of the iron–sulfur clusters that supply or remove electrons. Comparisons between the as-isolated and H2-reduced structures show that the oxygenated sulfur and bridging hydroxide ligand are no longer present in the active site of the latter. The H2-reduced structure also shows contraction of the Ni – Fe distance and small movements of the polypeptide backbone surrounding the NiFe center: notably, Glu14 moves toward the [NiFe] center, potentially improving the rate of proton transfer in and out of the active site. The position of side chains of other ionizable groups that could facilitate subsequent proton transfer steps to and from the active site remains unchanged, implying that the proton transfer pathway is close to optimal. The reduced structures are likely to be a mixture of reduced intermediates of the catalytic cycle similar to the mixture observed in the EPR samples (Supplementary Figure S7), yet the active site of one HybOC heterodimer appears to be predominantly in the Ni-R form, since the active site residues are structurally identical and the residual electron density peak is coincident with the bridging hydride in the Ni-R state of D. vulgaris Myazaki F [51]. The second active site may represent another state in the catalytic cycle, since the residual electron density peak is no longer in the bridging position, but much closer to the Ni atom; however, spectroscopic or EPR validation would be required to confirm this. The alternative proximal cluster configuration has been observed previously [55,56], and sequence alignment of Group 1 hydrogenases reveals that an aspartate, glutamate, or asparagine residue is conservatively substituted in position 81 (Supplementary Figure S13). The repositioning of the acidic side chain should be advantageous for O2 tolerance since coordination by aspartate prevents the complete loss of Fe from the proximal cluster upon oxidative damage (which normally leads to a [[3Fe–4S]+ cluster) and reduction alone allows rapid reconstitution of the [4Fe–4S] cluster.
Evidence for a dimer-of-heterodimer configuration in vivo
The dimer-of-heterodimers configuration of the large and small subunits ([HybOC]2 seen in Hyd2), with distal clusters close enough to allow efficient inter-subunit electron tunneling, has previously been exclusively linked with O2 tolerance having only been observed in O2-tolerant hydrogenases [44–46]. A dimeric structure has also recently been proposed for the standard O2-sensitive hydrogenase from A. vinosum [47,55]; however, the distance between distal clusters is too large to allow inter-subunit electron tunneling [54]. Also, the free energy of dissociation (ΔGdiss) of the dimer of heterodimers (calculated using PISA [35]) is 16 kcal/mol for the A. vinosum enzyme, suggesting that this quaternary structure is less stable than in [HybOC]2, where (ΔGdiss) is 23.0 kcal/mol, similar to that calculated for the O2-tolerant-membrane-bound hydrogenase from H. marinarus [31]. For comparison, (ΔGdiss) of the obligate heterodimer HybOC in Hyd-2 was found to be ∼52.0 kcal/mol (52 kcal/mol for A. vinosum). These calculations represent a lower limit based on the interactions seen in the crystal structure. The equilibrium constant for dimerization of the HybOC heterodimers is therefore ∼1017 — a value which suggests that Hyd-2 exists naturally in a dimer-of-heterodimers configuration. Previous analytical ultracentrifugation experiments also suggested that the [HybOC]2 configuration was stable in aqueous solution at a range of protein concentrations [17]. Moreover, the SEC-MALLS results of Hyd-2-NOP in the presence of detergent (Figure 4), a condition that should favor the monomeric HybOC heterodimer form, provide additional compelling support for the inherent stability of the [HybOC]2 dimer in solution, leading to the conclusion that it represents the in vivo structure.
Hyd-2 as a proton pump: a model for the quaternary structure of the membrane-bound Hyd-2 complex
Most membrane-bound hydrogenases are thought to couple H2 oxidation to quinone reduction with the concomitant transmembrane translocation of protons, conserving energy as a proton gradient. Membrane-bound hydrogenases, such as E. coli Hyd-1 and the R. eutropha MBH (membrane-bound hydrogenase), achieve this by associating the core hydrogenase subunits with an integral membrane cytochrome b, which contains one heme close to the hydrogenase distal [Fe–S] cluster and a second heme at the cytoplasmic side of the membrane near the quinone-binding site. These hydrogenases operate as scalar proton pumps where redox reactions separated by the ion-impermeable inner membrane result in a net translocation of protons. Hyd-2 belongs to a different and little-studied class of hydrogenases that are true conformational proton pumps. The proposed proton-pumping activity involves the membrane-embedded HybB protein in coupling the energy released from H2-dependent menaquinone reduction to generation of a transmembrane proton gradient. By analogy with structurally defined homologous proteins [66], HybB does not contain heme or any other metal cofactors and the menaquinone-binding site is located at the periplasmic side of the membrane. Cycles of menaquinone binding, reduction, and menaquinol release are thought to drive conformational changes in the membrane protein that powers proton translocation. Compelling evidence for this with E. coli Hyd-2 is derived from studies of the reverse reaction [9]. If the quinone pool becomes over-reduced, for example, by the presence of plentiful electron donors and an absence of electron acceptors, Hyd-2 can transduce energy stored in the proton gradient to catalyze the menaquinol-dependent reduction of protons to H2. This reversed electron transport is completely inhibited by the addition of chemical uncouplers that collapse the transmembrane proton electrochemical gradient [9].
The Hyd-2 holoenzyme is predicted to comprise the HybOC dimer together with HybA and HybB. An intact HybOCAB enzyme has never been isolated, suggesting that protein–protein associations beyond the catalytic core are more labile. The primary stabilizing force of Hyd-2 is the interaction between HybO and HybC in the heterodimer followed by the dimeric interaction of [HybOC]2. Although the crystal structure presented represents only the catalytic core of Hyd-2, it provides important insights into the quaternary structure of the HybOCAB complex within the bacterial membrane. The stability of the [HybOC]2 dimer and the location of hydrophobic patches on the surface of HybOC (that could mediate protein–protein interactions, Supplementary Figure S14) are central in guiding the construction of a model for the quaternary complex.
To construct a plausible model for the HybOCAB complex, structures for HybA and Hyb were produced by homology modeling using the Phyre 2 server [67]. These models were particularly informative, since the protein templates used are themselves components of other membrane-anchored, multi-protein respiratory enzymes and therefore not only suggest the individual structures of HybA and HybB, but also their probable location within the larger HybOCAB complex. For example, the FdnH ferredoxin subunit of formate dehydrogenase (pdb: 1kqf) [68], used to model HybA, sits between a dehydrogenase catalytic subunit and a quinone-reactive integral membrane protein, elevating the catalytic subunit away from the surface of the membrane. Assuming that the HybA subunits adopt a similar position in HybOCAB gives important clues to the architecture of HybOCAB. Biochemical experiments point to the C-terminal TM of HybA interacting with the C-terminal TM of HybO [5]. Moreover, the distal [Fe–S] cluster of HybO must be located within 14 Å of the proximal cluster of HybA in order for efficient electron transfer to occur [54]. The proposed location of HybA is consistent with these observations, implying that the catalytic HybOC dimer must be positioned further away from the membrane face than would be the case in either E. coli Hyd-1 or R. eutropha MBH. Comparison of the crystal structure with the protein sequence reveals that the HybO C-terminal helix, which anchors HybO to the cytoplasmic membrane and interacts with the HybA TM, is separated from the C-terminus of the catalytic domain by a linker comprised of 17 amino acids (not observed in the electron density maps). This linker is sufficiently long to allow HybA to be positioned between the catalytic HybOC complex and the membrane surface and still allow interaction between the HybO and HybA TM helices [5]. This model also places the distal cluster of HybO within 13.5 Å of one of the Fe–S clusters of HybA, close enough to allow electron transfer between the two proteins [54], and in the equivalent position to the cluster that accepts electrons from the MoCo active site in FdnH. This further supports the proposal that HybA acts as an electron transfer relay between HybOC and the integral membrane protein HybB that is expected to contact the quinone pool. Positioning of a ferredoxin subunit between a catalytic subunit and an integral membrane component is observed in other membrane-associated redox complexes, including polysulfide reductase [66] and nitrate reductase [69]. Typically, the catalytic and ferredoxin subunits are present in a 1 : 1 ratio [66,68,69], suggesting that there are two copies of HybA in the HybOCAB complex.
HybB is an integral membrane protein which is proposed to contain the menaquinone-binding site and also to act as a conformational proton pump [9,66]. Homology modeling [67] using PsrC, the integral membrane component of polysulfide reductase (pdb: 2vpz) [66], as a template reveals a structure with eight of the predicted TM helices arranged in two four-helix-bundle-like folds. The polysulfide reductase complex consists of two PsrABC trimers with PsrC providing almost all the interactions that stabilize the dimer interface, suggesting that HybB would also tend to dimerize in the membrane.
The stability of the [HybOC]2 dimer of heterodimers, the implied propensity of HybB to dimerize, and the observation that in other redox complexes each catalytic subunit has its own partner ferredoxin suggest strongly that the physiological complex of Hyd-2 comprises two copies of each protein [HybOCAB]2 (Figure 6). The organization of proteins in the model of Hyd-2 can be divided into three distinct modules: an outer catalytic module, a central electron relay module, and an integral membrane module linking H2 oxidation/production to the quinone pool. Such an arrangement is seen in a variety of other membrane-anchored, multi-subunit redox protein complexes including nitrate reductase and even Complex I [69–71].
Figure 6. The crystal structure of [HybOC]2 is combined with homology models of HybAB to show a proposal for the quaternary configuration of the membrane-bound [HybOCAB]2 complex.

The linker connecting the globular domain of HybO the transmembrane helix has been omitted since it flexibility prohibits modeling its location with any degree of confidence.
Interrogation of the [HybOCAB]2 model (Figure 6) will allow the mechanism of proton pumping to be determined. For example, it is likely that electron transfer from HybA to the quinone-binding site on HybB is by a highly conserved mechanism. Studies of both polysulfide reductase [66] and DMSO reductase [72] identified a conserved proline residue important in regulating electron transfer to quinone. The equivalent conserved residue in HybA is Pro-125, which is an obvious start point for further investigation.
The role of Hyd-2 in infection and colonization
Membrane-bound hydrogenases of the HybOCAB type are crucial enzymes for understanding H2 metabolism in bacterial pathogens. Interest in Hyd-2 therefore extends beyond its capability for efficient H2 production, to understanding its unique mechanism of linking H2 metabolism to the pathogenicity of microorganisms. As such, the determination of high-resolution crystal structures of Hyd-2 is a major step forward and will be essential to the characterization of hydrogenase inhibitors designed to combat infections [73].
Hyd-2 is especially important in the food- and water-borne pathogen Salmonella enterica where it has dual roles in both infection and colonization [74,75]. In S. enterica, Hyd-2 activity also contributes to virulence in a mouse model [74,76]. Moreover, Hyd-2 was found to be critical for anaerobic growth of S. enterica in environments designed to simulate the gut lumen where the proton motive force generated by Hyd-2 was used for rapid uptake of amino acids [77]. In this same vein, Hyd-2 is important in the specific colonization of some animal hosts. A large-scale genomic study discovered that S. enterica carrying inactivating mutations in the hybOABCDEFG operon was unable to colonize the chicken gut, but was completely unaffected in the ability to colonize cattle or pigs [75].
The structure of HybOC determined here is already giving new impetus to the study of the molecular basis of Hyd-2 in virulence. An S. enterica strain commonly used in laboratory-based studies is the attenuated nonpathogenic LT2a strain. Sequencing of this strain identified a Gly-153-Asp substitution in HybO close to the Cys-154 ligand to the proximal [4Fe–4S] cluster [78]. Analysis of the structure shows that the backbone torsion angles of the polypeptide chain in this region are only accessible to glycine and mutation to any other amino acid would disrupt the proximal and medial Fe–S clusters or their immediate environment, resulting in the nonpathogenic phenotype.
In conclusion, the overexpression system developed here establishes that HybO availability is an important limiting factor for native Hyd-2 synthesis and that HybO ΔTAT ΔTM can be expressed from a plasmid with negligible effects on enzymatic activity. This new approach will facilitate mutagenesis and other molecular biology techniques for subunits expressed from the plasmid. Moreover, as shown, successful overproduction of a single [NiFe]-hydrogenase subunit provides a new strategy for increasing yields of hydrogenase or other proteins processed by the Tat system, with obvious advantages for their biophysical and biochemical analysis. Finally, the structure of the catalytic core of Hyd-2 provides valuable insights both as the structure affects the catalytic activity of HybOC and as the basis for a prediction of the quaternary structure with its own physiological implications.
Acknowledgements
We thank Diamond Light Source for beamtime (proposal mx12346) and the staff of beamline I03 for assistance during data collection, PETRA III for beamtime, and the staff of beamline P14 for help during data collection. We also thank Dr Edward Lowe for collecting X-ray diffraction data for the as-isolated enzyme and Dr Gemma Harris for collection and analysis of the SEC-MALLS data. We are grateful to Dr Will Myers for his assistance in the collection of EPR spectra as well as the CAESR Facility at the University of Oxford. Mrs Elena Nomerotskaia is acknowledged for invaluable technical assistance throughout this work.
Abbreviations
- EPR
electron paramagnetic resonance
- H2
hydrogen
- Hyd-1
E. coli Hydrogenase-1
- Hyd-2
E. coli Hydrogenase-2
- Hyd-2-N
native Hyd-2
- Hyd-2-NOP
native over-produced Hyd-2
- Hyd-3
Hydrogenase-3
- IPTG
isopropyl β-d-1-thiogalactopyranoside
- IscR
iron–sulphur cluster regulator
- MBH
membrane-bound hydrogenase
- PFE
protein film electrochemistry
- PGE
pyrolytic graphite edge
- SCE
saturated calomel reference electrode
- SEC-MALLS
size-exclusion chromatography with multi-angle laser light scattering
- SHE
standard hydrogen electrode
- Tat
Twin-arginine transporter
- TM
transmembrane
Author Contribution
S.E.B. generated plasmid and strain constructs, purified protein, and carried out biochemical and electrochemical analysis under the supervision of R.M.E. S.B.C. crystallized Hyd-2, collected X-ray diffraction data, and solved the structure. F.S. and A.J.F. performed cloning, rocket immunoelectrophoresis assays, and Western immunoblotting, while F.S. and C.M.L. performed strain construction. F.A.A. and R.M.E. conceived the study and the manuscript was written by S.E.B., R.M.E., S.B.C., F.S., and F.A.A.
Funding
This research was funded in Oxford by the Biotechnology and Biological Sciences Research Council (BBSRC) Grant BB/N006321/1 and in Dundee by BBSRC EASTBIO Doctoral Training Partnership awards 1510231 and 1280664. F.A.A. is a Royal Society Wolfson Research Merit Award holder. S.E.B. is grateful to the Dakota Foundation for the award of a Holaday Scholarship.
Competing Interests
The Authors declare that there are no competing interests associated with the manuscript.
Supplementary Material
References
- 1.Sargent F. (2016) The model [NiFe]-hydrogenases of Escherichia coli. Adv. Microb. Physiol. 68, 433–507 10.1016/bs.ampbs.2016.02.008 [DOI] [PubMed] [Google Scholar]
- 2.Lubitz W., Ogata H., Rüdiger O. and Reijerse E. (2014) Hydrogenases. Chem. Rev. 114, 4081–4148 10.1021/cr4005814 [DOI] [PubMed] [Google Scholar]
- 3.Fontecilla-Camps J.C., Volbeda A., Cavazza C. and Nicolet Y. (2007) Structure/function relationships of [NiFe]- and [FeFe]-hydrogenases. Chem. Rev. 107, 4273–4303 10.1021/cr050195z [DOI] [PubMed] [Google Scholar]
- 4.Volbeda A., Martin L., Barbier E., Gutiérrez-Sanz O., De Lacey A.L., Liebgott P.-P. et al. (2015) Crystallographic studies of [NiFe]-hydrogenase mutants: towards consensus structures for the elusive unready oxidized states. J. Biol. Inorg. Chem. 20, 11–22 10.1007/s00775-014-1203-9 [DOI] [PubMed] [Google Scholar]
- 5.Lukey M.J., Parkin A., Roessler M.M., Murphy B.J., Harmer J., Palmer T. et al. (2010) How Escherichia coli is equipped to oxidize hydrogen under different redox conditions. J. Biol. Chem. 285, 3928–3938 10.1074/jbc.M109.067751 [DOI] [PMC free article] [PubMed] [Google Scholar]
- 6.Greening C., Biswas A., Carere C.R., Jackson C.J., Taylor M.C., Stott M.B. et al. (2016) Genomic and metagenomic surveys of hydrogenase distribution indicate H2 is a widely utilised energy source for microbial growth and survival. ISME J. 10, 761–777 10.1038/ismej.2015 [DOI] [PMC free article] [PubMed] [Google Scholar]
- 7.Mcdowall J.S., Murphy B.J., Haumann M., Palmer T., Armstrong F.A. and Sargent F. (2014) Bacterial formate hydrogenlyase complex. Proc. Natl Acad. Sci. U.S.A. 111, E3948–E3956 10.1073/pnas.1407927111 [DOI] [PMC free article] [PubMed] [Google Scholar]
- 8.Trchounian K., Soboh B., Sawers R.G. and Trchounian A. (2013) Contribution of hydrogenase 2 to stationary phase H2 production by Escherichia coli during fermentation of glycerol. Cell Biochem. Biophys. 66, 103–108 10.1007/s12013-012-9458-7 [DOI] [PubMed] [Google Scholar]
- 9.Pinske C., Jaroschinsky M., Linek S., Kelly C.L., Sargent F. and Sawers R.G. (2015) Physiology and bioenergetics of [NiFe]-hydrogenase 2-catalyzed H2-consuming and H2-producing reactions in Escherichia coli. J. Bacteriol. 197, 296–306 10.1128/JB.02335-14 [DOI] [PMC free article] [PubMed] [Google Scholar]
- 10.Armstrong F.A. and Hirst J. (2011) Reversibility and efficiency in electrocatalytic energy conversion and lessons from enzymes. Proc. Natl Acad. Sci. U.S.A. 108, 14049–14054 10.1073/pnas.1103697108 [DOI] [PMC free article] [PubMed] [Google Scholar]
- 11.Menon N.K., Chatelus C.Y., Dervartanian M., Wendt J.C., Shanmugam K.T., Peck H.D. et al. (1994) Cloning, sequencing, and mutational analysis of the hyb operon encoding Escherichia coli hydrogenase 2. J. Bacteriol. 176, 4416–4423 10.1128/jb.176.14.4416-4423.1994 [DOI] [PMC free article] [PubMed] [Google Scholar]
- 12.Sargent F., Ballantine S.P., Rugman P.A., Palmer T. and Boxer D.H. (1998) Reassignment of the gene encoding the Escherichia coli hydrogenase 2 small subunit--identification of a soluble precursor of the small subunit in a hypB mutant. Eur. J. Biochem. 255, 746–754 10.1046/j.1432-1327.1998.2550746.x [DOI] [PubMed] [Google Scholar]
- 13.Ballantine S.P. and Boxer D.H. (1985) Nickel-containing hydrogenase isozymes from anaerobically grown Escherichia coli K-12. J. Bacteriol. 163, 454–459 PMID: [DOI] [PMC free article] [PubMed] [Google Scholar]
- 14.Richard D.J., Sargent F., Sawers G., McWalter L. and Boxer D.H. (1999) Transcriptional regulation in response to oxygen and nitrate of the operons encoding the [NiFe] hydrogenases 1 and 2 of Escherichia coli. Microbiology 145, 2903–2912 10.1099/00221287-145-10-2903 [DOI] [PubMed] [Google Scholar]
- 15.Giel J.L., Rodionov D., Liu M., Blattner F.R. and Kiley P.J. (2006) IscR-dependent gene expression links iron-sulphur cluster assembly to the control of O2-regulated genes in Escherichia coli. Mol. Microbiol. 60, 1058–1075 10.1111/j.1365-2958.2006.05160.x [DOI] [PubMed] [Google Scholar]
- 16.Nesbit A.D., Giel J.L., Rose J.C. and Kiley P.J. (2009) Sequence-specific binding to a subset of IscR-regulated promoters does not require IscR Fe–S cluster ligation. J. Mol. Biol. 387, 28–41 10.1016/j.jmb.2009.01.055 [DOI] [PMC free article] [PubMed] [Google Scholar]
- 17.Ballantine S.P. and Boxer D.H. (1986) Isolation and characterisation of a soluble active fragment of hydrogenase isoenzyme 2 from the membranes of anaerobically grown Escherichia coli. Eur. J. Biochem. 156, 277–284 10.1111/j.1432-1033.1986.tb09578.x [DOI] [PubMed] [Google Scholar]
- 18.Hatzixanthis K., Palmer T. and Sargent F. (2003) A subset of bacterial inner membrane proteins integrated by the twin-arginine translocase. Mol. Microbiol. 49, 1377–1390 10.1046/j.1365-2958.2003.03642.x [DOI] [PubMed] [Google Scholar]
- 19.Casadaban M.J. and Cohen S.N. (1979) Lactose genes fused to exogenous promoters in one step using a Mu-lac bacteriophage: in vivo probe for transcriptional control sequences. Proc. Natl Acad. Sci. U.S.A. 76, 4530–4533 PMID: [DOI] [PMC free article] [PubMed] [Google Scholar]
- 20.Lamont C.M. and Sargent F. (2017) Design and characterisation of synthetic operons for biohydrogen technology. Arch. Microbiol. 199, 495–503 10.1007/s00203-016-1322-5 [DOI] [PMC free article] [PubMed] [Google Scholar]
- 21.Wexler M., Sargent F., Jack R.L., Stanley N.R., Bogsch E.G., Robinson C. et al. (2000) TatD is a cytoplasmic protein with DNase activity. No requirement for TatD family proteins in sec-independent protein export. J. Biol. Chem. 275, 16717–16722 10.1074/jbc.M000800200 [DOI] [PubMed] [Google Scholar]
- 22.Hamilton C.M., Aldea M., Washburn B.K., Babitzke P. and Kushner S.R. (1989) New method for generating deletions and gene replacements in Escherichia coli. J. Bacteriol. 171, 4617–4622 10.1128/jb.171.9.4617-4622.1989 [DOI] [PMC free article] [PubMed] [Google Scholar]
- 23.Evans R.M., Brooke E.J., Wehlin S.A.M., Nomerotskaia E., Sargent F., Carr S.B. et al. (2016) Mechanism of hydrogen activation by [NiFe] hydrogenases. Nat. Chem. Biol. 12, 46–50 10.1038/nchembio.1976 [DOI] [PubMed] [Google Scholar]
- 24.Bradford M.M. (1976) A rapid and sensitive method for the quantitation of microgram quantities of protein utilizing the principle of protein-dye binding. Anal. Biochem. 72, 248–254 10.1016/0003-2697(76)90527-3 [DOI] [PubMed] [Google Scholar]
- 25.Brooke E.J., Evans R.M., Islam S.T.A., Roberts G.M., Wehlin S.A.M., Carr S.B. et al. (2017) Importance of the active site ‘Canopy’ residues in an O2-tolerant [NiFe]-hydrogenase. Biochemistry 56, 132–142 10.1021/acs.biochem.6b00868 [DOI] [PubMed] [Google Scholar]
- 26.Bard A.J. and Faulkner L.R. (2001) Electrochemical Methods: Fundamentals and Applications, 2nd edn John Wiley & Sons, Inc. [Google Scholar]
- 27.Cammack R., Fernandez V.M. and Hatchikian E.C. (1994) Nickel iron hydrogenase. Methods Enzymol. 243, 43–68 10.1016/0076-6879(94)43007-1 [DOI] [PubMed] [Google Scholar]
- 28.Waterman D.G., Winter G., Gildea R.J., Parkhurst J.M., Brewster A.S., Sauter N.K. et al. (2016) Diffraction-geometry refinement in the DIALS framework. Acta Crystallogr. D Struct. Biol. 72, 558–575 10.1107/S2059798316002187 [DOI] [PMC free article] [PubMed] [Google Scholar]
- 29.Evans P.R. and Murshudov G.N. (2013) How good are my data and what is the resolution? Acta Crystallogr. D Biol. Crystallogr. 69, 1204–1214 10.1107/S0907444913000061 [DOI] [PMC free article] [PubMed] [Google Scholar]
- 30.McCoy A.J., Grosse-Kunstleve R.W., Adams P.D., Winn M.D., Storoni L.C. and Read R.J. (2007) Phaser crystallographic software. J. Appl. Crystallogr. 40, 658–674 10.1107/S0021889807021206 [DOI] [PMC free article] [PubMed] [Google Scholar]
- 31.Emsley P., Lohkamp B., Scott W.G. and Cowtan K. (2010) Features and development of Coot. Acta Crystallogr. D Biol. Crystallogr. 66, 486–501 10.1107/S0907444910007493 [DOI] [PMC free article] [PubMed] [Google Scholar]
- 32.Murshudov G.N., Skubák P., Lebedev A.A., Pannu N.S., Steiner R.A., Nicholls R.A. et al. (2011) REFMAC5 for the refinement of macromolecular crystal structures. Acta Crystallogr. D Biol. Crystallogr. 67, 355–367 10.1107/S0907444911001314 [DOI] [PMC free article] [PubMed] [Google Scholar]
- 33.Cowtan K. (2006) The Buccaneer software for automated model building. 1. Tracing protein chains. Acta Crystallogr. D Biol. Crystallogr. 62, 1002–1011 10.1107/S0907444906022116 [DOI] [PubMed] [Google Scholar]
- 34.Kabasch W. (1976) A solution for the best rotation to relate two sets of vectors. Acta Crystallogr. 32, 922–923 10.1107/S0567739476001873 [DOI] [Google Scholar]
- 35.Krissinel E. and Henrick K. (2007) Inference of macromolecular assemblies from crystalline state. J. Mol. Biol. 372, 774–797 10.1016/j.jmb.2007.05.022 [DOI] [PubMed] [Google Scholar]
- 36.Dubini A., Pye R.L., Jack R.L., Palmer T. and Sargent F. (2002) How bacteria get energy from hydrogen: a genetic analysis of periplasmic hydrogen oxidation in Escherichia coli. Int. J. Hydrogen Energy 27, 1413–1420 10.1016/S0360-3199(02)00112-X [DOI] [Google Scholar]
- 37.Sawers R.G., Ballantine S.P. and Boxer D.H. (1985) Differential expression of hydrogenase isoenzymes in Escherichia coli K-12 : evidence for a third isoenzyme. J. Bacteriol. 164, 1324–1331 PMID: [DOI] [PMC free article] [PubMed] [Google Scholar]
- 38.Kuchenreuther J.M., Grady-Smith C.S., Bingham A.S., George S.J., Cramer S.P. and Swartz J.R. (2010) High-yield expression of heterologous [FeFe] hydrogenases in Escherichia coli. PLoS ONE 5, e15491 10.1371/journal.pone.0015491 [DOI] [PMC free article] [PubMed] [Google Scholar]
- 39.Armstrong F.A., Evans R.M., Hexter S.V., Murphy B.J., Roessler M.M. and Wulff P. (2016) Guiding principles of hydrogenase catalysis instigated and clarified by protein film electrochemistry. Acc. Chem. Res. 49, 884–892 10.1021/acs.accounts.6b00027 [DOI] [PubMed] [Google Scholar]
- 40.Vincent K.A., Parkin A. and Armstrong F.A. (2007) Investigating and exploiting the electrocatalytic properties of hydrogenases. Chem. Rev. 107, 4366–4413 10.1021/cr050191u [DOI] [PubMed] [Google Scholar]
- 41.Armstrong F.A., Belsey N.A., Cracknell J.A., Goldet G., Parkin A., Reisner E. et al. (2009) Dynamic electrochemical investigations of hydrogen oxidation and production by enzymes and implications for future technology. Chem. Soc. Rev. 38, 36–51 10.1039/B801144N [DOI] [PubMed] [Google Scholar]
- 42.Léger C. and Bertrand P. (2008) Direct electrochemistry of redox enzymes as a tool for mechanistic studies. Chem. Rev. 108, 2379–2438 10.1021/cr0680742 [DOI] [PubMed] [Google Scholar]
- 43.Roessler M.M. (2012) EPR Investigations of Iron-Sulfur Cluster Relays in Enzymes. Dep. Inorg. Chem., University of Oxford [Google Scholar]
- 44.Volbeda A., Amara P., Darnault C., Mouesca J.-M., Parkin A., Roessler M.M. et al. (2012) X-ray crystallographic and computational studies of the O2-tolerant [NiFe]-hydrogenase 1 from Escherichia coli. Proc. Natl Acad. Sci. U.S.A. 109, 5305–5310 10.1073/pnas.1119806109 [DOI] [PMC free article] [PubMed] [Google Scholar]
- 45.Fritsch J., Scheerer P., Frielingsdorf S., Kroschinsky S., Friedrich B., Lenz O. et al. (2011) The crystal structure of an oxygen-tolerant hydrogenase uncovers a novel iron-sulphur centre. Nature 479, 249–252 10.1038/nature10505 [DOI] [PubMed] [Google Scholar]
- 46.Shomura Y., Yoon K.-S., Nishihara H. and Higuchi Y. (2011) Structural basis for a [4Fe-3S] cluster in the oxygen-tolerant membrane-bound [NiFe]-hydrogenase. Nature 479, 253–256 10.1038/nature10504 [DOI] [PubMed] [Google Scholar]
- 47.Wulff P., Thomas C., Sargent F. and Armstrong F.A. (2016) How the oxygen tolerance of a [NiFe]-hydrogenase depends on quaternary structure. J. Biol. Inorg. Chem. 21, 121–134 10.1007/s00775-015-1327-6 [DOI] [PMC free article] [PubMed] [Google Scholar]
- 48.Schäfer C., Bommer M., Hennig S.E., Jeoung J.-H., Dobbek H. and Lenz O. (2016) Structure of an actinobacterial-type [NiFe]-hydrogenase reveals insight into O2-tolerant H2 oxidation. Structure 24, 285–292 10.1016/j.str.2015.11.010 [DOI] [PubMed] [Google Scholar]
- 49.Holm L. and Rosenström P. (2010) Dali server: conservation mapping in 3D. Nucleic Acids Res . 38(Web Server issue), W545–W549 10.1093/nar/gkq366 [DOI] [PMC free article] [PubMed] [Google Scholar]
- 50.Dementin S., Burlat B., De Lacey A.L., Pardo A., Adryanczyk-Perrier G., Guigliarelli B. et al. (2004) A glutamate is the essential proton transfer gate during the catalytic cycle of the [NiFe] hydrogenase. J. Biol. Chem. 279, 10508–10513 10.1074/jbc.M312716200 [DOI] [PubMed] [Google Scholar]
- 51.Ogata H., Nishikawa K. and Lubitz W. (2015) Hydrogens detected by subatomic resolution protein crystallography in a [NiFe] hydrogenase. Nature 520, 571–574 10.1038/nature14110 [DOI] [PubMed] [Google Scholar]
- 52.Dubini A. and Sargent F. (2003) Assembly of Tat-dependent [NiFe] hydrogenases: identification of precursor-binding accessory proteins. FEBS Lett. 549, 141–146 10.1016/S0014-5793(03)00802-0 [DOI] [PubMed] [Google Scholar]
- 53.Higuchi Y., Yagi T. and Yasuoka N. (1997) Unusual ligand structure in Ni–Fe active center and an additional Mg site in hydrogenase revealed by high resolution X-ray structure analysis. Structure 5, 1671–1680 10.1016/S0969-2126(97)00313-4 [DOI] [PubMed] [Google Scholar]
- 54.Page C.C., Moser C.C., Chen X. and Dutton P.L. (1999) Natural engineering principles of electron tunnelling in biological oxidation-reduction. Nature 402, 47–52 10.1038/46972 [DOI] [PubMed] [Google Scholar]
- 55.Ogata H., Kellers P. and Lubitz W. (2010) The crystal structure of the [NiFe] hydrogenase from the photosynthetic bacterium Allochromatium vinosum: characterization of the oxidized enzyme (Ni-A state). J. Mol. Biol. 402, 428–444 10.1016/j.jmb.2010.07.041 [DOI] [PubMed] [Google Scholar]
- 56.Matias P.M., Soares C.M., Saraiva L.M., Coelho R., Morais J., Le Gall J. et al. (2001) [Nife] hydrogenase from Desulfovibrio desulfuricans ATCC 27774: gene sequencing, three-dimensional structure determination and refinement at 1.8 Å and modelling studies of its interaction with the tetrahaem cytochrome c3. J. Biol. Inorg. Chem. 6, 63–81 10.1007/s007750000167 [DOI] [PubMed] [Google Scholar]
- 57.Schiffels J., Pinkenburg O., Schelden M., Aboulnaga E.-H.A.A., Baumann M.E.M., Selmer T. et al. (2013) An innovative cloning platform enables large-scale production and maturation of an oxygen-tolerant [NiFe]-hydrogenase from cupriavidus necator in Escherichia coli. PLoS ONE 8, e68812 10.1371/journal.pone.0068812 [DOI] [PMC free article] [PubMed] [Google Scholar]
- 58.Pinske C., Krüger S., Soboh B., Ihling C., Kuhns M., Braussemann M. et al. (2011) Efficient electron transfer from hydrogen to benzyl viologen by the [NiFe]-hydrogenases of Escherichia coli is dependent on the coexpression of the iron–sulfur cluster-containing small subunit. Arch. Microbiol. 193, 893–903 10.1007/s00203-011-0726-5 [DOI] [PubMed] [Google Scholar]
- 59.Lukey M.J., Roessler M.M., Parkin A., Evans R.M., Davies R.A., Lenz O. et al. (2011) Oxygen-tolerant [NiFe]-hydrogenases: the individual and collective importance of supernumerary cysteines at the proximal Fe-S cluster. J. Am. Chem. Soc. 133, 16881–16892 10.1021/ja205393w [DOI] [PubMed] [Google Scholar]
- 60.Evans R.M., Parkin A., Roessler M.M., Murphy B.J., Adamson H., Lukey M.J. et al. (2013) Principles of sustained enzymatic hydrogen oxidation in the presence of oxygen — the crucial influence of high potential Fe-S clusters in the electron relay of [NiFe]-hydrogenases. J. Am. Chem. Soc. 135, 2694–2707 10.1021/ja311055d [DOI] [PubMed] [Google Scholar]
- 61.Cracknell J.A, Wait A.F., Lenz O., Friedrich B. and Armstrong F.A. (2009) A kinetic and thermodynamic understanding of O2 tolerance in [NiFe]-hydrogenases. Proc. Natl Acad. Sci. U.S.A. 106, 20681–20686 10.1073/pnas.0905959106 [DOI] [PMC free article] [PubMed] [Google Scholar]
- 62.Hexter S.V., Grey F., Happe T., Climent V. and Armstrong F.A. (2012) Electrocatalytic mechanism of reversible hydrogen cycling by enzymes and distinctions between the major classes of hydrogenases. Proc. Natl Acad. Sci. U.S.A. 109, 11516–11521 10.1073/pnas.1204770109 [DOI] [PMC free article] [PubMed] [Google Scholar]
- 63.Hexter S.V., Esterle T.F. and Armstrong F.A. (2014) A unified model for surface electrocatalysis based on observations with enzymes. Phys. Chem. Chem. Phys. 16, 11822–11833 10.1039/c3cp55230f [DOI] [PubMed] [Google Scholar]
- 64.Murphy B.J., Sargent F. and Armstrong F.A. (2014) Transforming an oxygen-tolerant [NiFe] uptake hydrogenase into a proficient, reversible hydrogen producer. Energy Environ. Sci. 7, 1426–1433 10.1039/C3EE43652G [DOI] [Google Scholar]
- 65.Adamson H., Robinson M., Wright J.J., Flanagan L.A., Walton J., Elton D. et al. (2017) Retuning the catalytic bias and overpotential of a [NiFe]-hydrogenase via a single amino acid exchange at the electron entry/exit site. J. Am. Chem. Soc. 139, 10677–10686 10.1021/jacs.7b03611 [DOI] [PMC free article] [PubMed] [Google Scholar]
- 66.Jormakka M., Yokoyama K., Yano T., Tamakoshi M., Akimoto S., Shimamura T. et al. (2008) Molecular mechanism of energy conservation in polysulfide respiration. Nat. Struct. Mol. Biol. 15, 730–737 10.1038/nsmb.1434 [DOI] [PMC free article] [PubMed] [Google Scholar]
- 67.Kelly L.A., Mezulis S., Yates C., Wass M. and Sternberg M. (2015) The Phyre2 web portal for protein modelling, prediction, and analysis. Nat. Protoc. 10, 845–858 10.1038/nprot.2015.053 [DOI] [PMC free article] [PubMed] [Google Scholar]
- 68.Jormakka M., Törnroth S., Byrne B. and Iwata S. (2002) Molecular basis of proton motive force generation: structure of formate dehydrogenase-N. Science 295, 1863–1868 10.1126/science.1068186 [DOI] [PubMed] [Google Scholar]
- 69.Bertero M.G., Rothery R.A., Palak M., Hou C., Lim D., Blasco F. et al. (2003) Insights into the respiratory electron transfer pathway from the structure of nitrate reductase A. Nat. Struct. Biol. 10, 681–687 10.1038/nsb969 [DOI] [PubMed] [Google Scholar]
- 70.Baradaran R., Berrisford J.M., Minhas G.S. and Sazanov L.A. (2013) Crystal structure of the entire respiratory complex I. Nature 494, 443–448 10.1038/nature11871 [DOI] [PMC free article] [PubMed] [Google Scholar]
- 71.Zhu J., Vinothkumar K.R. and Hirst J. (2016) Structure of mammalian respiratory complex I. Nature 536, 354–358 10.1038/nature19095 [DOI] [PMC free article] [PubMed] [Google Scholar]
- 72.Cheng V.W.T., Rothery R.A., Bertero M.G., Strynadka N.C.J. and Weiner J.H. (2005) Investigation of the environment surrounding iron−sulfur cluster 4 of Escherichia coli dimethylsulfoxide reductase. Biochemistry 44, 8068–8077 10.1021/bi050362p [DOI] [PubMed] [Google Scholar]
- 73.Nie W., Tang H., Fang Z., Chen J., Chen H. and Xiu Q. (2012) Hydrogenase: the next antibiotic target? Clin. Sci. 122, 575–580 10.1042/CS20110396 [DOI] [PubMed] [Google Scholar]
- 74.Maier R.J., Olczak A., Maier S., Soni S. and Gunn J. (2004) Respiratory hydrogen use by Salmonella enterica serovar Typhimurium is essential for virulence. Infect. Immun. 72, 6294–6299 10.1128/IAI.72.11.6294-6299.2004 [DOI] [PMC free article] [PubMed] [Google Scholar]
- 75.Chaudhuri R.R., Morgan E., Peters S.E., Pleasance S.J., Hudson D.L., Davies H.M. et al. (2013) Comprehensive assignment of roles for Salmonella typhimurium genes in intestinal colonization of food-producing animals. PLoS Genet. 9, e1003456 10.1371/journal.pgen.1003456 [DOI] [PMC free article] [PubMed] [Google Scholar]
- 76.Zbell A.L., Maier S.E. and Maier R.J. (2008) Salmonella enterica serovar typhimurium NiFe uptake-type hydrogenases are differentially expressed in vivo. Infect. Immun. 76, 4445–4454 10.1128/IAI.00741-08 [DOI] [PMC free article] [PubMed] [Google Scholar]
- 77.Lamichhane-Khadka R., Kwiatkowski A. and Maier R.J. (2010) The Hyb hydrogenase permits hydrogen-dependent respiratory growth of Salmonella enterica serovar typhimurium. MBio 1, e00284-10 10.1128/mBio.00284-10 [DOI] [PMC free article] [PubMed] [Google Scholar]
- 78.Pinske C. and Sawers R.G. (2016) Anaerobic formate and hydrogen metabolism. EcoSal Plus 7, 1–32 10.1128/ecosalplus.ESP-0011-2016 [DOI] [PMC free article] [PubMed] [Google Scholar]
- 79.Karplus P.A. and Deiderichs K. (2012) Linking crystallographic model and data quality science, 336, 1030–1033 10.1126/science.1218231 [DOI] [PMC free article] [PubMed] [Google Scholar]
Associated Data
This section collects any data citations, data availability statements, or supplementary materials included in this article.