Abstract
Viral infection often affects carbon assimilation and metabolism in host plants. To better understand the effect of cucumber mosaic virus (CMV) infection on sugar transport, carbohydrate levels and the amounts of the various sugars in the phloem sap were determined in infected melon (Cucumis melo L.) plants. Source leaves infected with CMV were characterized by high concentrations of reducing sugars and relatively low starch levels. The altered level of carbohydrates was accompanied by increased respiration and decreased net photosynthetic rates in the infected leaves. Although stachyose was the predominant sugar in phloem sap collected from petioles of control leaves, sucrose (Suc) was a major sugar in the phloem sap of infected leaves. Moreover, analyses of the newly fixed 14CO2 revealed a high proportion of radioactive Suc in the phloem sap of infected leaves 60 min post-labeling. The alteration in phloem sap sugar composition was found in source, but not old, leaves. Moreover, elevations in Suc concentration were also evident in source leaves that did not exhibit symptoms or contain detectable amounts of virus particles. The mode by which CMV infection may cause alterations in sugar transport is discussed in terms of the mechanism by which sugars are loaded into the phloem of cucurbit plants.
One of the key factors controlling carbohydrate allocation to the various plant organs is the process of phloem loading. Photosynthetic carbon assimilation and Suc synthesis take place within mesophyll cells of mature source leaves. The flow of Suc is governed by cell-to-cell transport through mesophyll cells and vascular tissues, after which Suc is loaded into the companion cell-sieve element (CC-SE) complex (van Bel, 1993). Phloem loading is defined by Geiger (1975) as “the process by which the major translocated substances are selectively and actively delivered to the sieve tubes in the source region prior to translocation.” Structural studies have suggested two possible mechanisms for phloem loading. In most agronomically important crops, the transport of Suc to the loading region is via the symplasmic pathway, followed by an apoplasmic step to transfer Suc into the CC-SE complex (van Bel, 1993; Turgeon, 1996). Cucurbits, however, are characterized by the presence of numerous plasmodesmata (PD) connecting the minor veins with the surrounding bundle sheath (BS), suggesting a symplasmic pathway along the entire route from the mesophyll to the CC-SE complex. Based on these structural observations and the fact that the main translocated sugar in cucurbits is stachyose, an alternative model for phloem loading was developed (Turgeon, 1991; Grusak et al., 1996). According to this model, Suc is synthesized in the mesophyll and then diffuses through the BS into the intermediary cells (IC, a specific type of CC in minor veins of cucurbit plants) through the abundant PD that connect the two cell types. Raffinose and stachyose are synthesized from Suc in the IC (to maintain the diffusion gradient for Suc). It is thought, however, that these sugar molecules are not able to diffuse back into the mesophyll because they are larger than the size exclusion limit (SEL) of the connecting PD and, as a result, the concentration of raffinose and stachyose rises in the phloem. This hypothesis is based on the assumption that PD between the BS and IC must be somewhat smaller (400–500 D) than is common for PD at other interfaces (800–1,000 D) in order to trap the oligosaccharides in the IC.
Numerous reports have indicated that carbohydrate metabolism in the source leaf is influenced by viral infection (Tecsi et al., 1994a, 1994b, 1996). Infected source leaves are usually characterized by reduced photosynthetic rate, a decrease in the concentration of soluble sugars, and often starch accumulation (Goodman et al., 1986; Fraser, 1987).
Detailed analysis of the host response to cucumber mosaic virus (CMV) infection was performed in cotyledons of marrow (Cucurbita pepo L.) plants (Tecsi et al., 1994a, 1994b). An increase in starch and a decrease in Suc contents were observed during the first few days after infection. However, later the infected cotyledons incorporated less of the recently fixed carbon into structural carbohydrates and more into soluble sugars (Tecsi et al., 1994b). Fine-mapping of the lesions formed by CMV in cotyledons of marrow plants was used to define the relationships between viral accumulation, starch content, and photosynthetic activity (Tecsi et al., 1994a). This study indicates that viral replication within specific cells initiates a series of metabolic events in the neighboring cells over several days, following infection. Interestingly, the alteration in photosynthetic activity and starch accumulation was not found to be a direct consequence of viral replication.
The effect of viral movement proteins (MPs) on PD function is well documented (Carrington et al., 1996; Gilbertson and Lucas, 1996). It is therefore logical to assume that alteration of plasmodesmal function in virally infected plants will affect the process of phloem loading particularly in plants that are determined to be symplasmic loaders. In this paper, we examined the effect of CMV infection on carbon assimilation and transport in melon (Cucumis melo L.) plants. We show that viral infection causes a significant increase in the proportion of Suc within the phloem. Moreover, this effect was also evident in the phloem sap of leaves in which the virus was absent, indicating that the influence over the loading of sugars into the phloem cannot be attributed to a simple interference of virus particles with this process.
RESULTS
CMV Infection Alters Assimilation Rate and Carbohydrate Metabolism in Source Leaves
Typical CMV symptoms were observed 8 to 10 d post-inoculation (DPI). First symptoms were evident in the uppermost leaves, with symptoms observed in older leaves a few days later. It is important to note that in all experiments, the first (and usually even the second) leaf above the infected one did not exhibit any symptoms, even 30 DPI.
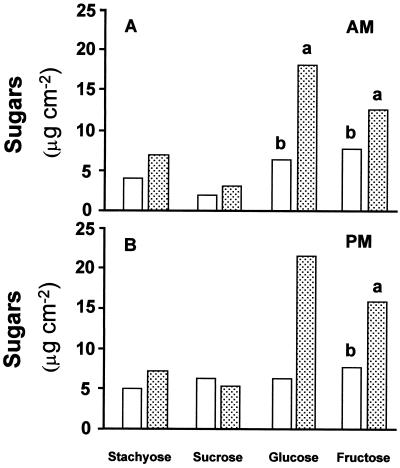
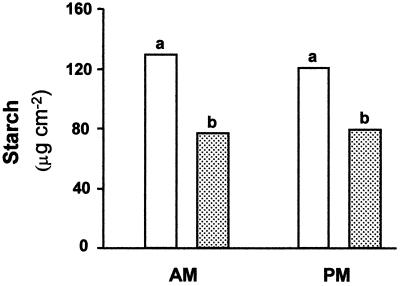
Daytime changes in carbohydrate levels were analyzed in 5-week-old plants, 2 weeks after inoculation with CMV. Although discs were taken from the leaf area between the minor veins, it was impossible to completely eliminate the presence of minor ribs in the samples. As indicated in Figure 1, levels of primary sugars (Glc and Fru) were significantly higher in CMV-infected plants than in controls. Similar results were obtained in the morning and afternoon hours. Starch levels were significantly lower in the infected plants at both sampling hours (Fig. 2).
Figure 1.
Effect of CMV infection on sugar content in source leaves (leaf 5) of melon plants. Leaf discs were taken at the beginning of the light period (A) and in the afternoon (B). White columns, Noninfected plants; dotted columns, CMV-infected plants. Data are the means of five measurements. Columns followed by different letters are statistically different at the 5% level.
Figure 2.
Effect of CMV infection on starch content (as Glc equivalents) in source leaves (leaf 5) of melon plants. Leaf discs were taken at the beginning of the light period (AM) and in the afternoon (PM). White columns, Noninfected plants; dotted columns, CMV-infected plants. Data are the means of five measurements. Columns followed by different letters are statistically different at the 5% level.
Analysis of photosynthetic activity in leaf 5 (exhibiting typical mosaic symptoms) indicated no differences in gross photosynthesis between infected and control plants (Table I). However, the values of respiration rate for the infected leaves were almost twice than those for the control plants, resulting in a significant CMV-imposed reduction in net photosynthesis with values close to zero in the infected leaves (Table I).
Table I.
Photosynthesis (Pn) and respiration rates of control and CMV-infected melon plants
| Plant | Gross Pn | Respiration | Net Pn |
|---|---|---|---|
| μmol CO2 m−2 s−1 | |||
| Control | 7.8a | 3.6b | 4.2a |
| Infected | 6.9a | 6.7a | 0.2b |
Plants were grown in a temperature-controlled growth chamber with an average photon flux density of 250 μmol m−2 s−1 at the level of the measured leaf (no. 5). Measurements were performed 2 weeks post-inoculation. Values followed by the same letter within a column are not statistically different at the 5% level.
Effect of CMV Infection on Phloem Sap Sugar Composition
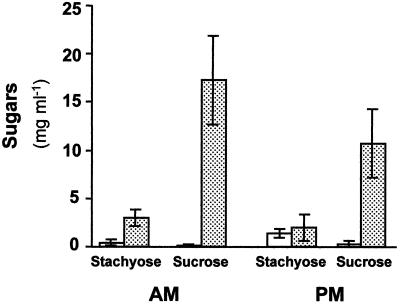
Phloem sap was collected from the petiole of leaf 5 before the beginning of the light period and after 8 h of the photoperiod. Stachyose was found to be the major sugar present in the phloem sap of healthy plants (Fig. 3). Only low levels of Suc were detected in these petioles, about 20% to 25% of the stachyose levels. A significant increase in the concentration of Suc in the phloem sap was evident in petioles of CMV-infected plants. Both at the beginning of the light period and in the afternoon, Suc concentration was about 6-fold that of stachyose. The Suc to stachyose ratio in the sap collected from infected plants was about 20 times higher than that of controls.
Figure 3.
Effect of CMV infection on sugar content of phloem sap collected from petioles of melon source leaves. Sap was collected at the beginning of the light period (AM) and in the afternoon (PM). White columns, Noninfected plants; dotted columns, CMV-infected plants. Data are the means of five measurements (±se).
To further explore the effect of CMV infection on phloem sap composition, a specific experiment was designed in which cotyledons were infected with CMV just after expansion (to ensure infection of all the true leaves). In this particular experiment, phloem sap was collected from young-mature and old leaves 5 weeks after inoculation when all plants had nine to 10 leaves. The selected old leaves were the oldest in each plant (leaf 1) and the young-mature ones were leaves 7 and 8. No significant differences were observed in stachyose or raffinose levels of phloem sap collected from young versus old petioles (Table II). All sugars were more concentrated (though not statistically significant) in the phloem sap of infected versus control leaves. However again, the most pronounced effect of CMV infection was on the level of Suc, which was over 10 times higher in sap collected from young infected petioles, relative to their respective controls. Interestingly, the rise in Suc concentration due to CMV infection was relatively small in petioles of old leaves, with no significant differences between the infected and control plants.
Table II.
Sugar content in the early afternoon (2 pm) in the phloem sap of control and CMV-infected melon plants
| Leaf No. | Stachyose | Raffinose | Suc |
|---|---|---|---|
| mg mL−1 | |||
| Leaves 7 and 8 | |||
| Infected | 7.5a | 1.7a | 4.4a |
| Control | 4.0a | 0.9a | 0.4b |
| Leaf 1 | |||
| Infected | 6.3a | 2.4a | 1.1a |
| Control | 3.8a | 1.4a | 0.4a |
Plants were grown in a growth chamber (25°C/18°C day/night) with a 12-h photoperiod. Sap was collected from petioles of young-mature (nos. 7 and 8) and old (no. 1) leaves 5 weeks after the inoculation of cotyledons. Five plants were used for each treatment. Values followed by the same letter within a column are not statistically different at the 5% level.
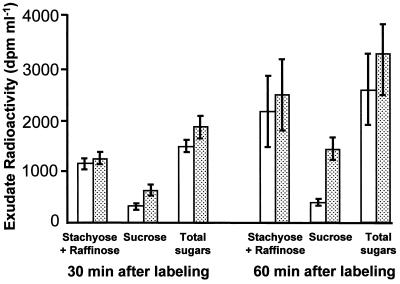
A pulse-labeling experiment was performed as an alternative approach to verifying the effect of CMV infection on phloem-sugars composition. This experiment was conducted in a temperature-controlled greenhouse under natural irradiation regimes. Net photosynthetic rate under these conditions was 14.8 μmol CO2 m−2 s−1 for the control plants, significantly higher than the value obtained for the CMV-infected plants (7.7 μmol CO2 m−2 s−1). Phloem sap was collected from petioles of the labeled leaves 30 and 60 min after labeling and the radioactivity of each sugar was determined. As indicated in Figure 4 radioactivity level of phloem sugars nearly doubled from 30 to 60 min post-labeling. In control plants this increase was solely due to the increase in the radioactivity of stachyose and raffinose, while the radioactivity of Suc remained constant at a low level. However, in CMV-infected leaves, the elevated radioactivity of the phloem sugars was made up of an increase in the radioactivity of stachyose plus raffinose and a significant increase (more than double) in the radioactivity of Suc. These results indicated alterations in the process of newly fixed carbon metabolism and transport in CMV-infected leaves.
Figure 4.
14C sugars fractionated from phloem sap of melon source leaves (leaf 5). Sap was collected 30 and 60 min after labeling the leaf with 14CO2. White columns, Noninfected plants; dotted columns, CMV-infected plants. Data are the means of three measurements (±se).
The Effect of CMV Infection on Phloem Sap Sugar Composition Is Independent of the Presence of Virus Particles
Long-distance movement of virus particles is known to occur via the phloem, following the stream of sugar transport (Maule, 1991; Gilbertson and Lucas, 1996). The nonsignificant effect of CMV on phloem Suc concentration in old leaves (Table II) could have been due to the fact that these specific leaves were too old to be sources. However, it is also possible that they did not contain high levels of virus particles.
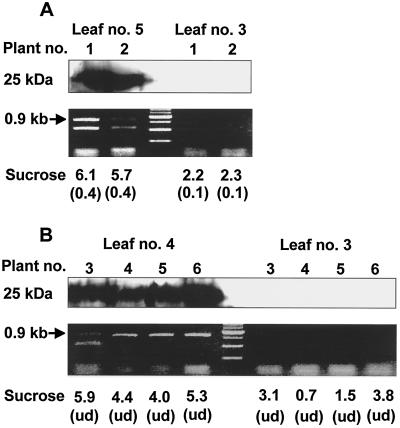
Further study was aimed at exploring the relationship between progression of the systemic infection and alteration in Suc levels in the phloem sap of different leaves. Phloem sap was collected from different leaves at different times post-infection. First symptoms were observed in leaves 5 and 6 at 10 DPI, at which stage the plants had six true leaves. As indicated in Figure 5A, Suc concentration in the phloem sap collected from petioles of leaf 5 was 15 times higher than values determined in control leaves. However, a significant elevation in Suc concentration was also evident in leaf 3, which did not show any typical mosaic symptoms. Protein, as well as RNA analyses, were employed to verify the presence of virus particles in the latter leaves and according to both analyses, no virus particles were detected. A similar phenomenon was observed when leaves were sampled 16 DPI (Fig. 5B). On this date, the plants had eight true leaves and symptoms were observed in all leaves except for leaves 2 and 3 (located above the infected leaf). Again, a significant increase in Suc concentration was found in petioles of leaf 3, although virus particles could not be detected by either western blot or reverse transcriptase-PCR.
Figure 5.
Presence or absence of CMV particles in different leaves of CMV-infected melon plants. Presence of CMV in the various leaves was determined using western blot of leaf extracts probed with antiserum raised against purified CMV-CP, or by analysis of CMV-MP RNA using reverse transcriptase-PCR. Leaves 3 and 5 from two representative plants (1 and 2) were sampled 10 DPI (A) and leaves 3 and 4 from other representative plants (3–6) were sampled 16 DPI (B). Values indicate the concentration of Suc (mg mL−1) in the phloem sap of petioles collected from the respective leaves. Data in parentheses indicate the Suc concentration (mg mL−1) in phloem sap of respective control petioles collected from noninfected plants. ud, Undetected.
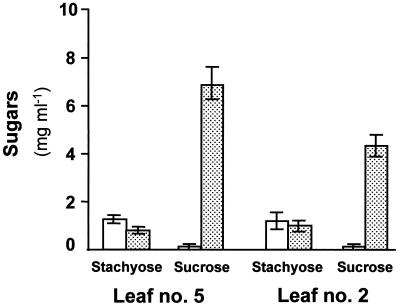
To further investigate whether CMV infection causes other functional alterations in the noninfected leaf (no. 2), photosynthetic rate and leaf sugar content were determined in an additional experiment. As indicated in Table III, similar photosynthetic and respiration rates were obtained for leaves of infected and noninfected plants. It is important to note that the differences in the rate of net photosynthesis and respiration in leaf 5 (exhibiting typical symptoms) from the same set of plants were similar to those presented in Table II. Moreover, the levels of soluble sugars extracted from infected and control leaves (no. 2) were almost identical (Table IV). Nevertheless, once again, phloem collected from petioles of leaves from the infected plants contained significantly higher levels of Suc (Fig. 6). The Suc to stachyose ratio in the sap collected from the infected plant (leaf 2) was about 40 times higher than in its respective control.
Table III.
Photosynthesis (Pn) and respiration rates of control and CMV-infected melon plants
| Plant | Gross Pn | Respiration | Net Pn |
|---|---|---|---|
| μmol CO2 m−2 s−1 | |||
| Control | 4.6a | 1.7a | 2.9a |
| Infected | 4.0a | 1.9a | 2.1a |
Plants were grown in a temperature-controlled growth chamber with an average photon flux density of 200 μmol m−2 s−1 at the level of the measured (no. 2) leaf. Measured leaves from both control and CMV-infected plants did not exhibit any symptoms. Measurements were performed 2 weeks post-inoculation. Values followed by the same letter within a column are not statistically different at the 5% level.
Table IV.
Sugar content in leaves of different ages from CMV- infected and control melon plants
| Leaf No. | Suc | Glc | Fruc |
|---|---|---|---|
| μg cm−2 | |||
| Leaf 5 | |||
| Infected | 9.0a | 56.5a | 28.8a |
| Control | 5.5a | 15.8b | 9.3b |
| Leaf 2 | |||
| Infected | 4.3a | 15.9a | 12.3a |
| Control | 4.6a | 13.4a | 9.0a |
Samples were collected in the early afternoon (2 pm) from young fully expanded (no. 5) and fully mature (no. 2) leaves 2 weeks after inoculation. Plants were grown in a temperature-controlled growth chamber (25°C/18°C day/night) with a 12-h photoperiod. Five plants were used for each treatment. Values followed by the same letter within a column are not statistically different at the 5% level.
Figure 6.
Effect of CMV infection on sugar content of phloem sap collected from petioles of melon leaves. Sap was collected 2 weeks after inoculation from leaf 5 displaying typical symptoms and leaf 2, which was symptomless. White columns, Noninfected plants; dotted columns, CMV-infected plants. Data are the means of five measurements (±se).
DISCUSSION
Systemic viral infection often causes mosaic symptoms and/or necrotic lesions, indicative of structural changes in the chloroplasts, altered carbon metabolism, and the accumulation of starch grains (Goodman et al., 1986; Fraser, 1987). A gradual decline in net photosynthesis has been observed in cotyledons of marrow plants during the first week after infection with CMV; however, the most pronounced effect observed in the infected cotyledons is a sharp increase in respiration rate (Tecsi et al., 1994b). A significant increase in respiration rate after CMV infection was observed in our study as well (Table I). It is interesting that the gross photosynthetic rate, 2 weeks post infection, was similar for control and infected source leaves. Significantly higher net photosynthetic rate in control as compared with CMV-infected leaves was observed under natural sunlight in greenhouse grown plants. Nevertheless, the differences in gross photosynthetic rate were only about 20%. These results indicate that, despite the severe mosaic symptoms observed at this stage of plant development, the potential photosynthetic activity of CMV-infected leaves is relatively high.
CMV infection significantly altered carbohydrate metabolism. A sharp increase in the concentrations of Fru and particularly Glc was observed in the infected leaves. These changes are associated with a decrease in leaf starch content (Figs. 1 and 2). An earlier study indicated an increase in reducing sugars and a reduction in starch content due to CMV-induced higher starch hydrolase and lower ADP-Glc pyrophosphorylase activities (Tecsi et al., 1994b). The inhibition of starch accumulation and/or starch degradation is probably due to the increased demand for soluble sugars (mainly Glc) required to maintain the high respiration rate.
Perhaps the most important effect of CMV infection observed in the present study was the striking alteration in sugar composition within the phloem sap. Similar to data presented in previous reports (Madore, 1991; Mitchell et al., 1992), stachyose was the predominant sugar in the phloem sap of control plants (Fig. 3). As indicated in Figures 3 and 6, CMV infection caused only small changes in the phloem sap stachyose concentration; in contrast, Suc concentration increased dramatically. The outcome of these changes was a 15- to 40-fold increase in the Suc to stachyose ratio. Note that the concentration of sugars in the phloem sap collected from cut petioles may not be identical to their concentration in vivo. Dilution of the collected sap by solutes and water from the cut surface and xylem elements could reduce the resultant values. None of our samples contained even traces of monosaccharides, which suggests that the collected solute did not contain detectable contamination from neighboring cells. Nevertheless, water delivered from the xylem elements may have produced lower concentration values. However, even if the collected samples were diluted with water, it is important to note that stachyose concentrations were similar for CMV-infected and control leaves, emphasizing the dramatic changes in Suc concentration.
The increase in Suc level might be explained by the initiation of stachyose hydrolysis following CMV infection. If this were the case, however, there would be a parallel increase in Gal concentration in the phloem sap. The fact that the alteration in Suc concentration was not accompanied by detectable changes in other sugars concentration indicates that CMV infection affects the localization of Suc rather than its metabolism. An analysis of sugar levels in minor veins using a microdissection procedure has indicated that IC may contain considerable amounts of Suc; however, Haritatos et al. (1996) suggested that this Suc is localized in the vacuoles. One could argue that CMV infection may have caused a perturbation in the sugars' localization within the phloem cells. As Suc can easily diffuse from the IC into the SE, an increase in IC cytosolic Suc concentration would result in a high concentration of Suc within the phloem sap as well. Assuming that in melon plants, transport of Suc from the mesophyll to the IC-SE complex is via diffusion through PD, such an increase in IC Suc concentration would likely result in Suc leakage back toward the mesophyll, resulting in the inhibition (or even cessation) of phloem loading. The level of total radioactivity in source leaves appeared to decline more rapidly in CMV-infected versus control plants (data not shown). This result, together with the fact that the increased radioactivity in phloem total sugar was similar (about 2-fold) in infected and control plants (Fig. 4), indicated that the export rate of newly fixed carbon is not inhibited in CMV-infected plants.
An alternative explanation for the CMV-induced alteration in phloem sap Suc concentration may relate to the functioning of the CMV-MP. A significant increase in plasmodesmal SEL has been observed in transgenic tobacco plants expressing the CMV 3a protein (Vaquero et al., 1994; Ding et al., 1995), indicating that this is the CMV-MP. Based on the model for phloem loading of sugars in cucurbit plants (Turgeon, 1991; Grusak et al., 1996), an alteration in the SEL of PD at the BS-IC interface could result in diffusion of stachyose from the IC to the BS, thereby impairing the process of phloem loading and sugar transport. However, even if CMV-MP or another viral protein altered plasmodesmal functioning in infected melon plants, the observed increase in Suc concentration within the phloem sap cannot be simply attributed to such changes. On the contrary, an increase in the plasmodesmal SEL would destroy the Suc trap in the IC, as described by Grusak et al. (1996), and inhibit Suc traffic into the minor veins. Hence, the basis for the change in Suc concentration may lie in an alteration of the cellular controls that regulate phloem loading via the symplasmic and apoplasmic routes. Recall that, in symplasmic loaders, apoplasmic and symplasmic loading mechanisms may function concurrently in the same plant (van Bel, 1993; Grusak et al., 1996). This hypothesis is founded on structural considerations; e.g. the abaxial phloem of the smallest minor vein is comprised of only IC and SE, whereas in the larger minor veins, ordinary CCs are also present. The ICs have been suggested to load Suc symplasmically and convert it to raffinose sugars, while the ordinary CCs load Suc via an apoplasmic step (Schmitz et al., 1987; Turgeon et al., 1993). In addition, a transcript highly homologous to a Suc transporter (SUT1) was recently identified in the phloem sap of Cucurbita maxima (Ruiz-Medrano et al., 1999). Clearly, manipulation of plasmodesmal function by viral infection in the source leaves of plants that are defined as symplasmic loaders could have a dramatic effect on plant development—even a lethal one. It is logical to assume that in such a case, the plant response would include an activation of defense mechanisms to inhibit this effect, and such a mechanism could include a shift from symplasmic to apoplasmic loading. The outcome of such a shift would be increased Suc level in the phloem. The rapid elevation of radioactive Suc within the phloem of CMV-infected leaves (Fig. 4) further supports the assumption that a high Suc level in the phloem of these plants is associated with an alteration in the process of phloem loading. In this respect it is interesting to note that other stress responses, such as low temperature and abscisic acid treatment, also induced an increase in melon phloem sap Suc concentration (Mitchell and Madore, 1992). Moreover, the activation of defense mechanisms includes a process mediated by information perceived by distant tissues. In such a case the information could also be perceived by leaves in which virus particles are still absent, as seems to have occurred here with the observed Suc level in the phloem sap of noninfected leaves (Figs. 5 and 6). Further studies are aimed at elucidating the basis for the CMV-induced change in sugar levels in the phloem of infected melon plants.
MATERIALS AND METHODS
Plant Material
Melon plants (Cucumis melo L. cv Hale's Best Jumbo) were grown in a coconut mixture in 15-cm-diameter plastic pots. Two-week-old seedlings were transferred to a temperature-controlled chamber (model F15, Conviron, Asheville, NC) with a 12-h photoperiod and 25°C/18°C day/night temperature. Photon flux density was 200 to 300 μmol m−2 s−1 at canopy level. Auxiliary buds were removed as they appeared, such that all plants had one main stem. In some experiments, the seedlings were transferred to an insect-free, temperature controlled greenhouse (approximately 25°C/18°C day/night temperatures, respectively), with a natural sunlight (midday average photon flux density of 1,200–1,500 μmol m−1 s−1).
CMV Inoculation
When the plants were 3 weeks old and had four developed true leaves above laminar length of 5 cm, the oldest leaf (the first above the cotyledons) was inoculated with CMV (strain Fny) using carborundum as an abrasive and 500 μL of inoculum containing 40 μg of virus. Control plants were subjected to a similar inoculation procedure with water.
To verify the presence of virus particles in specific leaves, leaf discs were collected for either protein or RNA analyses. Proteins were extracted from 0.5 g fresh weight of tissue using denaturing buffer (75 mm Tris [Tris(hydroxymethyl)-aminomethane], pH 6.8, 9 m urea, 4.5% [w/v] SDS, and 7.5% [v/v] mercaptoethanol) at a 1:2 ratio. Proteins were then separated by 12% (w/v) SDS-PAGE and blotted onto nitrocellulose paper (Towbin et al., 1979). To detect the CMV-coat protein, we used rabbit polyclonal antibodies (kindly provided by Dr. Garcia-Luque, CIB Consejo Superior de Investigaciones Científicas, Madrid) diluted 1:2,000. Goat anti-rabbit horseradish peroxidase conjugate was used as a second antibody, and detection was performed with an ECL detection kit (Amersham, Buckinghamshire, UK).
Viral RNA was detected by reverse transcriptase-PCR analysis. Total RNA was extracted from leaf samples (200 mg) with Tri-Reagent (Molecular Research, Cincinnati) following the manufacturer's instructions. cDNA was prepared with specific antisense primer based on the CMV-MP 3′ primer (5′-GACCGTTAACCACCTGCG-3′) followed by PCR analysis with the addition of a CMV-MP 5′ primer (5′-CCCGAGGCATGGCTTTCC-3′). The PCR product was detected on a 1.2% (w/v) agarose gel stained with ethidium bromide.
Gas-Exchange Measurements
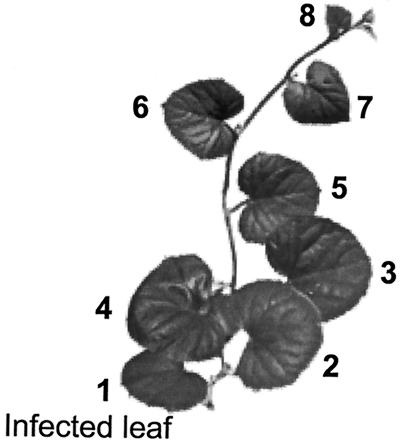
Net photosynthesis (measured as CO2 uptake) was determined using a closed, portable, infrared gas-exchange system (LI 6200, LI-COR, Lincoln, NE) as described by Olesinski et al. (1996). All analyses (unless otherwise indicated) were carried out 2 weeks post-inoculation at the stage when plants had eight true leaves (Fig. 7). Leaf 1 (the infected leaf) was defined as the oldest one, and leaf 8 the youngest, i.e. the last to reach a length of 5 cm. Measurements were carried out on the youngest fully expanded leaf (no. 5) at noon with an initial CO2 concentration in the chamber of 350 ± 10 μL L−1; a 30-s measurement was begun immediately after a reduction in CO2 concentration was detected. For respiration analyses, the chamber was covered with black cloth for 2 min and measurements were begun immediately after an increase in CO2 concentration was detected. Gross photosynthesis was calculated as the sum of the net photosynthesis and respiration rates.
Figure 7.
Representation of a melon plant in which photosynthetic rate, carbohydrate levels, and export of photoassimilates were studied. Five-week-old plants (2 weeks post-inoculation) were used in most experiments. The inoculated leaf was the oldest one (leaf 1) and the youngest fully expanded leaf, 5, was sampled in most experiments. Leaf 2 (and usually also 3) did not exhibit any symptoms.
Starch and Sugar Determination
Leaf carbohydrate content was determined as described earlier (Olesinski et al., 1996). Briefly, four leaf discs (1 cm2 each) were sampled between the small ribs of each leaf. Soluble sugars were extracted in 80% (w/v) ethanol, and after evaporating the supernatant, sugars were redissolved in water and filtered through a 0.45-μm membrane HPLC filter (Whatman, Maidstone, UK). Sugars were separated in an analytical HPLC system (Pump System 320, Kontron, Switzerland) fitted with a Sugar-Pak I column (6.5 × 300 mm, Waters, Milford, MA) using an refractive-index detector (LDC Analytical, Riviera Beach, FL). Starch content was determined in the ethanol-water-extracted leaf discs following starch conversion by amyloglucosidase (Sigma Chemical, St. Louis). Starch content as Glc equivalents was determined using the Sigma (HK) quantitative Glc determination kit.
Phloem exudate (sap) was collected from cut petioles using microcapillary pipettes calibrated to 20 μL. The first drops were blotted for several seconds onto filter paper and the phloem sap exudate thereafter (5–10 μL) was immediately transferred to an Eppendorf tube containing 300 μL of ice-cold 50 μg mL−1 EDTA in HPLC-grade water. The solution was than centrifuged at 4°C, 10,000 rpm for 5 min and stored at −20°C. Sugars in the sap were determined using the above described HPLC system.
Radioactive Labeling with 14CO2
Pulse-chase experiments were conducted according to the procedure described by Olesinski et al. (1995). In short, an attached leaf was sealed into a 4-L Plexiglas chamber where it was held between two layers of nylon monofilament. 14CO2 was released into the chamber to give an initial specific activity of about 2 × 10⁵ Bq mg−1 carbon. After 15 chase min, the leaf was released from the chamber and used for analysis of 14C-photosynthate export. Total radioactivity of each 14C-labeled leaf was monitored for 120 min using a portable Geiger-Muller tube (RAM-DA, model GM-10, Rotem, Beer-Sheva, Israel) that was placed on the adaxial surface of the leaf.
Partitioning of newly fixed carbon within phloem sap sugars was determined 30 and 60 min post-labeling. Sugars were identified and fractionated by HPLC and radioactivity of each fraction was measured in a liquid scintillation counter (Tri-Carb, model 1600 TR, Packard, Groningen, The Netherlands).
Statistical Analysis
The data are presented as the means of five replications (plants), except for the comparison between the 14C fractionated from phloem sap of various leaves (Fig. 4). The Student's t test was used to detect differences between infected and non-infected plants. All statistically significant differences were tested at the P ≤ 5% level.
Footnotes
This work was supported by the U.S.-Israel Binational Agricultural Research Development Fund (grant no. IS–2385–94C). This paper is a contribution from the Uri Kinamon Laboratory. D.S. was supported by a scholarship from the Kinamon Foundation.
LITERATURE CITED
- Carrington JC, Kasschau KD, Mahajan SK, Schaad MC. Cell-to-cell long-distance transport of viruses in plants. Plant Cell. 1996;8:1669–1681. doi: 10.1105/tpc.8.10.1669. [DOI] [PMC free article] [PubMed] [Google Scholar]
- Ding B, Li Q, Nguyen L, Palukaitis P, Lucas WJ. Cucumber mosaic virus 3a protein potentiates cell-to-cell trafficking of CMV-RNA in tobacco plants. Virology. 1995;207:345–353. doi: 10.1006/viro.1995.1093. [DOI] [PubMed] [Google Scholar]
- Fraser RSS. Biochemistry of Virus-Infected Plants. Letchworth, Hartfordshire, UK: Research Studies Press; 1987. [Google Scholar]
- Geiger DR. Phloem loading. In: Zimmermann MH, Milburn JA, editors. Transport in Plants: 1. Phloem Transport, Encyclopedia of Plant Physiology. Berlin: Springer-Verlag; 1975. pp. 395–431. [Google Scholar]
- Gilbertson RL, Lucas WJ. How do viruses traffic on the “vascular highway”? Trends Plant Sci. 1996;1:260–267. [Google Scholar]
- Goodman RN, Kiraly Z, Wood KR. The Biochemistry and Physiology of Plant Disease. Columbia: University of Missouri Press; 1986. [Google Scholar]
- Grusak MA, Beebe DU, Turgeon R. Phloem loading. In: Zamsky E, Schaffer AA, editors. Photoassimilates Distribution in Plants and Crops: Source-Sink Relationships. New York: Marcel Dekker; 1996. pp. 209–227. [Google Scholar]
- Haritatos E, Keller F, Turgeon R. Raffinose oligosaccharide concentrations measured in individual cell and tissue types in Cucumis melo L. leaves: implications for phloem loading. Planta. 1996;198:614–622. doi: 10.1007/BF00262649. [DOI] [PubMed] [Google Scholar]
- Madore MA. Diurnal oligosaccharide export patterns in cucurbit source leaves. In: Bonnemain JL, Delrot S, Lucas WJ, Dainty J, editors. Recent Advances in Phloem Transport and Assimilate Compartmentation. Nantes, France: Ouest Editions; 1991. pp. 23–26. [Google Scholar]
- Maule AJ. Virus movement in infected plants. Crit Rev Plant Sci. 1991;9:457–473. [Google Scholar]
- Mitchell DE, Gadus MV, Madore MA. Patterns of assimilates production and translocation in muskmelon (Cucumis melo L.): I. Diurnal patterns. Plant Physiol. 1992;99:959–965. doi: 10.1104/pp.99.3.959. [DOI] [PMC free article] [PubMed] [Google Scholar]
- Mitchell DE, Madore MA. Patterns of assimilates production and translocation in muskmelon (Cucumis melo L.): II. Low temperature effects. Plant Physiol. 1992;99:966–971. doi: 10.1104/pp.99.3.966. [DOI] [PMC free article] [PubMed] [Google Scholar]
- Olesinski AA, Almon E, Navot N, Perl A, Galun E, Lucas WJ, Wolf S. Tissue-specific expression of the tobacco mosaic virus movement protein in transgenic potato plants alters plasmodesmal function and carbohydrate partitioning. Plant Physiol. 1996;111:541–550. doi: 10.1104/pp.111.2.541. [DOI] [PMC free article] [PubMed] [Google Scholar]
- Olesinski AA, Lucas WJ, Galun E, Wolf S. Pleiotropic effects of tobacco-mosaic-virus movement protein on carbon metabolism in transgenic tobacco plants. Planta. 1995;197:118–126. [Google Scholar]
- Ruiz-Medrano R, Xoconostle-Cazares B, Lucas WJ. Phloem long-distance transport of CmNACP mRNA: implications for supracellular regulation in plants. Development. 1999;126:4405–4419. doi: 10.1242/dev.126.20.4405. [DOI] [PubMed] [Google Scholar]
- Schmitz K, Cuypers B, Moll M. Pathway of assimilate transfer between mesophyll cells and minor veins in leaves of Cucumis melo L. Planta. 1987;171:19–29. doi: 10.1007/BF00395064. [DOI] [PubMed] [Google Scholar]
- Tecsi LI, Maule AJ, Smith AM, Leegood RC. Complex, localized changes in CO2 assimilation and starch content associated with the susceptible interaction between cucumber mosaic virus and a cucurbit host. Plant J. 1994a;5:837–847. [Google Scholar]
- Tecsi LI, Maule AJ, Smith AM, Leegood RC. Metabolic alterations in cotyledons of Cucurbita pepo infected by cucumber mosaic virus. J Exp Bot. 1994b;45:1541–1551. [Google Scholar]
- Tecsi LI, Maule AJ, Smith AM, Leegood RC. A spatial analysis of physiological changes associated with infection of cotyledons of marrow plants with cucumber mosaic virus. Plant Physiol. 1996;111:975–985. doi: 10.1104/pp.111.4.975. [DOI] [PMC free article] [PubMed] [Google Scholar]
- Towbin H, Staehelin T, Gordon J. Electrophoretic transfer of proteins from polyacrylamide gels to nitrocellulose sheets: procedure and some applications. Proc Natl Acad Sci USA. 1979;76:4350–4354. doi: 10.1073/pnas.76.9.4350. [DOI] [PMC free article] [PubMed] [Google Scholar]
- Turgeon R. Symplastic phloem loading and the sink-source transition in leaves: a model. In: Bonnemain JL, Delrot S, Lucas WJ, Dainty J, editors. Recent Advances in Phloem Transport and Assimilate Compartmentation. Nantes, France: Ouest Editions; 1991. pp. 18–22. [Google Scholar]
- Turgeon R. Phloem loading and plasmodesmata. Trends Plant Sci. 1996;1:418–423. [Google Scholar]
- Turgeon R, Beebe DU, Gowan E. The intermediary cell: minor-vein anatomy and raffinose oligosaccharide synthesis in the Scrophulariaceae. Planta. 1993;191:446–456. [Google Scholar]
- van Bel AJE. Strategies of phloem loading. Annu Rev Plant Physiol Plant Mol Biol. 1993;44:253–281. [Google Scholar]
- Vaquero C, Turner AP, Demangeat G, Sanz A, Serra MT, Roberts K, Garcia Luque I. The 3a protein from cucumber mosaic virus increases the gating capacity of plasmodesmata in transgenic tobacco plants. J Gen Virol. 1994;75:3193–3197. doi: 10.1099/0022-1317-75-11-3193. [DOI] [PubMed] [Google Scholar]


