Abstract
Aim:
The accuracy of a dental impression is determined by two factors: “trueness” and “precision.” The scanners used in dentistry are relatively new in market, and very few studies have compared the “precision” and “trueness” of intraoral scanner with the extraoral scanner. The aim of this study was to evaluate and compare accuracy of intraoral and extraoral digital impressions.
Materials and Methods:
Ten dentulous participants (male/female) aged 18–45 years with an asymptomatic endodontically treated mandibular first molars with adjacent teeth present were selected for this study. The prepared test tooth was measured using a digital Vernier caliper to obtain reference datasets. The tooth was then scanned using the intraoral scanner, and the extraoral scans were obtained using the casts made from the impressions. The datasets were divided into four groups and then statistically analyzed. The test tooth preparation was done, and dimples were made using a round diamond point on the bucco-occlusal, mesio-occlusal, disto-occlusal, and linguo-occlusal lines angles, and these were used to obtain reference datasets intraorally using a digital Vernier caliper. The test tooth was then scanned with the IO scanner (CS 3500, Carestream dental) thrice and also impressions were made using addition silicone impression material (3M™ ESPE) and dental casts were poured in Type IV dental stone (Kalrock-Kalabhai Karson India Pvt. Ltd., India) which were later scanned with the EO scanner (LAVA™ Scan ST Design system [3M™ ESPE]) thrice. The Datasets obtained from Intraoral and Extraoral scanner were exported to Dental Wings software and readings were obtained. Repeated measures ANOVA test was used to compare differences between the groups and independent t-test for comparison between the readings of intraoral and extraoral scanner. Least significant difference test was used for comparison between reference datasets with intraoral and extraoral scanner, respectively. A level of statistical significance of P < 0.05 was set.
Results:
The precision values ranged from 20.7 to 33.35 μm for intraoral scanner and 19.5 to 37 μm for extraoral scanner. The mean deviations for intraoral scanner were 19.6 μm mesiodistally (MD) and 16.4 μm buccolingually (BL) and 24.0 μm MD and 22.5 μm BL for extraoral scanner. The mean values of the intraoral scanner (413 μm) for trueness were closest to the actual measurements (459 μm) than the extraoral scanner (396 μm).
Conclusion:
The intraoral scanner showed higher “precision” and “trueness” values when compared with the extraoral scanner.
Keywords: Digital impression, extraoral scanner, intraoral scanner, precision, trueness
INTRODUCTION
Impression making to duplicate oral condition and tooth morphology is an integral part of Prosthetic dentistry. Making an accurate dental impression is one of the most essential and time-consuming procedures in dental practice. During this procedure, it is crucial to ensure the reproduction of the intraoral condition as accurately as possible, as errors or inaccuracies could have far-reaching consequences on the quality of final restoration.[1]
The gold standard impression technique today is the physical impression with elastomeric impression material and stock trays. The inherent problems and disadvantages of conventional impressions include improper tray selection, need for disinfection of the impression, separation of impression material from impression tray, distortion of conventional impressions before pouring, and storage of the impressions for potential remaking of the casts and dies.[2] Although these problems can be reduced by standardization of work sequence, they cannot be entirely eliminated. Digital impression making using intraoral and extraoral scanner may be an approach to improve the accuracy of dental restorations, as by their nature these processes tend to eliminate the error caused by conventional impression making and gypsum model casting.
Dr. Duret first introduced the computer-aided design/computer-aided manufacturing (CAD/CAM) concept to dentistry in 1973 in Lyon, France, in his thesis entitled “Empreinte Optique” which translates to optical impression. The concept was further developed by Dr. Mormann, a Swiss dentist, and Mr. Brandestini, who was an electrical engineer.[3] Since the introduction of the CAD/CAM technology, continuous advancements have evolved, and the indication spectrum has been widely expanded.
Digital impression making is the first step toward CAD/CAM manufacturing of the dental prosthesis. In this, the three-dimensional (3D) data of the anatomical structures are recorded using optical cameras. Digital data acquisition improves treatment planning, gives higher efficiency, facilitates data storage, reproducibility, treatment documentation, and cost and time effectiveness, and makes communication between dental office and laboratory better.
The information gathered by digital impressioning devices can be entered directly into the digital CAD/CAM production chain. Hence, both procedures, digital impressioning and conventional impression making, can be described as intraoral data acquisition. To minimize process errors deriving from impression making and model fabrication, it is only logical to transfer the scanning data of the patient and directly scan the preparations in the patients mouth.
Digital impressions can be made using two methods, directly using an intraoral scanner, which allows the clinician to directly acquire the data from the prepared abutment without the need to make conventional impressions and pour the casts, and it results in a 3D virtual model or with an extraoral laboratory scanner, where it involves scanning of the dental impression or gypsum casts to create a 3D model, and the restoration is then designed on computer with special design software and then 3D printed.
The intraoral digital impression has introduced a new class of impression technique in dentistry. CAD/CAM restorations and its increasing popularity by prosthodontists, makes digital impression making an important technique, which needs to be addressed. Both the impression techniques done using intraoral and extraoral scanners need to be accurate to deliver an accurately fitting prosthesis.
The accuracy of a dental impression is determined by two factors: “trueness” and “precision.” Trueness is defined as the comparison between a reference dataset and a test dataset. Precision is defined as a comparison between various datasets obtained from the same object using the same scanner.[2]
This study was done to evaluate and compare the intraoral scanning device and its ability to give the accurate digital impression when compared to the extraoral scanner by assessing the “precision” and “trueness.”
SUBJECTS AND METHODS
Ethical clearance was obtained from the institutional ethical committee.
Dentulous participants within the age range of 18–45 years, irrespective of sex, were selected according to the inclusion criteria. Patients with endodontically treated mandibular first molars with adjacent teeth present were selected.
The tooth was prepared following the biomechanical principles, and a round diamond point (MANI.INC [BR-46]) was used to make dimples in the center of bucco-occlusal, mesio-occlusal, disto-occlusal, and linguo-occlusal line angles to make measurements and obtain Datasets [Figures 1 and 2]. A digital Vernier caliper was used to measure the distance between the dimples intraorally, and a reference dataset was obtained in mesiodistal and buccolingual direction, respectively [Figures 3 and 4].
Figure 1.
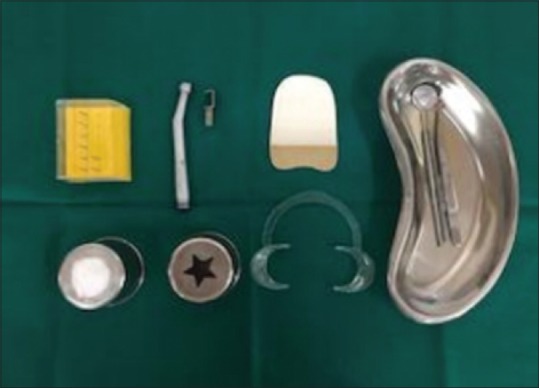
Instruments used for diagnosis and tooth preparation
Figure 2.
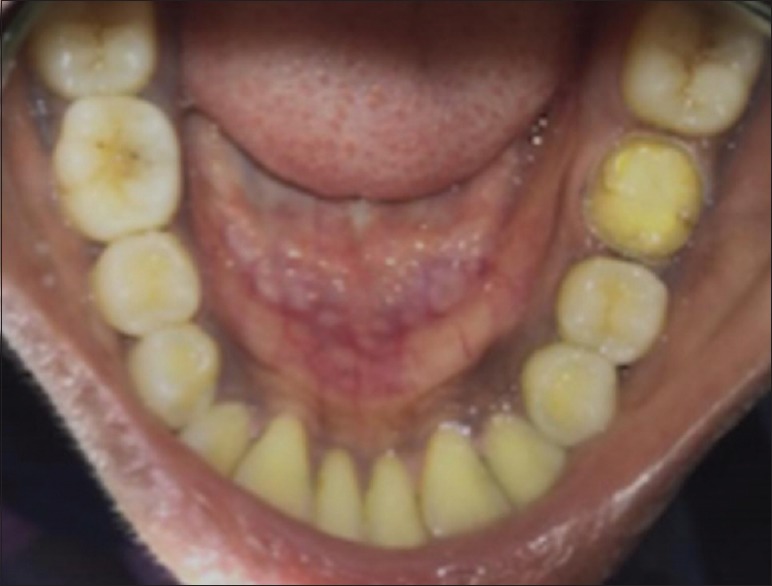
Prepared tooth 36
Figure 3.
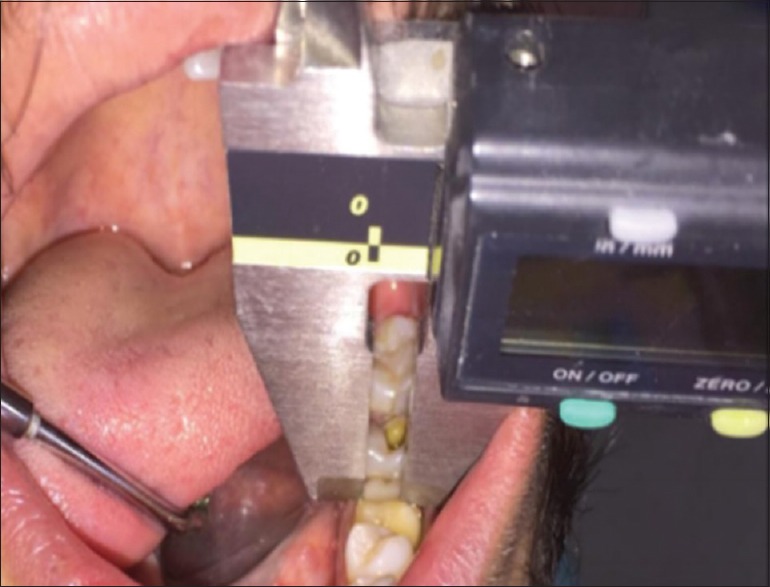
Measurement of the test tooth intraorally
Figure 4.
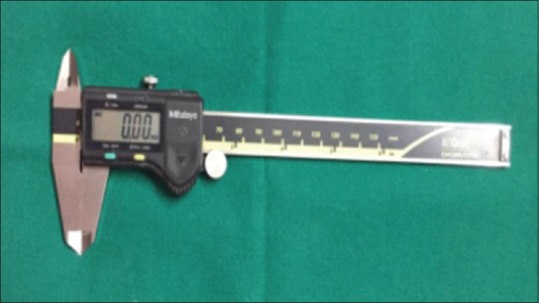
Digital Vernier Caliper
Intraoral digital impressions were made by scanning the teeth from the second molar to the second premolar using the CS 3500 (Carestream dental) intraoral scanner. The CS 3500 scanner is an open system scanner, the digital images obtained through scanning are in Standard Tessellation Language (STL) file format and can be shared and evaluated, and prosthesis can be designed using an open architecture CAD software. It does not require powder opacification of the teeth to be scanned and hence teeth are only air dried before scanning. It has a click-and-point system with light guidance which allows focusing on the acquisition of the image and creates 3D-colored images, which helps to differentiate between natural tooth margins and gingival tissues [Figures 5 and 6]. Scanning began from the occlusal surface of the second molar tooth, proceeding toward the second premolar. Each tooth was scanned from its buccal and lingual side placing the scanner at an angle of 45° to the long axis of tooth [Figure 7]. Adequate overlapping of the previous image was essential for the stitching of the entire image to take place. After scanning of the occlusal surfaces, buccal and lingual surfaces were subsequently scanned. Only partial digital impressions were made. This protocol was repeated three times by the same operator to obtain three datasets per participant.
Figure 5.
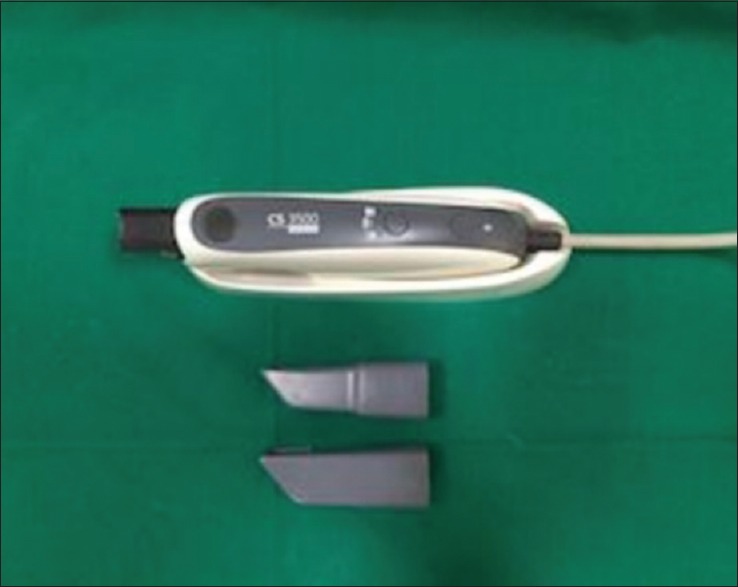
Photograph showing intraoral scanner (CS 3500) with scanning tips
Figure 6.
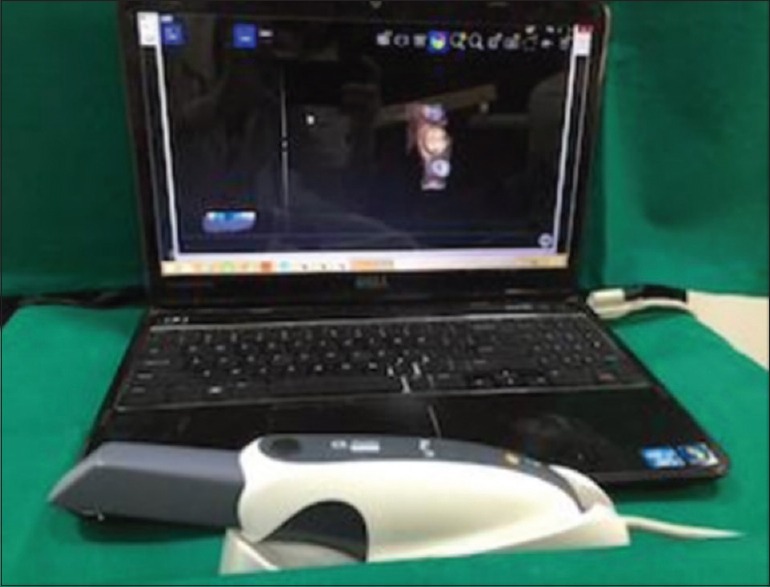
Photograph showing laptop with intraoral scanner (CS 3500) and scanner software
Figure 7.
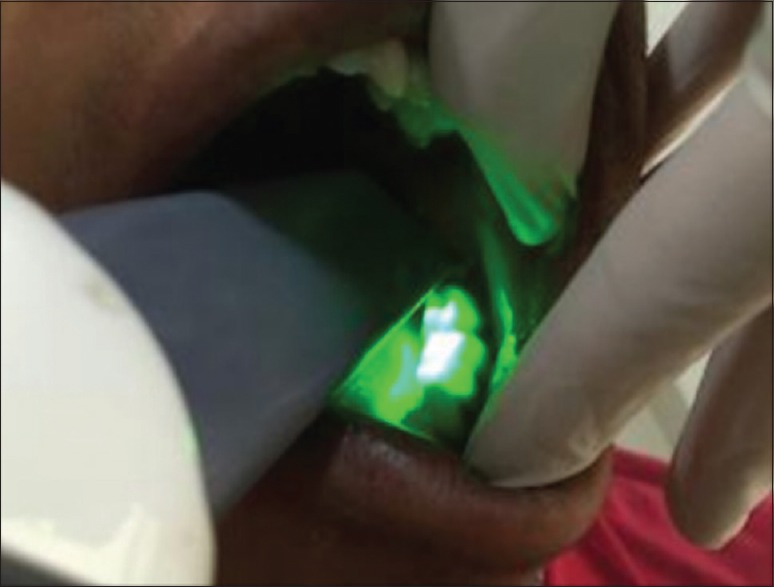
Scanning of the teeth to make intraoral digital impressions
Perforated sectional impression tray was selected, tray adhesive was applied (Medicept UK Ltd.), and single-stage double-mix impression was made using addition silicone impression material (3M™ ESPE), putty, and light body consistency [Figures 8 and 9]. The casts were poured in Type IV dental stone after an hour (Kalrock-Kalabhai Karson India Pvt. Ltd., India) [Figures 10 and 11] and were then scanned with the extraoral scanner (LAVA™ Scan ST Design system [3M™ ESPE]) [Figure 12]. The LAVA™ Scan ST Design system (3M™ ESPE) is a noncoated type of optical scanner, with an average scan time of 1.40 min for a single crown. It uses Dental Wings software which is open architecture CAD software, for the evaluation of the digital images obtained from the intraoral and extraoral scanners and for designing various dental prostheses. The software allows evaluation of the digital images and is accurate till up to two decimals while making measurements. The images obtained from both the scanners were processed on the computer and further evaluation was done using the Dental Wings software.
Figure 8.
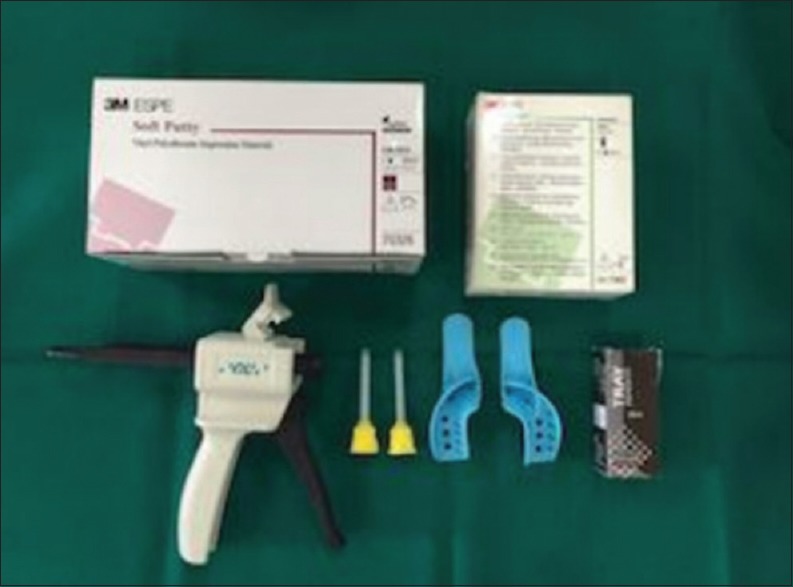
Photograph showing materials used for making final impressions
Figure 9.
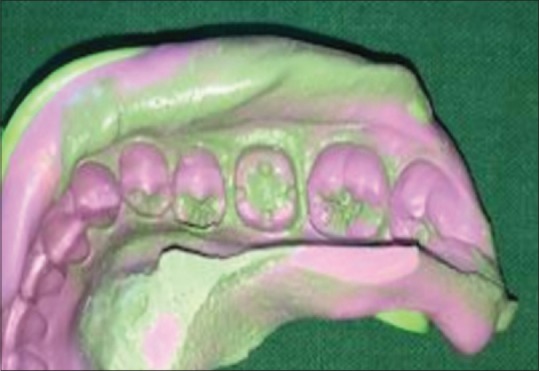
Impression made using addition silicone impression material
Figure 10.
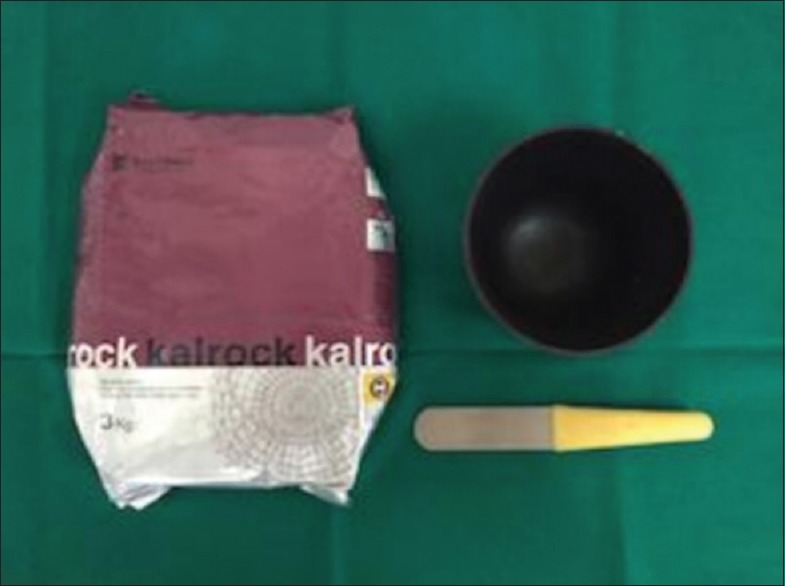
Photograph showing materials used for making final casts
Figure 11.
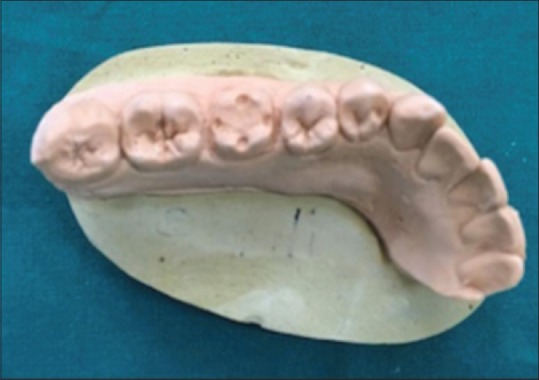
Final cast
Figure 12.
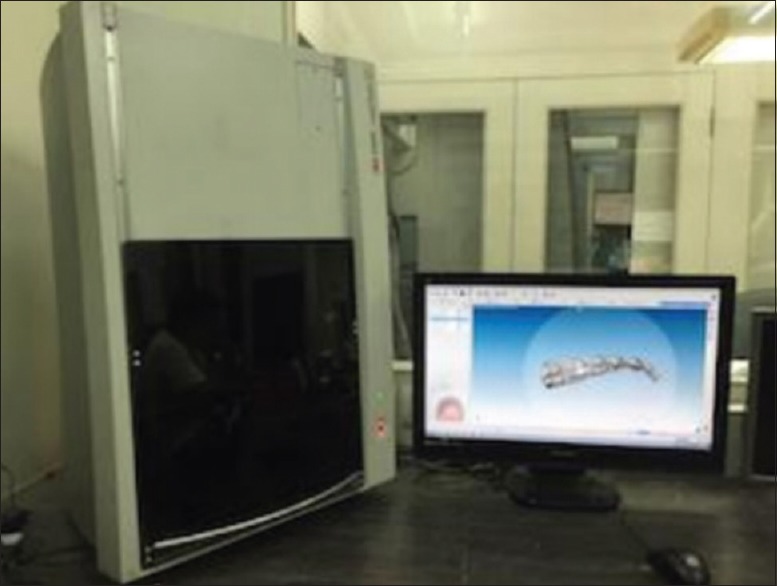
Photograph showing extraoral scanner (LAVA™ Scan ST Design system [3M ESPE]) and Dental Wings software
The datasets obtained were in STL file format [Figures 13 and 14] and were exported to the evaluation software (Dental Wings). Three independent intraoral scans were obtained from each participant and termed as datasets (DS) 1, DS 2, and DS 3. Measurements for these datasets were made by measuring the distance from the inner edge on one side to the inner edge on the opposite side of the dimple, mesiodistally (MD) and buccolingually (BL) of the prepared tooth. Thus, two measurements per DS were obtained, one MD and one BL. The readings obtained were grouped as follows:
Figure 13.
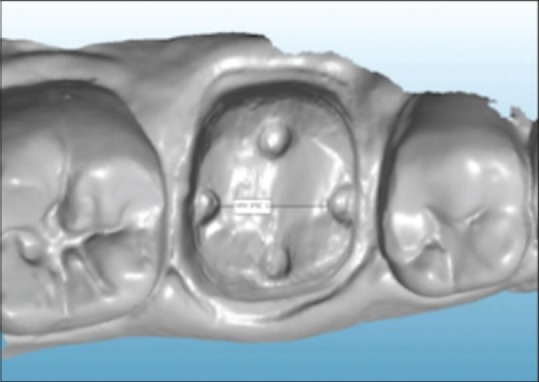
STL file obtained from intraoral scanner to make measurements
Figure 14.
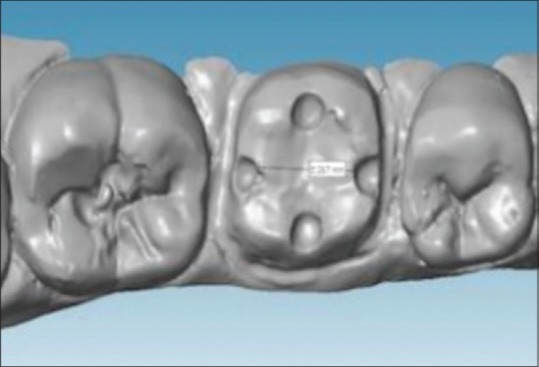
STL file obtained from extraoral scanner to make measurements
Group A – MD datasets (DS-I, DS-II, DS-III) of the intraoral scanner
Group B – BL datasets (DS-I, DS-II, DS-III) of the intraoral scanner
Group C – MD datasets (DS-I, DS-II, DS-III) of the extraoral scanner
Group D – BL datasets (DS-I, DS-II, DS-III) of the extraoral scanner.
RESULTS
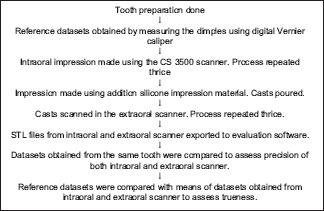
The readings obtained were tabulated. The datasets from the same prepared tooth were compared with each other, to assess the Precision of the Intraoral and Extraoral scanner by evaluating the standard deviation. To assess the Trueness, the Reference DS was compared to the means of the mesio-distal and bucco-lingual DS obtained from Intraoral and Extraoral scanner. The results obtained were subjected to statistical analysis using Repeated Measure ANOVA, Independent t-test and Least Significance Difference (LSD) test with P < 0.05.
DISCUSSION
This study was conducted to evaluate and compare the accuracy of digital impressions, by scanning the teeth intraorally using an IO scanner and scanning the gypsum casts obtained from conventional impressions with EO scanner. The values from IO and EO scanner were then compared with reference DS, obtained by measuring the test tooth intraorally.
“Precision” and “trueness” are terms that represent different measures of accuracy. “Precision” is defined as a comparison between the various datasets obtained from the same object. “Trueness” is defined as the comparison between a reference dataset and a test dataset.[2] The higher the precision, the more predictable is the measurement. A high trueness delivers a result that is close or equal to the real value of the measured object.
Impressions were made using Addition silicon impression material (3M™ ESPE), by single-stage double-mix technique. Franco et al.[4] compared single stage versus 2-step double mix impression technique, and showed that single step impression making technique had lesser discrepancies. Shrestha P and co-workers[5] also were of the opinion that single stage double mix technique was more accurate than two-stage technique with spacer. Type IV dental stone was used to obtain casts from the impression. The obtained casts were then scanned in the EO scanner (LAVA™ Scan ST Design system [3M™ ESPE]), three times, and three DS per cast were obtained. The DS were in STL file format and were further evaluated using the Dental Wings software.
Two measurements per DS were obtained from the IO and EO scanner, one in the mesiodistal direction and one in the buccolingual direction.
The precision was assessed using the DS obtained from IO and EO scanner. The mean and SDs of all grouped DS were further calculated and subjected to statistical analysis.
The precision of the IO scanner was analyzed using SD of the DS obtained (the deviation between the three DS was calculated). Repeated measures ANOVA and independent t-test were conducted to compare the SD of groups and assess the precision of IO and EO scanner. The trueness of the IO scanner was assessed by comparing the mean obtained from DS of the IO and EO scanner with the reference DS obtained by measuring the teeth intraorally.
Tables 1–4 show the MD and BL measurements of the IO and EO scanner, respectively. Three DS per participant were obtained and tabulated.
Table 1.
Standard deviations for precision of Group A

Table 4.
Standard deviations for precision of Group D

Table 2.
Standard deviations for precision of Group B

Table 3.
Standard deviations for precision of Group C

The precision readings for the IO scanner were better than EO scanner as per the results of this study. The values for IO scanner ranged from 21.4 to 33.3 μm MD (Group A [P = 0.300]), 20 to 33.4 μm BL (Group B [P = 0.820]), 19.5 to 39.4 μm MD (Group C [P = 0.355]), and 19.5 to 34.6 μm BL (Group D [P = 0.298]) for the EO scanner. The average values ranged from 20.7 to 33.35 for IO scanner and 19.5 to 37 for EO scanner [Graphs 1 and 2]. The values obtained showed lesser deviations for both IO and EO scanner as compared to the other studies.
Graph 1.
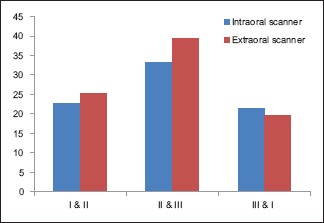
Standard deviations for precision of mesiodistal datasets of intraoral and extraoral scanner
Graph 2.
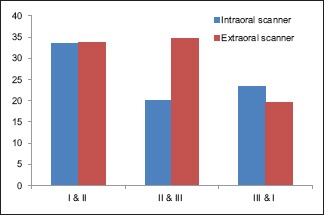
Standard deviations for precision of buccolingual datasets of intraoral and extraoral scanner
Patzelt et al.[2,6] in their studies compared the accuracy of four IO scanners to scan edentulous jaws and completely dentulous jaws and their mean precision values ranged from 21.6 to 698.0 μm and 37.9 to 99.1 μm, respectively. Flügge et al.,[7] in their study, concluded that EO scanning has higher precision (25 μm) than IO scanning (50 μm). Likewise, Ender and Mehl[8] in their study found that conventional impressions had higher precision (12.5 μm ± 2.5 μm) than digital impressions (32.4 μm ± 9.6 μm).
The comparison of average SD of MD DS (Group A and C [P = 0.767]) [Table 5] and BL DS (Group B and D [P = 0.674]) [Table 6] of IO and EO scanner showed no significant difference.
Table 5.
Comparison of mean deviations of mesiodistal datasets of Group A and Group C

Table 6.
Comparison of mean deviations of buccolingual datasets of Group B and Group D

When the precision readings were compared between Group A and Group C and Group B and Group D, it was found that MD the IO scanner showed higher precision values than EO scanner whereas the opposite was seen in the buccolingual direction. This could be due to discrepancy that might set in due to dimensional changes that might have been incorporated during the process of impression and cast making and then scanning with the EO scanner.
In the BL direction, the EO scanner showed lesser deviation when compared to the IO scanner, whereas in the MD direction, EO scanner showed higher deviations as compared to the IO scanner. The MD dimension being larger than the BL dimension may have shown discrepancy recorded during impression making because of which the EO scanner showed more deviations between the readings when compared to IO scanner.
According to the laws of reflection (specular), the angle of incident rays equals that of reflected rays to the normal at the point of reflection. Specific material properties, such as translucence, matte, and porous surfaces similar to gypsum, and added properties from coating will create different microscopic planes in the three dimensions. This will cause the incident rays to scatter, resulting in a diffuse reflection. This results in a considerable decrease in light intensity that could explain the specific errors encountered, and a 90° scan reduces the critical area's misfit.[9] Hence, lesser deviations were seen in the MD DS as compared to BL DS as they were recorded by keeping the scanner at an angle of 45° to the long axis of tooth.
The mean SD for precision in this study for IO scanner were found to be 19.6 μm MD and 16.4 μm BL and that for EO scanner SD were found to be 24.0 μm MD and 22.5 μm BL [Graph 3]. These obtained readings were within the clinically acceptable range in accordance to other studies.[2,6,7]
Graph 3.
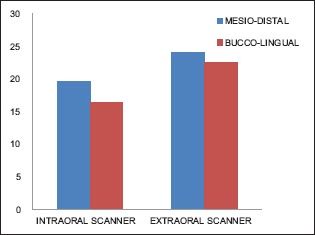
Mean deviations for precision of intraoral and extraoral scanner
To assess the trueness of IO scanner, reference DS obtained by measuring the test teeth intraorally were compared with the mean of DS obtained from scanning with IO and EO scanner.
The mean trueness values for reference DS were found to be 509 μm (SD 634.0 μm) for MD DS and 410 μm (SD 773.5 μm) for BL DS. For IO scanner, mean was found to be 477 μm (SD 576.4 μm) for MD DS and 349 μm (SD 655.2 μm) for BL DS; similarly, for EO scanner, mean was found to be 456 μm (SD 743.0 μm) for MD DS and 336 μm (SD 626.5 μm) for BL DS [Table 7 and Graph 4].
Table 7.
Standard deviations for trueness of intraoral and extraoral scanner

Graph 4.
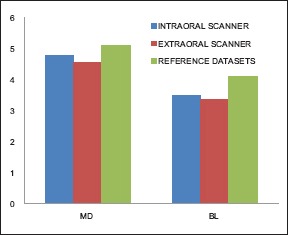
Comparison of means of intraoral and extraoral scanner with the reference datasets for trueness
ANOVA test and LSD test were conducted to compare the means and SD of IO and EO scanner with the reference DS.
The Reference DS were compared with MD of IO scanner (P = 0.296) and MD of EO scanner (P = 0.86), no significant difference was found. Also, when MD DS of IO scanner was compared with MD DS of EO scanner (P = 0.481) showed no significant difference.
Likewise, for BL DS, no significant difference was found when reference DS was compared with IO scanner (P = 0.056), whereas significant difference was found between reference DS and EO scanner (P = 0.023) and no significant difference was found when IO DS were compared with DS of EO scanner (P = 0.686).
The mean value of IO scanner for trueness was closest to the actual measurements obtained from the teeth intraorally.
The statistical analysis for trueness of the IO and EO scanner values when compared to the reference DS, it was found the IO scanner values, in general, showed lesser deviations than the EO scanner. This was probably due to the incorporation of discrepancies during the various procedures involved during the EO scanning than of the tooth by IO scanning. However, the IO readings also showed some amount of deviation from the reference DS due to minor errors that might have crept in during image stitching procedure.
Intraoral scanners lack fixed references. Thus, what it uses as a reference is the first image made by the scanner. All subsequent images are “stitched” to the previous one by a best-fit algorithm that represents the best possible overlap of images. Each overlap has an inherent error; as a consequence, the final error would gradually increase with every stitching process. Hence, it can be anticipated that the longer the scanning field, and more the stitching processes completed, the larger the errors would be presented.[10]
Patzelt et al.[2,6] in their study found the trueness of four IO scanners ranging from 44.1 to 591.8 μm for edentulous arches and 38 to 332.9 completely edentulous arches, respectively, and the authors concluded that except for one intraoral scanner, all other tested systems showed comparable levels of trueness values which were in accordance to the results of this study. However, Ender and Mehl[11] when compared conventional impressions with digital impressions found the trueness for conventional impressions to be 20.4 ± 2.2 μm and for digital impressions to be 58.6 ± 15.8 μm, and they concluded that digital impressions are less accurate than conventional impressions as opposed to the results of this study.
The values of trueness for IO scanner were closer to the SD of the reference DS, and hence, the images obtained from IO scanner were closer to the actual tooth measurements. However, the EO scanner showed images with more deviations than the IO scanner when compared to the actual tooth measurements.
The results and statistical analysis of this study showed that IO scanner showed higher precision and trueness values when compared with the EO scanner, though both of them were within clinically acceptable ranges.
CONCLUSION
This study was done to evaluate and compare the accuracy of intraoral and extraoral digital impression in terms of “precision” and “trueness” under in vivo conditions, and it was concluded that intraoral scanner showed lesser deviations and hence higher precision when compared to the extraoral scanner. The mean values of the intraoral scanner for trueness were closest to the actual measurements, than that of the extraoral scanner when compared to the actual measurements. Hence, within the limitations of this study, it can be concluded that intraoral scanner has higher “precision” and “trueness” as compared to the extraoral scanner.
Financial support and sponsorship
Nil.
Conflicts of interest
There are no conflicts of interest.
REFERENCES
- 1.Patzelt SB, Lamprinos C, Stampf S, Att W. The time efficiency of intraoral scanners: An in vitro comparative study. J Am Dent Assoc. 2014;145:542–51. doi: 10.14219/jada.2014.23. [DOI] [PubMed] [Google Scholar]
- 2.Patzelt SB, Vonau S, Stampf S, Att W. Assessing the feasibility and accuracy of digitizing edentulous jaws. J Am Dent Assoc. 2013;144:914–20. doi: 10.14219/jada.archive.2013.0209. [DOI] [PubMed] [Google Scholar]
- 3.Mörmann WH, Brandestini M, Lutz F, Barbakow F. Chairside computer-aided direct ceramic inlays. Quintessence Int. 1989;20:329–39. [PubMed] [Google Scholar]
- 4.Franco EB, Fernandes da Cunha L, Herrera FS, Benetti AR. Accuracy of single-step versus 2-step double mix impression technique. ISRN Dentistry. 2011:1–5. doi: 10.5402/2011/341546. [DOI] [PMC free article] [PubMed] [Google Scholar]
- 5.Guth JF, Keul C, Stimmelmayr M, Beurer F, Edelhoff D. Accuracy of digital models obtained by direct and indirect data capturing. Clin Oral Invest. 2013;17:1201–8. doi: 10.1007/s00784-012-0795-0. [DOI] [PubMed] [Google Scholar]
- 6.Patzelt SB, Emmanouilidi A, Stampf S, Strub R, Att W. Accuracy of full-arch scans using intraoral scanner. Clin Oral Invest. 2014;18:1687–94. doi: 10.1007/s00784-013-1132-y. [DOI] [PubMed] [Google Scholar]
- 7.Flugge TV, Schlager S, Nelson K, Nahles S, Metzger MC. Precision of intraoral digital dental impressions with iTero and extraoral digitization with the iTero and a model scanner. Am J Orthod Dentofacial Orthop. 2013;144:471–8. doi: 10.1016/j.ajodo.2013.04.017. [DOI] [PubMed] [Google Scholar]
- 8.Ender A, Mehl A. Accuracy of complete-arch dental impressions: A new method of measuring trueness and precision. J Prosthet Dent. 2013;109:121–8. doi: 10.1016/S0022-3913(13)60028-1. [DOI] [PubMed] [Google Scholar]
- 9.Nedelcu RG, Persson AS. Scanning accuracy and precision in 4 intraoral scanners: An in vitro comparison based on 3-Dimensional analysis. J Prosthet Dent. 2014:112:1461–71. doi: 10.1016/j.prosdent.2014.05.027. [DOI] [PubMed] [Google Scholar]
- 10.Rhee K, Huh YH, Cho LR, Park CJ. Comparison of intraoral scanning and conventional impression techniques using 3-dimensional superimposition. J Adv Prosthodont. 2015;7:460–7. doi: 10.4047/jap.2015.7.6.460. [DOI] [PMC free article] [PubMed] [Google Scholar]
- 11.Ender A, Mehl A. In-Vitro evaluation of the accuracy of conventional and digital methods of obtaining full-arch dental impressions. Quintessence Int. 2015;46:9–17. doi: 10.3290/j.qi.a32244. [DOI] [PubMed] [Google Scholar]


