

Abstract
Aims
Codrituzumab (GC33) is a recombinant, humanized mAb that binds to glypican‐3 (GPC3), an oncofetal protein highly expressed in hepatocellular carcinoma (HCC). This investigation aimed to identify clinically relevant factors that may affect the overall survival (OS) in HCC patients treated with codrituzumab and to quantitatively annotate their effects.
Methods
Codrituzumab exposure was estimated by a population pharmacokinetics model with a nonlinear elimination pathway. Analysis of OS was performed using a time‐to‐event model in 181 patients with advanced HCC. The model was tested with the addition of various covariates, including levels of immune biomarkers, such as CD16 (measured in terms of molecules of equivalent soluble fluorophore; CD16MESF) and CD4, codrituzumab exposure and potential prognostic biomarkers of HCC such as baseline tumour size and soluble GPC3.
Results
The time‐to‐event model estimated a prolonged OS (>3 months) in patients with codrituzumab exposure of ≥230 μg ml−1 and high CD16MESF level (>5.26 × 10⁵ MESF at least). The Weibull model was selected as the base hazard model. The baseline tumour size was included in the hazard model as a parameter independent of the drug effect. A logistic model was applied to explain the effects of drug exposure and CD16MESF level.
Conclusions
The final model indicates that adequate drug exposure plus a favourable immune environment are associated with prolonged OS. This quantitative model should be further validated with emerging data so as to guide study design in future clinical trials.
Keywords: GC33/codrituzumab, GPC3, hepatocellular carcinoma, overall survival, pharmacokinetics, time‐to‐event model
What is Already Known about this Subject
Codrituzumab is well tolerated in a dose range of 2.5 to 20 mg kg−1 in weekly doses up to 1600 mg in advanced HCC patients.
A retrospective analysis suggests that drug exposure and CD16 expression levels might help in predicting efficacy of codrituzumab treatment in HCC patients.
What this Study Adds
This is the first time that a time‐to‐event model has been applied to estimate probability of OS in HCC patients following treatment with codrituzumab.
This time‐to‐event model quantitatively estimated prolonged OS in HCC patients who had both adequate codrituzumab exposure and a favourable immune environment.
Introduction
http://www.guidetopharmacology.org/GRAC/LigandDisplayForward?ligandId=8406 (GC33) is a recombinant, humanized monoclonal antibody that binds to the C‐terminal region of human http://www.guidetopharmacology.org/GRAC/ObjectDisplayForward?objectId=2959&familyId=904&familyType=OTHER (GPC3), an oncofetal protein highly expressed in hepatocellular carcinoma (HCC). Preclinical data have suggested that codrituzumab triggers FcγRIIIa‐mediated (CD16‐mediated) antibody‐dependent cell cytotoxicity (ADCC) and/or antibody‐dependent cell phagocytosis 1. In humanized liver cancer xenograft models, codrituzumab induced ADCC against GPC3‐positive HCC cell lines and caused inhibition of tumour growth 2.
Phase I studies in the United States (GC‐001US) 3 and Japan (GC‐003JP) 4 showed that codrituzumab was well tolerated at doses of up to 20 mg kg−1 week−1 without dose‐limiting toxicity. Serum codrituzumab concentration profiles were described by a two‐compartmental pharmacokinetics (PK) model with a linear and a nonlinear elimination pathway 5, 6. The Phase II study (NP27884, NCT01507168) failed to demonstrate the clinical efficacy of codrituzumab in previously treated patients with advanced HCC who were given codrituzumab 1600 mg intravenously every 2 weeks (Q2W) after first two weekly loading doses. However, retrospective exposure–response analyses indicated that patients who had both high levels of CD16 and high codrituzumab exposures as trough concentrations were likely to benefit from codrituzumab treatment 5. Although such observations are limited by the retrospective nature of the analyses, considering the mode of action of codrituzumab, increasing codrituzumab exposure in patients who have high GPC3‐expressing tumours and who have high CD16 expression may be crucial to drive any therapeutic benefit.
The objectives of this investigation were to identify clinically relevant factors that may affect the OS and to annotate their effects in a quantitative fashion by means of a quantitative time‐to‐event model. Further validating this model with emerging data may help guide future study design.
Methods
Study population and design
A total of 185 patients were enrolled in a randomized, double‐blind, Phase II study in HCC patients with unresectable advanced or metastatic disease (NP27884, NCT01507168). Patients ≥18 years of age with an Eastern Cooperative Oncology Group (ECOG) score of 0–1 7 and a Child–Pugh score of A were included. This study was approved by the institutional review boards of the participating centres and was conducted in accordance with the Declaration of Helsinki and Good Clinical Practice guidelines 5. All patients provided written informed consent. Codrituzumab 1600 mg was intravenously administered over 30–90 min every 2 weeks (Q2W) after two weekly loading doses. Patients were assigned into three cohorts based on the immunohistochemistry (IHC) analysis of GPC3 expression: Cohort A (GPC3 IHC 2+/3+), Cohort B (GPC3 IHC 1+) and Cohort C (GPC3 IHC 0), and were randomized in a 2:1 ratio to codrituzumab versus placebo. For this survival model analysis, 121 patients who were administered at least one dose of codrituzumab and 60 patients in the placebo group from all cohorts were used. The demographic information and OS of patients used for this analysis is summarized in Table 1.
Table 1.
Summary of patient characteristics
| Group | ||
|---|---|---|
| Placebo | Codrituzumab | |
| (n = 60) | (n = 121) | |
| Dose | — | 1600 mg, two weekly doses followed by bi‐weekly doses from week 3 |
| Demographics | ||
| Body weight (kg), mean ± SD | 68.2 ± 16.8 | 71.0 ± 14.1 |
| Overall survival time | ||
| Median (95% CI), days | 304 (179–342) | 271 (207–359) |
| Right censored, n (%) | 18 (30.0%) | 46 (38.0%) |
| Statistics of covariates | ||
| CD 16MESF (×10 5 MESF), median (min–max), n obs | 3.69 (0.95–8.59), 53 | 3.82 (1.54–8.45), 102 |
| C trough,3 (μg ml −1 ), median (min–max), n obs | — | 230 (16.1–506), 121 |
| Sum of the longest diameters (SLD) (mm), median (min–max), n obs | 85.5 (21.0–302), 60 | 88.0 (20.0–439), 121 |
n obs, number of observations
Serum codrituzumab concentrations were obtained from 768 samples in 121 patients; 88 patients for only sparse samplings, 31 patients for full sampling after the first dose and 13 patients for full sampling after the seventh dose in addition to sparse samplings. The collection time points were 15 min after the end of infusion (EOI) and 24 and 96 h after the start of infusion (SOI) of the first dose; 24 and 96 h after the SOI and 15 min after the EOI of the second dose; 24, 96 and 240 h after the SOI of the seventh dose; immediately before every dose; at final visit; and at follow‐up visit. The serum level of codrituzumab was determined by a validated ELISA using human GPC3 core protein 8 as a capture antigen, rabbit anti‐codrituzumab as the primary antibody, and goat anti‐rabbit IgG (HþL)‐HRP as the secondary detector antibody.
Estimation of steady state concentrations
On the basis of population PK simulations, serum concentrations of codrituzumab are considered to reach a steady state after the third dose 6. Because we measured serum concentrations sparsely in 88 patients, a post hoc estimation of trough concentration after the third dose (Ctrough,3) was used as representative of drug exposure level for each patient. The PK model and the estimated parameters are shown in Supporting Information Data S1.
Survival model
Survival model analysis was performed for a total of 181 patients (placebo = 60; active = 121) with advanced HCC enrolled in the Phase II study (June 2014 cut‐off). A time‐to‐event model 9 was applied to estimate the survival probability for OS. Survival at time t is described as follows:
| (1) |
where S(t) is the survival function and h(t) is a hazard function.
Because previous analysis 5 showed that increasing codrituzumab exposure in patients might be crucial for therapeutic benefit, we explored codrituzumab exposure as a covariate of a hazard function in addition to other covariates such as immune biomarkers and potential prognostic biomarkers on HCC. The hazard function is explained by the following two hazard functions:
| (2) |
where f(base) is a base hazard function and f(drug) is a hazard function changed by codrituzumab exposure and levels of other covariates.
First, we explored exponential, Weibull and Gompertz models 9 as a base hazard function with all data, and selected the model whose objective function value (OFV) was the least and for which a visual predictive check showed that the model most reasonably captured the observed variation of survival probability with time.
Because both high exposures of codrituzumab and high levels of CD16 in terms of molecules of equivalent soluble fluorophore (CD16MESF) are considered to be crucial for triggering the ADCC effect, before conducting a covariate search, we next explored the effects of codrituzumab exposure with CD16MESF on the base hazard as a structure model by using Eq. (3).
| (3) |
where E(CD16MESF) and E(Ctrough,3) are functions of CD16MESF and Ctrough,3, respectively.
Our exploratory analysis showed that OS was longer with high exposure of codrituzumab in the group with high CD16MESF 5, and that no effect of codrituzumab was observed in the group with low CD16MESF. However, the preliminary analysis did not explore what levels of CD16MESF and codrituzumab exposure were needed to achieve prolongation of OS. Therefore, the following logistic models were selected for E(CD16MESF) and E(Ctrough,3) to explore the target levels for both CD16MESF and codrituzumab:
| (4) |
| (5) |
where μ is the population mean and s is a scale parameter for logistic models.
A covariate search on individual parameters of λ0 and β0 in the base hazard function was performed for the following measures at baseline: race, region of study sites, body weight, albumin, haematocrit, lymphocyte count, neutrophil count, white blood cell count, alanine transaminase (ALT), aspartate transaminase (AST), bilirubin, Child–Pugh score, alpha‐fetoprotein, and alkaline phosphatase; sum of the longest diameters (SLD); level of CD4 and CD16MESF as an immune biomarker; and level of GPC3 expression in tumour (GPC3 IHC score), and level of GPC3 expression in serum (soluble GPC3) for potential prognostic biomarkers on HCC. Covariates were added with the following exponential form:
| (6) |
where θcov is a constant value, cov1 and cov2 are measured values for each covariate at a baseline, and cov1med and cov2med are median values for each covariate.
The covariate search was performed using Perl‐speaks‐NONMEM (version 4.4.8) with a stepwise forward additive approach followed by a stepwise backward elimination approach. P values of 0.05 and 0.01 were used for the forward and backward steps, respectively.
Software
NONMEM software (Version 7.2; ICON Development Solutions, Dublin, Ireland) was used for the nonlinear mixed effect model analysis. The first‐order conditional estimation method with interaction (FOCE‐I) was used for population PK parameter estimation, and FOCE‐I using the Laplacian method was used for a parameter estimation of the survival model.
Nomenclature of targets and ligands
Key protein targets and ligands in this article are hyperlinked to corresponding entries in http://www.guidetopharmacology.org, the common portal for data from the IUPHAR/BPS Guide to PHARMACOLOGY 10, and are permanently archived in the Concise Guide to PHARMACOLOGY 2017/18 11.
Results
Base model selection
Selection of the base hazard model was performed with the data of 181 patients. The Weibull model had the lowest OFV (Table 2), and the median survival curve with 90% confidence interval (CI) predicted by the Weibull model nicely reflected the observed Kaplan–Meier (K‐M) plot (Figure 1). On the other hand, the exponential and Gompertz models underpredicted survival probability at times earlier than 100 days and overpredicted at times later than 400 days. On the basis of the comparison of OFVs in Table 2 and the visual predictive checks in Figure 1 and Supporting Information Data S2, we selected the Weibull model as the base model.
Table 2.
Results of base model selection
| Base models | |||
|---|---|---|---|
| Exponential | Gompertz | Weibull | |
| Objective function value (OFV) | 1634 | 1625 | 1617 |
| ΔOFV from exponential model | — | −9 | −17 |
| Equation for f(base) | λ0 | λ0 × eβ0×t | λ0 × eβ0×ln(t) |
| Estimated parameters (median with 95% CI) | |||
| λ 0 (× 10 −3 day −1 ) | 2.67 (2.27–3.10) | 1.78 (1.26–2.33) | 0.350 (0.126–0.864) |
| β 0 (× 10 −3 ) | — | 2.32 (1.03–3.77) | 0.417 (0.238–0.620) |
Median and 95% CI were calculated from a bootstrap procedure (n = 1000).
Figure 1.
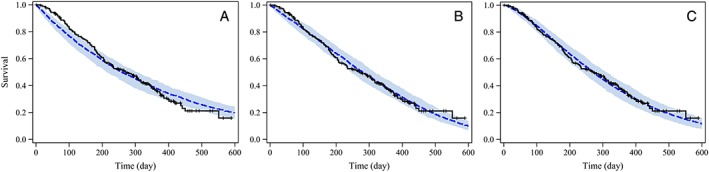
Visual predictive check plots of observed OS and survival predictions of the base models. The black line shows the observed Kaplan–Meier curve; the blue dotted line and shaded band show the simulated median survival curve and the 90% CI from 200 simulations for each model. Plots were prepared for three base models: exponential model (A), Gompertz model (B) and Weibull model (C)
Codrituzumab effect and covariate search result
The Ctrough,3 estimated in the population PK model ranged from 16.1 to 506 μg ml−1 with a median value of 230 μg ml−1. By using the Weibull model, we sought to clarify the combined effect of codrituzumab and CD16MESF in a hazard function as f(drug). The estimated μ for E(Ctrough,3) was 231 μg ml−1 and the estimated μ for E(CD16MESF) was 5.23 ×10⁵ MESF, whereas each s was fixed to 1 as it was not estimated with confidence and did not decrease OFV significantly. Because the estimated μ for E(Ctrough,3) was so close to the median of Ctrough,3, and because ΔOFV between the model using the estimated μ and that using μ fixed as the median of Ctrough,3 was almost 0, μ for E(Ctrough,3) was fixed as the median of Ctrough,3. The final estimated μ for E(CD16MESF) was 5.26 ×10⁵ MESF.
A descriptive summary of the covariates explored in this study is provided in Supporting Information Data S3. After the forward and backward steps in the covariate search, SLD was the only covariate identified as having a statistically significant effect on base hazard. The estimated θSLD was 0.00528, which means that the simulated median survival time was 10.7 months for patients with SLD of 43 mm (half of the median), 9.2 months for patients with SLD of 86 mm (median), and 6.8 months 174 mm (twice the median) in the placebo group.
The OFV and estimated parameters for the final model incorporating effects of codrituzumab exposure and levels of covariates (hereafter, the covariate model) are shown in Table 3. A visual predictive check was done for all patients and subgroups of patients. Overall, the simulated 90% CI of the simulated survival curve reflected the observed K‐M curve well (Figure 2A). Visual predictive check plots stratified by Ctrough,3 and CD16MESF and by SLD are shown in Figures 2B and 2C. Although slight overprediction compared with the observed curve was found in patients with low Ctrough,3 and low CD16MESF, the observed K‐M curves in all other subgroups were within the 90% CI of the simulated survival curves.
Table 3.
Parameter estimates of the covariate model
| Covariate model | |
|---|---|
| OFV | 1588 |
| OFV vs. Base model | −29 |
| Estimated parameters (median with 95% CI) a | |
| λ 0 (× 10 −3 day −1 ) b | 0.223 (0.0717–0.582) |
| β 0 b | 0.523 (0.326–0.749) |
| μ for C trough,3 (μg ml −1 ) | 230 fixed |
| μ for CD16 MESF (× 10 5 MESF) | 5.26 (3.98–6.57) |
| β 1 on SLD c | 0.00543 (0.00261–0.00929) |
Median and 95% CI were calculated from a bootstrap procedure (n = 1000).
Parameters of Weibull model for f(base); λ0 × eβ0×ln(t).
SLD, sum of the longest diameters.
Figure 2.

Visual predictive check plots of OS and survival predictions of the final model. The black line shows the observed Kaplan–Meier curve, the blue line and shaded band show the simulated median survival curve and the 90% CI from 200 simulations. Visual predictive check plots were prepared for all patients (A), subgroups stratified by μ of Ctrough,3 and μ of CD16MESF (B), and subgroups stratified by median value of SLD (C)
Impact of codrituzumab on survival
Median survival times were simulated with the final model incorporating all three covariates by changing CD16MESF and Ctrough,3 levels for each of three values of SLD. Values of half the median value, the median value and twice the median value for all covariates were selected as simulation data sets. In addition, μ for CD16MESF, which is 5.26 ×10⁵ MESF, was also selected to show the impact of 50% effect of CD16MESF on survival.
As shown in Table 4, simulated median survival times for Ctrough,3 of 115 μg ml−1 were exactly the same as those with placebo because E(Ctrough,3) is 0. Simulated median survival times for CD16MESF of 3.72 ×10⁵ MESF (median) were slightly longer (around 1 month) than placebo when Ctrough,3 was 460 μg ml−1. Prolongation of median survival times to more than 3 months longer than with placebo was observed in the simulation scenarios of CD16MESF of 5.26 ×10⁵ MESF and Ctrough,3 of 460 μg ml−1 and in the simulation scenarios of CD16MESF of 7.44 ×10⁵ MESF (twice the median) and Ctrough,3 ≥ 230 μg ml−1.
Table 4.
Simulated median survival times and the estimated covariate effects in subgroups with different codrituzumab exposures
| CD16 MESF b | SLD (mm) | Median survival time (months), (difference from placebo) | |||
|---|---|---|---|---|---|
| Codrituzumab exposure: C trough,3 (μg ml −1 ) a | |||||
| 0 (Placebo) | 115 | 230 | 460 | ||
| 1.86 | 43 | 10.7 | 10.7 (±0) | 10.8 (+0.1) | 10.9 (+0.2) |
| 86 | 9.2 | 9.2 (±0) | 9.3 (+0.1) | 9.4 (+0.2) | |
| 172 | 6.8 | 6.8 (±0) | 6.9 (+0.1) | 6.9 (+0.1) | |
| 3.72 | 43 | 10.7 | 10.7 (±0) | 11.3 (+0.6) | 12.1 (+1.4) |
| 86 | 9.2 | 9.2 (±0) | 9.7 (+0.5) | 10.4 (+1.2) | |
| 172 | 6.8 | 6.8 (±0) | 7.2 (+0.4) | 7.7 (+0.9) | |
| 5.26 | 43 | 10.7 | 10.7 (±0) | 12.8 (+2.1) | 16.6 (+5.9) |
| 86 | 9.2 | 9.2 (±0) | 11 (+1.8) | 14.3 (+5.1) | |
| 172 | 6.8 | 6.8 (±0) | 8.2 (+1.4) | 10.6 (+3.8) | |
| 7.44 | 43 | 10.7 | 10.7 (±0) | 15.8 (+5.1) | N.C. |
| 86 | 9.2 | 9.2 (±0) | 13.6 (+4.4) | N.C. | |
| 172 | 6.8 | 6.8 (±0) | 10.1 (+3.3) | N.C. | |
N.C.: not calculated.
E(Ctrough,3) was calculated as 0.00, 0.50 and 1.00 for Ctrough,3 of 115, 230 and 460 μg ml−1.
E(CD16MESF) was calculated as 0.03, 0.18, 0.50 and 0.90 for CD16MESF of 1.86, 3.72, 5.26 and 7.44 ×10⁵ MESF.
Discussion
We performed a time‐to‐event analysis to identify clinically relevant factors that may affect OS and to annotate their effects quantitatively. Data from the Phase II study, which included 181 HCC patients, were analysed using a nonlinear mixed effect modelling approach.
Because codrituzumab shows a similar PK profile to that of general IgG antibodies 12, a two‐compartmental model with linear and nonlinear clearances was applied in our previous population PK model 6. This population PK model was used to estimate the projected steady state concentrations used for the survival model analysis.
The covariate model established in this study could reasonably well explain the observed K‐M curve for OS in all patients as well as in subpopulations stratified by SLD, Ctrough,3 and CD16MESF levels except for patients with low Ctrough,3 and low CD16MESF. The overprediction of OS indicates higher hazard than estimated. Although possible reasons have been discussed, e.g. the existence of missing covariates that affect the hazard on OS and/or poor estimations of parameters because of small patient numbers, the evidence is still not conclusive. In this model, the drug effect was described by a function of the levels of CD16MESF and trough concentrations of codrituzumab as exposure. These results are in agreement with the characteristics of codrituzumab, which binds to human GPC3 and interacts with CD16 to trigger ADCC 1, 2, 13, 14, 15 . Furthermore, a cut‐off value for Ctrough,3 estimated as μ of the logistic model was almost the same as the median Ctrough,3, which corresponds to about 85% target saturation 6. Thus, this survival analysis suggested that a codrituzumab exposure of ≥230 μg ml−1 would be a target concentration to show the maximum effects on OS. A different approach, using a propensity score method, has been applied to explore the effect of CD16MESF on OS 5. That exploratory analysis showed that CD16MESF levels greater than or equal to the 67th percentile led to longer survival (HR = 0.09). In the current study, we explored not only CD16MESF and codrituzumab exposure but also other covariates that would affect OS independently of codrituzumab, and we found SLD to be a clinically meaningful covariate. On the other hand, although the level of GPC3 expression was identified as having a significant impact on survival in the first step of the covariate search, it was not subsequently selected as a covariate in the covariate model. One reason would be that more than half of the patients in this study have tumours with a relatively high GPC3 expression and an IHC score of 2+ and 3+, and the power to detect an impact does not seem to be sufficient.
Simulations using the covariate model showed a 3.9‐month difference between the simulated median survival time for SLD of 43 mm and SLD of 172 mm. Considering that the observed SLD range was 20–439 mm in the Phase II study, SLD would surely be an important factor with a large impact on OS in HCC patients.
In addition, this survival analysis also estimated a cut‐off value of 5.26 × 10⁵ MESF for CD16MESF; this was approximately the 75th percentile from the bottom in this Phase II study, which indicates that most patients do not have an immune environment sufficient to show the maximum effects of codrituzumab. Although we have to be careful in our interpretation of these results because this is a retrospective analysis with a limited number of patients with CD16MESF higher than 5.26 ×10⁵ MESF, we used this model to project potential effects of codrituzumab on OS in various scenarios shown in Table 4. The simulations indicated that our target trough concentrations at steady state would be sufficient, but levels of CD16MESF higher than the median value would be needed to show the maximum effect.
A theoretical mechanism of action involves codrituzumab interacting with GPC3 to recruit CD16‐positive effector cells to exert cell killing, which is not used in current therapies for previously treated patients with advanced HCC. Our survival model analysis offers quantitative support for this theory, with simulations showing that high codrituzumab exposures of ≥230 μg ml−1 with CD16MESF higher than at least 5.26 × 10⁵ MESF prolong OS by more than 3 months. As codrituzumab weekly doses were tolerable between 2.5 and 20 mg kg−1 in Phase I studies 3, 4, our population PK model recommended weekly doses of codrituzumab to maintain a steady state concentration. However, limited clinical benefit was predicted for patients with CD16MESF lower than the median. The results of this simulation suggest that codrituzumab as a single agent for the treatment of advanced HCC patients would show a clinical benefit over placebo in patients with a sufficient immune environment, and also that there is potential for benefit from combination therapy with codrituzumab plus other anticancer drug(s) in future development. Inhibitors of a PD‐1 pathway, anti‐KIR agents or inhibitors of CTLA4 via IL‐2 activation would be potential combination drugs to activate NK cells 16. Combination study of codrituzumab with anti‐PD‐L1 humanized antibody, atezolizumab, is currently being explored in a Phase I study (JapicCTI‐163325) 17.
This survival modelling approach was able to quantitate the effect of codrituzumab on OS for HCC patients in our Phase II study, and will be helpful in providing guidance for an appropriate dosing regimen, appropriate patient selection and appropriate selection of drugs for combination therapy. Because the data was limited to patients with GPC3 IHC scores of 2+ or 3+, this model will be improved by further validation with emerging data.
Conclusion
We applied a time‐to‐event model in HCC patients treated with codrituzumab to evaluate the effect on OS. The model established in this study indicates that a favourable immune environment plus codrituzumab exposure of more than 230 μg ml−1 are associated with a prolongation of OS.
Competing Interests
N.O., M.N., S.I., T.K. and T.O. are employees of Chugai Pharmaceutical Co., Ltd., and C.D., C.X., R.L. and Y.C. are employees of F. Hoffmann‐La Roche Inc.
We thank Christine Rossin and Axel Muehlig for their contributions on data processing and analysis, and Prof. Nick Holford for his suggestions on time‐to‐event analysis.
Contributors
M.N., N.O., R.L., S.I., T.K., T.O., Y.C.C. and G.A. designed the research. C.D., M.N., N.O., R.L., S.I., T.O. and Y.C.C. performed the research. M.N., C.X. and G.A. analysed the data. M.N. wrote the manuscript.
Supporting information
Data S1 Population PK model of Codrituzumab
Data S2 VPC plots for base model selection
Data S3 Listings of covariates
Nakamura, M. , Xu, C. , Diack, C. , Ohishi, N. , Lee, R. , Iida, S. , Kawanishi, T. , Ohtomo, T. , Abou‐Alfa, G. K. , and Chen, Y.‐C. (2018) Time‐to‐event modelling of effect of codrituzumab on overall survival in patients with hepatocellular carcinoma. Br J Clin Pharmacol, 84: 944–951. doi: 10.1111/bcp.13530.
References
- 1. Nakano K, Orita T, Nezu J, Yoshino T, Ohizumi I, Sugimoto M, et al Anti‐glypican 3 antibodies cause ADCC against human hepatocellular carcinoma cells. Biochem Biophys Res Commun 2009; 378: 279–284. [DOI] [PubMed] [Google Scholar]
- 2. Ishiguro T, Sugimoto M, Kinoshita Y, Miyazaki Y, Nakano K, Tsunoda H, et al Anti‐glypican 3 antibody as a potential antitumor agent for human liver cancer. Cancer Res 2008; 68: 9832–9838. [DOI] [PubMed] [Google Scholar]
- 3. Zhu AX, Gold PJ, El‐Khoueiry AB, Abrams TA, Morikawa H, Ohishi N, et al First‐in‐man phase I study of GC33, a novel recombinant humanized antibody against glypican‐3, in patients with advanced hepatocellular carcinoma. Clin Cancer Res 2013; 19: 920–928. [DOI] [PubMed] [Google Scholar]
- 4. Ikeda M, Ohkawa S, Okusaka T, Mitsunaga S, Kobayashi S, Morizane C, et al Japanese phase I study of GC33, a humanized antibody against glypican‐3 for advanced hepatocellular carcinoma. Cancer Sci 2014; 105: 455–462. [DOI] [PMC free article] [PubMed] [Google Scholar]
- 5. Abou‐Alfa GK, Puig O, Daniele B, Kudo M, Merle P, Park JW, et al Randomized phase II placebo controlled study of codrituzumab in previously treated patients with advanced hepatocellular carcinoma. J Hepatol 2016; 65: 289–295. [DOI] [PubMed] [Google Scholar]
- 6. Chen Y, Shochat E, Phipps A, Peck R, Nakamura M, Lee R. Application of non‐linear popPK with target mediated drug disposition (TMDD) in optimization of an oncology dosing regimen. ASCPT 2014 annual meeting; March 18–22, 2014.
- 7. Oken MM, Creech RH, Tormey DC, Horton J, Davis TE, McFadden ET, et al Toxicity and response criteria of the Eastern Cooperative Oncology Group. Am J Clin Oncol 1982; 5: 649–655. [PubMed] [Google Scholar]
- 8. Hippo Y, Watanabe K, Watanabe A, Midorikawa Y, Yamamoto S, Ihara S, et al Identification of soluble NH2‐terminal fragment of glypican‐3 as a serological marker for early‐stage hepatocellular carcinoma. Cancer Res 2004; 64: 2418–2423. [DOI] [PubMed] [Google Scholar]
- 9. Holford N. A time to event tutorial for pharmacometricians. CPT Pharmacometrics & Syst Pharmacol 2013; 2: e43. [DOI] [PMC free article] [PubMed] [Google Scholar]
- 10. Harding SD, Sharman JL, Faccenda E, Southan C, Pawson AJ, Ireland S, et al The IUPHAR/BPS Guide to PHARMACOLOGY in 2018: updates and expansion to encompass the new guide to IMMUNOPHARMACOLOGY. Nucl Acids Res 2018; 46: D1091–D1106. [DOI] [PMC free article] [PubMed] [Google Scholar]
- 11. Alexander SPH, Kelly E, Marrion NV, Peters JA, Faccenda E, Harding SD, et al The Concise Guide to PHARMACOLOGY 2017/18: Overview. Br J Pharmacol 2017; 174: S1–S16. [DOI] [PMC free article] [PubMed] [Google Scholar]
- 12. Dirks NL, Meibohm B. Population pharmacokinetics of therapeutic monoclonal antibodies. Clin Pharmacokinet 2010; 49: 633–659. [DOI] [PubMed] [Google Scholar]
- 13. Takai H, Ashihara M, Ishiguro T, Terashima H, Watanabe T, Kato A, et al Involvement of glypican‐3 in the recruitment of M2‐polarized tumor‐associated macrophages in hepatocellular carcinoma. Cancer Biol Ther 2009; 8: 2329–2338. [DOI] [PubMed] [Google Scholar]
- 14. Takai H, Kato A, Kato C, Watanabe T, Matsubara K, Suzuki M, et al The expression profile of glypican‐3 and its relation to macrophage population in human hepatocellular carcinoma. Liver Int 2009; 29: 1056–1064. [DOI] [PubMed] [Google Scholar]
- 15. Takai H, Kato A, Kinoshita Y, Ishiguro T, Takai Y, Ohtani Y, et al Histopathological analyses of the antitumor activity of anti‐glypican‐3 antibody (GC33) in human liver cancer xenograft models: the contribution of macrophages. Cancer Biol Ther 2009; 8: 930–938. [DOI] [PubMed] [Google Scholar]
- 16. Beldi‐Ferchiou A, Caillat‐Zucman S. Control of NK cell activation by immune checkpoint molecules. Int J Mol Sci 2017; 18: 2129. [DOI] [PMC free article] [PubMed] [Google Scholar]
- 17. Japan Pharmaceutical Information Center Clinical Trials Information . Available at: http://www.clinicaltrials.jp/user/cteSearch_e.jsp (last accessed 28 February 2018).
Associated Data
This section collects any data citations, data availability statements, or supplementary materials included in this article.
Supplementary Materials
Data S1 Population PK model of Codrituzumab
Data S2 VPC plots for base model selection
Data S3 Listings of covariates