

Abstract
HNF1β is an essential transcription factor for the development and functioning of the kidney. Mutations in HNF1β cause autosomal dominant tubulointerstitial kidney disease (ADTKD-HNF1β), which is characterized by renal cysts and maturity-onset diabetes of the young (MODY). Moreover, patients suffer from a severe electrolyte phenotype consisting of hypomagnesemia and hypokalemia. Until now, genes that are regulated by HNF1β are only partially known and do not fully explain the phenotype of the patients. Therefore, we conducted chIP-seq in immortalized mouse kidney cells (mpkDCT) to identify HNF1β binding sites at a genome-wide scale.
In total 7,421 HNF1β binding sites were identified, including several genes involved in electrolyte transport and diabetes. A highly specific and conserved HNF1β site was identified in the promoter of Kcnj16, encoding the potassium channel Kir5.1. Luciferase-promoter assays showed a 2.2 fold increase in Kcnj16 expression when HNF1β was present. Expression of the Hnf1β p.Lys156Glu mutant that was previously identified in a ADTKD-HNF1β patient, did not activate Kcnj16 expression. Knock down of Hnf1β in mpkDCT cells significantly reduced the expression of Kcnj16 (Kir5.1) and Kcnj10 (Kir4.1) by 38% and 37%, respectively. These results were confirmed in a HNF1β renal knockout mouse, exhibiting downregulation of Kcnj16, Kcnj10 and Slc12a3 transcripts in the kidney by 78%, 83% and 76%, respectively, compared to HNF1β wild-type mice.
In conclusion, HNF1β has been identified as a transcriptional activator of Kcnj16. Consequently patients with HNF1β mutations may have a reduced Kir5.1 activity in the kidney, resulting in hypokalemia and hypomagnesemia.
Keywords: HNF1β, Kir4.1, Kir5.1, ADTKD-HNF1β, hypomagnesemia, potassium, magnesium, chIP-seq
Introduction
Heterozygous deletion or mutation of hepatocyte nuclear factor 1 homeobox B (HNF1β) causes autosomal dominant tubulointerstitial kidney disease (ADTKD-HNF1β, OMIM: 137920),1 comprising a wide variety of renal and extra-renal disorders. Although the symptoms have incomplete penetrance, the most common clinical phenotype is renal malformation combined with maturity-onset diabetes of the young (MODY5).1–5 However, patients can also present with genital tract malformations,6, 7 pancreatic hypoplasia,8 abnormal liver functioning,9 electrolyte disturbances,4, 10 and hyperparathyroidism.11 This makes ADTKD-HNF1β a multi-systemic disorder with a highly heterogeneous phenotype that is difficult to diagnose in the clinic.
Careful phenotyping of the electrolyte disturbances observed in ADTKD-HNF1β patients led several clinicians to conclude that the phenotype is reminiscent of Gitelman syndrome (OMIM: 263800). The shared symptoms include hypomagnesemia and hypokalemia, although hypocalciuria and metabolic alkalosis are less frequently observed.4, 5, 10, 12 In Gitelman syndrome, inactivating mutations in the sodium-chloride-cotransporter (NCC) decrease Na+ and Mg2+ transport in the DCT and increase K+ secretion further downstream.13, 14 Similarly, in SeSAME/EAST syndrome (OMIM: 612780) loss of function mutations in the Kir4.1/Kir5.1 inward-rectifying K+ channel are causative for hypomagnesemia and hypokalemia.15–17 Whether mutations in HNF1β affect NCC or Kir4.1/Kir5.1 remains to be elucidated.
Over the last decade, several transcriptional targets of HNF1β have been identified, including UMOD, PKHD1 and FXYD2.18–20 Specifically FXYD2 has been implicated in the electrolyte disturbances observed in ADTKD-HNF1β. FXYD2 encodes for the γ-subunit of the Na+-K+-ATPase and as such regulates the basolateral membrane potential.4, 20 Indeed, heterozygous mutations in FXYD2 are known to cause autosomal dominant hypomagnesemia with hypocalciuria (OMIM: 154020).21, 22 Whether the regulation of FXYD2 by HNF1β is sufficient to explain the symptoms in ADTKD-HNF1β is being questioned.23 Current studies on HNF1β binding sites depend mainly on bioinformatical identification of the HNF1β recognition sequence in gene promoters. The complete genome-wide spectrum of HNF1β binding sites in the distal convoluted tubule (DCT) is not known.
The aim of our study was to elucidate the role of HNF1β in DCT electrolyte reabsorption. To this end, a genome-wide DNA binding profile for HNF1β was acquired by performing a chromatin immunoprecipitation followed by next generation sequencing (chIP-seq). Kir5.1 was identified as a prime candidate and its regulation by HNF1β was characterized by luciferase promoter assays and siRNA knock down experiments. Moreover, using renal-specific HNF1β knockout mice, the transcriptional effects of HNF1β were examined in the kidney.
Results
HNF1β is expressed in the distal convoluted tubule
Immunohistochemistry of mouse kidney was performed to examine the HNF1β localization and expression. HNF1β was located to the nuclei of tubular cells (Figure 1), and was absent in the interstitium and glomerulus. HNF1β is expressed with DCT marker Parvalbumin in the distal convoluted tubule.
Figure 1. Hnf1β is expressed in the distal convoluted tubule.

Immunohistochemical stainings of mouse kidney sections were co-stained with anti-HNF1β in green (top right), anti-Parvalbumin in red, (lower left) and 4′, 6-diamidino-2-phenylindole (DAPI) in blue (top left). A merged image is shown in the lower right. Scale bar: 100 μm.
HNF1β chIP-seq binding sites are specific for the HNF1β motif
Genome-wide HNF1β binding sites were identified by performing chromatin-immunoprecipitation and sequencing (chIP-seq) on mpkDCT cells. Chromatin was isolated, cross-linked and immunoprecipitated with an anti-HNF1β antibody. After de-crosslinking, samples underwent next-generation sequencing. Binding sites were found by comparing enriched immunoprecipitated genomic sequences to an untreated input control (genomic background). In total, 7421 HNF1β binding sites were significantly enriched over background (false discovery rate (FDR); q<0.001). Of which 4530 genes contained an HNF1β peak within 50kb of their respective transcription start sites (TSS). To determine whether these binding sites are near actively transcribed genes, a chIP-seq with an antibody against histone 3 lysine 4 trimethyl (H3K4me3) was performed. Of note: H3K4me3 is a histone marker for active TSS 24. 43.5% of all HNF1β binding sites could be assigned to actively transcribed genes, determined by the presence of H3K4 trimethylation. 28.5% of HNF1β binding peaks were linked to H3K4me3 negative genes and the remaining 28% were located to intergene regions (Figure 2A). The nucleotide sequence of HNF1β binding sites in our analysis corresponds to the database motif nRTTAATnATTAACn for HNF1β binding (JASPAR database ID: MA0153.2), showing high specificity and sensitivity of the chIP-seq (Figure 2B–D). Furthermore, HNF1β bindings sites were identified in promoters of several known targets of HNF1β, for example Pkhd1 and Pcbd1 (Figure 2E).
Figure 2. HNF1β chIP-seq binding sites are specific for the HNF1β motif and known HNF1β target genes.

a) Pie chart showing HNF1β peaks assigned to genes in a 50 kb window around the TSS. In total 7421 peaks were called (q<0.001). The percentage of H3K4me3 positive genes is depicted in black, H3K4me3 negative genes are shown in white and peaks that could not be assigned to a gene are portrayed in the grey segment. b) Left, sequence logo of the HNF1β motif found with the GimmeMotifs algorithm in our chIP-seq dataset. Right, HNF1β sequence logo acquired from the JASPAR database (ID: MA0153.2). c) Histogram showing the HNF1β motif specificity score in relation to HNF1β peak height. Peaks were sorted by peak height in descending order and divided into quartiles (q1–4). Data (n=1855 per quartile) represent the mean ± SEM HNF1β motif specificity score. One-way ANOVA with Holm-Sidak correction, *, p<0.05. d) Positional preference plot indicates HNF1β peak frequency in relation to the motif position. The x-axis is the relative distance to the central position of the analyzed motif. e) HNF1β and H3K4me3 binding profile for two known targets of HNF1β, respectively Pkhd1 (left) and Pcbd1 (right).
HNF1β peaks are significantly enriched in putative promoter regions
Cis-regulatory element annotation system (CEAS) was used to quantify peak distribution along the genome (Figure 3A). This method assesses the percentage of Hnf1β binding sites found in upstream promoters, distal sites or the gene body 25. A significant 1.78 fold (p<0.001) enrichment in HNF1β peaks was observed in a range of 3 kb upstream from the TSS of putative promoter regions, compared to genomic background (Figure 3A). No enrichment was found in regions <3 kb distal from the TSS. HNF1β peak enrichment was significantly lower in the gene body, which consists of the coding exons, introns, 5′UTR and 3′UTR. Hierarchical clustering with Euclidean distance metric was performed to assess the amount of overlap of HNF1β peaks with H3K4me3 peaks. Within a window of ±10 kb surrounding H3K4me3 peaks, most HNF1β binding sites were located either upstream or more distal from enriched H3K4 trimethylation binding sites indicating limited overlap with H3K4 trimethylation positive promoter regions (Figure 3B).
Figure 3. HNF1β peaks are significantly enriched in putative promoter regions.

a) Distribution of HNF1β peak location relative to RefSeq genes. Promoter indicates all HNF1β peaks that are <3 kb upstream from the TSS. Downstream refers to enrichment of HNF1β peaks over genomic background in <3 kb downstream from the TSS. A significantly lower enrichment of HNF1β peaks over genomic background is shown in the gene body. The gene body includes all exons, introns, 5′ UTR and 3′ UTR. One-sided binominal test *, p<0.01. b) Heatmap of HNF1β and H3K4me3 chIP-seq signal in a 10 kb window around HNF1β peak regions using hierarchical clustering with Euclidean distance metric. Rows in the heatmap represent individual peak regions. Left, all HNF1β peaks are centered in the middle of the map. Most HNF1β peaks are located >10 kb upstream or distal locations from H3K4me3 positive promoters.
HNF1β shows enrichment of the MODY and type II diabetes pathways
Kyoto Encyclopedia of Genes and Genomes (KEGG) pathway analysis was performed on genes positive for HNF1β binding sites.26 A significant enrichment for MODY and type II diabetes pathway was detected (Supplementary figure 1A). Interestingly, HNF1β peaks were located near the transcription start sites of genes related to diabetes, including Hnf1α, Irs1 and Irs2 (Supplementary figure 2). Subsequent gene ontology (GO) analysis showed enrichment of ‘ion binding’ (GO:0043167), ‘calcium’ (GO:0005509) and ‘magnesium ion binding’ (GO:0000287) GO-terms (Supplementary figure 1B).
HNF1β enhances activation of the Kcnj16 promoter
Since patients with ADTKD-HNF1β suffer from a Gitelman-like phenotype, genes involved in Mg2+, Na+ and K+ reabsorption were specifically analyzed. A highly enriched peak was located in the promoter of Kcnj16 (Kir5.1), which is an important subunit of the Kir4.1/Kir5.1 inward rectifying K+ channel (Figure 4A). The peak was found 60 base pairs (bp) in front of the TSS and displays high nucleotide conservation (Figure 4B). Furthermore, it shows relatively high motif conservation with a motif specificity score of 5.26, obtained by the ‘screen motif’ algorithm.27 Placing this binding site in the 15% of HNF1β peaks (n=7421) with the highest motif specificity scores (Supplemental table 1). To confirm the reproducibility of HNF1β binding, the binding site was validated separately with chromatin immunoprecipitation and real time quantitative PCR and demonstrated 15-fold enrichment over background (Supplementary figure 3). Subsequently, luciferase constructs containing the human promoter for KCNJ16 including the HNF1β binding site were expressed in Human Embryonic Kidney cells (HEK293). HNF1β increased KCNJ16 promoter activity 2.2-fold compared to mock transfected cells (Figure 4C). Subsequently, we examined the effect of a HNF1β p.Lys156Glu mutant that was previously reported in a patient with renal cysts and MODY.4, 28 HNF1β p.Lys156Glu did not raise KCNJ16 or FXYD2a promoter activity.
Figure 4. HNF1β enhances activation of the Kcnj16 promoter.

a) HNF1β binding profile for Kir5.1 in mpkDCT cells. Underneath is a linear representation of the location of the promoter, Hnf1β binding site and H3K4 trimethylation site in relation to the exons of Kir5.1 for both mouse and human. A black rectangle denotes the HNF1β binding site. b) Alignment of the HNF1β peak at −60 bp from the TSS of different species revealed a highly conserved binding site. c) HEK293 cells were transiently transfected with a luciferase construct carrying the Kcnj16 promoter with the HNF1β binding site. Luciferase constructs with Fxyd2a were transfected as a positive control and an empty vector was added as negative control. Promoter activity was tested with (white bars), without (black bars) or with mutant (striped bars) HNF1β stimulation. Data (n=3) represent mean ± SEM. *, p<0.05, compared with non-stimulated condition.
Knockdown of HNF1β downregulates Kcnj16 and Kcnj10
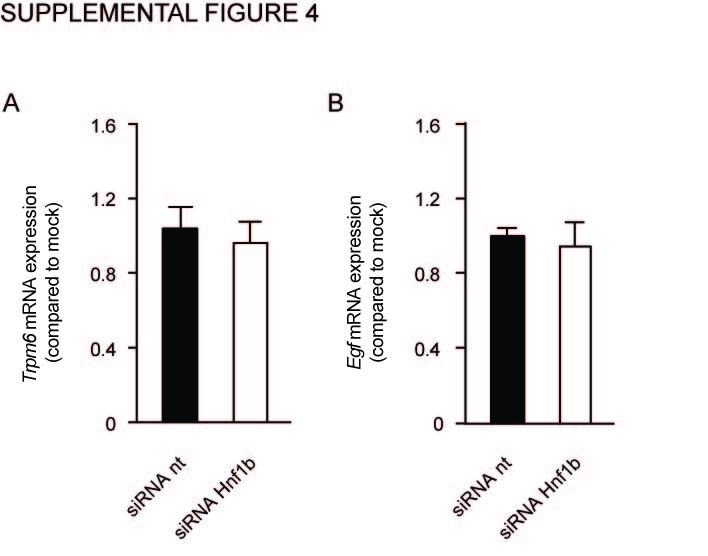
To further substantiate the transcriptional activation of Kcnj16 by HNF1β, mpkDCT cells were transfected with siRNA targeting Hnf1β. RT-PCR analysis demonstrated a significant 42±28% decrease in Hnf1β transcript compared to a non-targeting siRNA (Figure 5A). Kcnj16 mRNA levels were significantly decreased by 38±23%, (Figure 5B). Moreover, the expression of Kcnj10, encoding Kir4.1, and the EGF-receptor (Egfr) were downregulated with 37±13% and 36±23% respectively (Figure 5C and D). Transient receptor potential cation channel, subfamily M member 6 (Trpm6) and Epidermal growth factor (Egf) expression were not significantly altered (Supplementary figure 4). Fxyd2a was significantly downregulated by 60±20% in the absence of HNF1β, whereas Fxyd2b transcript levels were not affected (Figure 5E and F). Due too low Slc12a3 transcript levels in the mpkDCT cells available to us, we were not able to reliably measure Slc12a3 transcript abundance.
Figure 5. Knockdown of Hnf1β causes downregulation of Kcnj16 and Kcnj10.

a–f) The mRNA expression levels of Hnf1β (A), Kcnj16 (B), Kcnj10 (C), Egfr (D), Fxyd2a (E), Fxyd2b (F) in mpkDCT cells treated with either non-targeting (nt) (black bars) or Hnf1β targeting (white bars) siRNAs. Samples were measured by quantitative RT-PCR and normalized for Gapdh expression. Data (n=3) represent mean ± SEM and are expressed as the fold difference when compared to the expression in siRNA nt.
HNF1β regulates Kcnj16, Kcnj10 and Slc12a3 in a HNF1β mutant mouse model
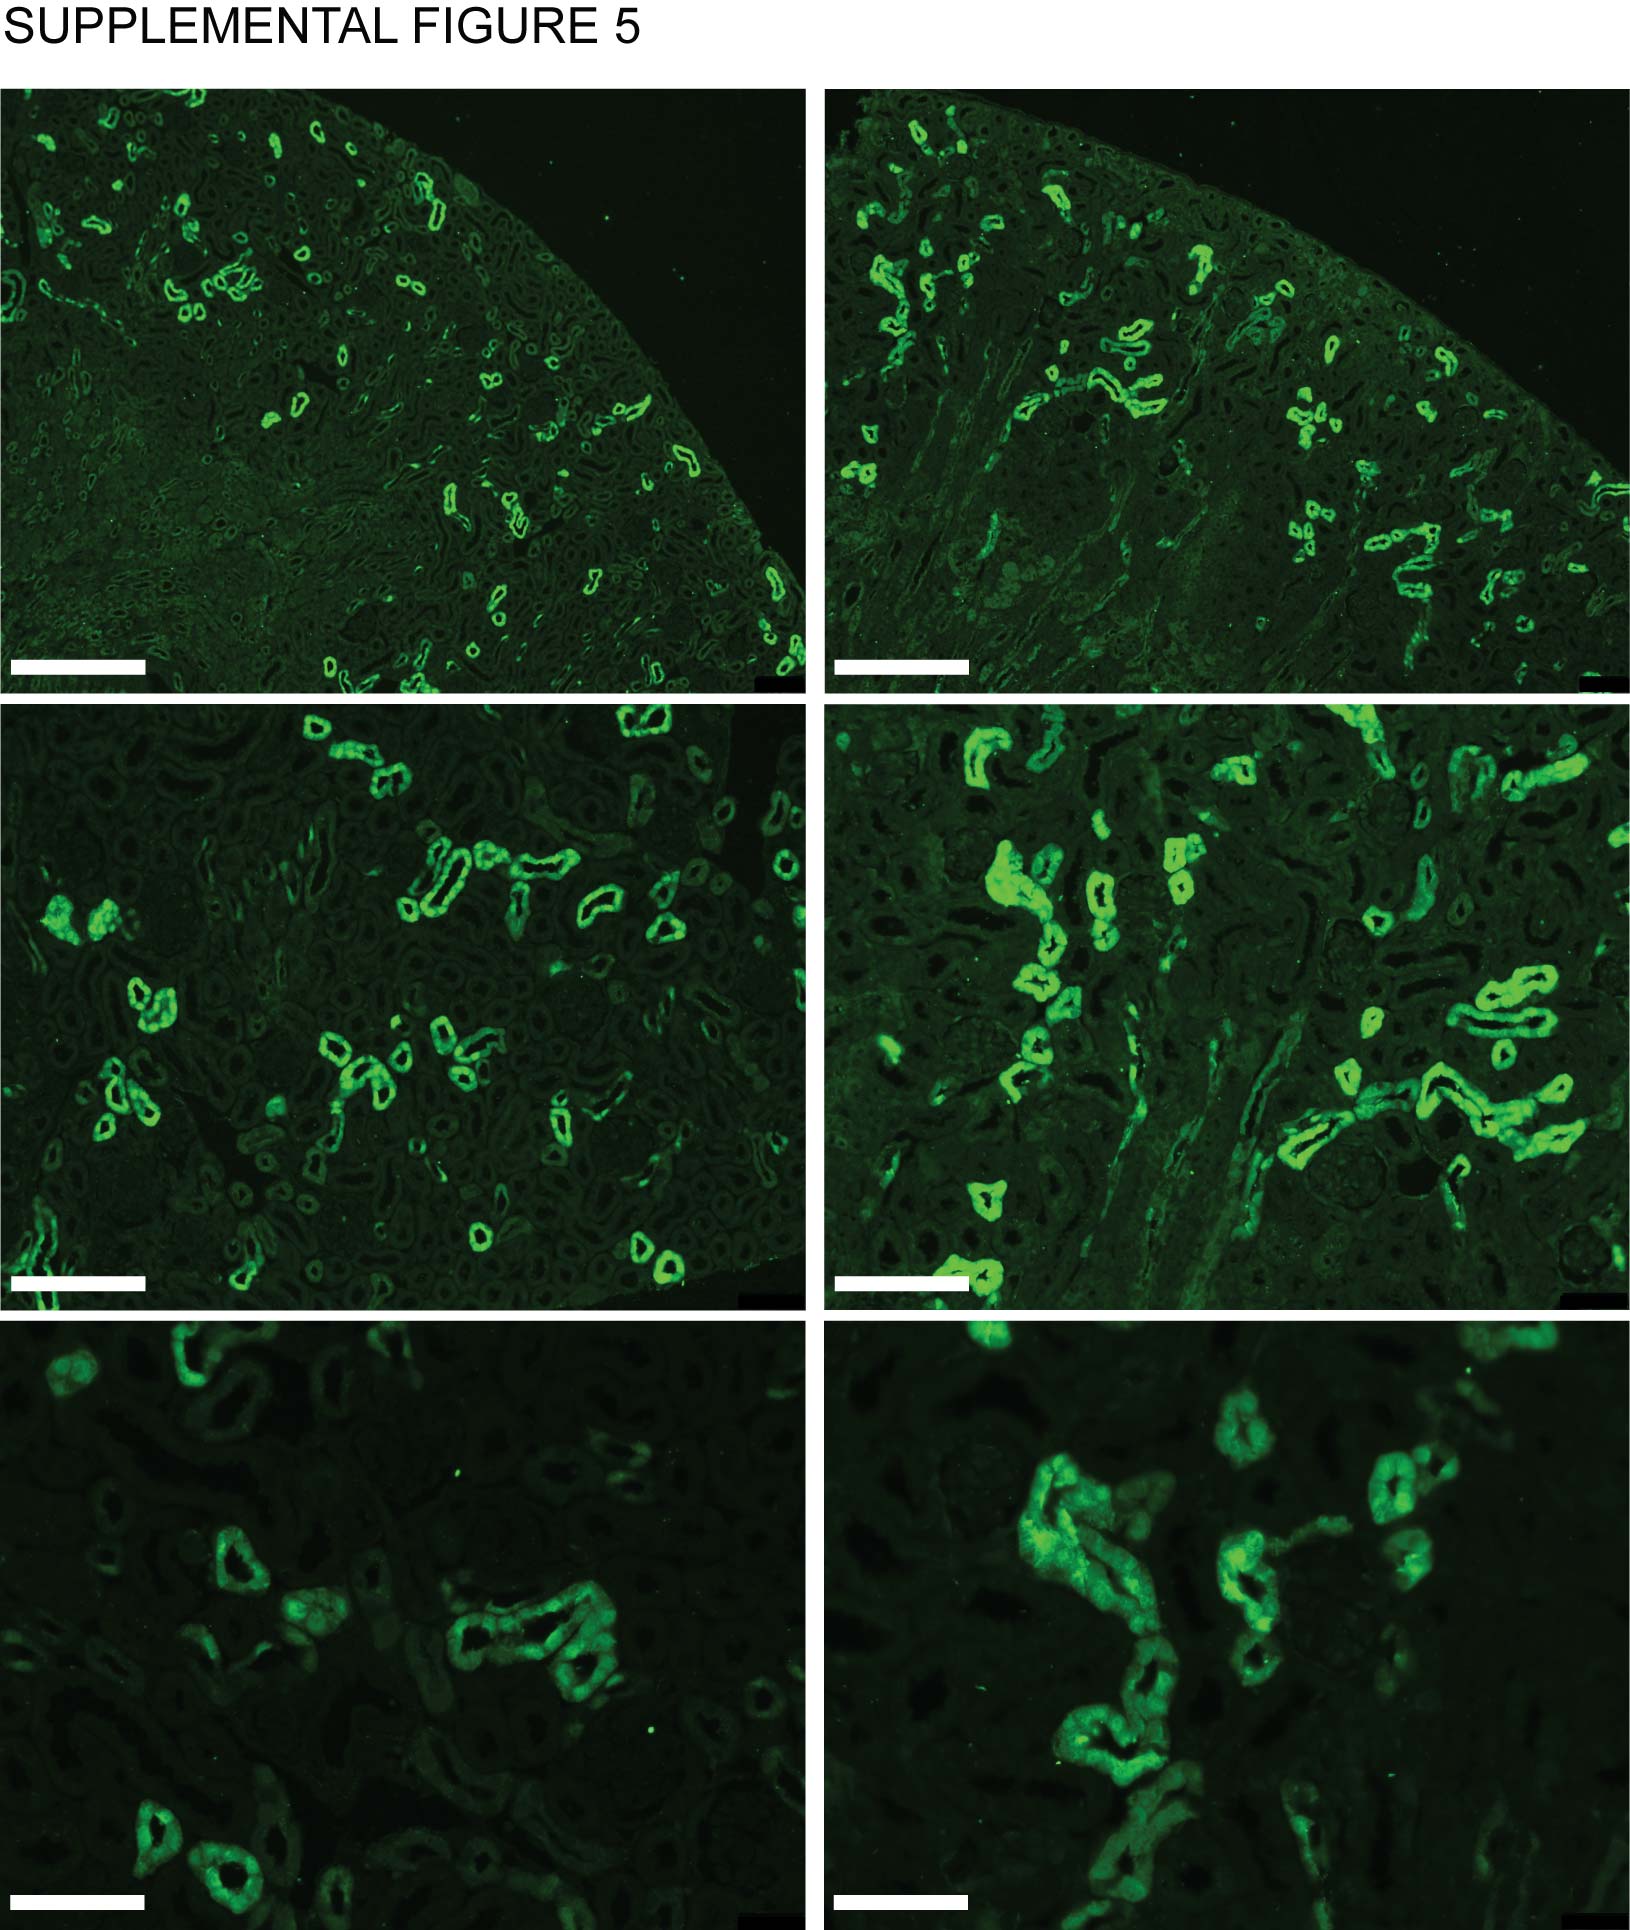
To further substantiate that genes involved in electrolyte handling in the DCT are regulated by HNF1β, RT-PCR analysis for the expression of several genes was performed on RNA isolated from kidneys of Ksp-Cre;Hnf1βflox/flox mice (n=3). In these mice, Hnf1β is specifically inactivated in renal distal tubules.29 This kidney-specific inactivation of Hnf1β significantly (p<0.05) decreased the transcript expression of Kcnj16, Kcnj10 and Slc12a3 in the kidney by 78±30%, 83±30% and 76±22%, respectively (Figure 6A, B and C). The expression of well-know HNF1β target Pkhd1 was determined as a positive control and shown to be significantly reduced in HNF1βfl+/fl+ mice by 66±12% (Figure 6D). No significant reduction was observed for other DCT genes, including Trpm6 and the Egfr (Figure 6E and F). To exclude hypothrophy of the DCT as a cause for the decrease in transcript abundance, kidney slices from Ksp-Cre;Hnf1βflox/flox mice were stained for the DCT-specific marker parvalbumin. A qualitative assessment did not detect differences between HNF1βfl-/fl- wild type and HNF1βfl+/fl+ mutant mice (Supplemental figure 5).
Figure 6. Kcnj16, Kcnj10 and Slc12a3 transcripts are reduced in a HNF1β mutant mouse model.

a–f) The mRNA expression levels of Hnf1β (A), Kcnj16 (B), Kcnj10 (C), Egfr (D), Fxyd2a (E), Fxyd2b (F) in Ksp-Cre;Hnf1βflox/flox mouse kidneys. The black bars represent Hnf1βfl-/fl- wild-type mice, while the white bars represent Hnf1βfl+/fl+ knockout mice. Samples were measured by quantitative RT-PCR and normalized for 18s ribosomal RNA expression. Data (n=3) represent mean ± SEM and are expressed as the fold difference when compared to the expression in Hnf1βfl-/fl- wild-type mice.
Discussion
The present study provides a genome-wide screening of HNF1β binding sites in a mouse DCT cell line. Our results indicate that HNF1β induces transcription of Kcnj16 (Kir5.1) and thereby regulates ion reabsorption in the DCT. This conclusion is based on the following findings: i) a highly enriched and conserved HNF1β-binding site was found in the promoter region of Kcnj16; ii) HNF1β, and not a HNF1β mutant, enhanced the promoter activity of Kcnj16 in a luciferase assay; iii) knock down of Hnf1β in mpkDCT cells resulted in decreased expression of Kcnj16 (Kir5.1) and Kcnj10 (Kir4.1); iv) reduced expression of Kcnj16 and Kcnj10 transcript in HNF1β renal knockout mice compared to wild-type mice.
ChIP-seq was used to elucidate HNF1β binding sites at a genome-wide scale allowing the identification of novel HNF1β-regulated genes in the kidney. In total ~7400 binding sites were identified of which most were attributed to putative promoter regions. The strong overlap of the nucleotide binding sequence in our experiments with the signature HNF1β-binding sequence indicates the high specificity of the data set (JASPAR database ID: MA0153.2). Moreover, HNF1β-binding peaks were located near known HNF1β target genes Pkhd1 and Pcbd1.19, 30 Among others, MODY genes were enriched in the KEGG pathway analysis. Although our experiments were aimed at studying renal electrolyte transport, the genome-wide scale and high specificity of this dataset also allowed for the identification of HNF1β-binding sites near genes related to diabetes (e.g. Irs1, Irs2). The complete dataset is available via GEO (Accession: GSE77397).
The main result of our study is the identification of Kir5.1 as a novel target of HNF1β-induced transcription. Kir5.1 was first cloned in 1994 and subsequently shown to form heteromeric complexes with Kir4.1 in the kidney, rendering the channel pH sensitive.31, 32 Kir5.1 has no channel properties per se and requires Kir4.x subunits for functioning.31 In kidney, Kir4.1-Kir5.1 complexes are expressed in the DCT and cortical collecting duct, where they regulate Na+-K+-ATPase activity by recycling K+ at the basolateral membrane.33, 34
The HNF1β binding site in the Kir5.1 promoter is highly conserved among species and is 15-fold enriched in our chIP-Seq dataset. HNF1β clearly increased the Kir5.1 promoter activity, indicating a direct transcriptional regulation of Kir5.1 in mpkDCT cells. Importantly, expression of the HNF1β-p.Lys156Glu mutant, that was identified in ADTKD-HNF1β patients, did not activate Kir5.1 transcription.11 It is likely that this point mutation, which is located in the DNA binding domain of HNF1β, causes a dominant-interfering effect, hampering the binding of HNF1β to the DNA. In literature no evidence is reported for an altered phenotype between intragenic HNF1β mutations or whole-gene deletions, which would be consistent with haploinsufficiency as the underlying disease mechanism.35, 36 However, more recent data revealed that patients with an intragenic HNF1β mutation suffer from significantly increased renal impairment and have a reduced glomerular filtration rate (GFR) compared to patients with a whole-gene deletion.37, 38 This indicates that in the case of intragenic HNF1β mutations, there might be an additional interfering effect of the mutant on the function of the HNF1β WT allele. The physiological effect of HNF1β binding to the Kir5.1 promoter was further investigated and confirmed in a HNF1β knockdown experiment. Kir5.1 expression decreased in mpkDCT cells after transfection with siRNA targeting Hnf1β.
To understand the physiological role of HNF1β-dependent regulation of Kir5.1 mouse models are important tools. Our renal-specific HNF1β knockout animals confirmed the in vitro data, since Kcnj16 (Kir5.1) mRNA expression was reduced in HNF1β knockout mice in comparison to wild type mice. Given the early postnatal lethality of the animals, urinary measurements to examine physiological effects of Kir5.1 knockdown are not possible in the HNF1β mouse model.18 However, Kir5.1−/− mice were reported to suffer from urinary K+ and Mg2+ wasting, which was partially reflected in lower plasma K+.39 Although, a mechanism that explains urinary wasting of both Mg2+ and K+ in the Kir5.1−/− mouse remains elusive. Indeed, both urinary Mg2+ and K+ wasting are key features of ADTKD-HNF1β patients.
In addition to Kir5.1, HNF1β knockout animals also displayed reduced transcripts of Kir4.1 and NCC. These results suggest that the HNF1β phenotype is more extensive than Kir5.1 downregulation alone. Our results did not identify the cause for reduced Kir4.1 or NCC expression. The ChIP-seq experiments showed that HNF1β binding sites are not present in or near the promoter region of Slc12a3 or Kcnj10 and therefore direct regulation of NCC and Kir4.1 expression by HNF1β seems unlikely. Reduced K+ channel Kir4.1/Kir5.1 expression may impair electrolyte transport at the basolateral membrane of the DCT, resulting in reduced NCC activity and transcription. This is in line with Kir4.1 knockout mice that demonstrate decreased abundance and functioning of NCC, altogether resulting in hypokalemia and renal Mg2+ wasting.40 Furthermore, Kir4.1-deficient mice displayed a blunted response to hydrochlorothiazides confirming reduced NCC activity. Interestingly, ADTKD-HNF1β patients display a similar decreased response to hydrochlorothiazide,41 further pointing towards NCC involvement in HNF1β disease. From both the clinical and animal experiments, it cannot be excluded that DCT size is affected. However, histological analysis of the renal-specific HNF1β knockout animals demonstrates that morphological defects are mainly located in the renal medulla leaving the cortex largely unaffected.18 Moreover, Trpm6 expression is not significantly altered in the HNF1β knockout mice and no differences in DCT marker parvalbumin abundance or intensity was detected when comparing HNF1β wild type and knockout animals, suggesting normal DCT development (Supplemental figure 5). Decreased electrolyte reabsorption in DCT, caused by a decreased functioning of the Kir4.1/Kir5.1 potassium channel, could induce an effacement of the basolateral membrane of the DCT, as observed in the renal biopsy of an EAST patient.15 It is, therefore, conceivable that aberrant Kir4.1/Kir5.1 channel functioning can cause changes in DCT morphology. Although this has, as of yet, not been reported in HNF1β patients.
The strength of our study is the genome-wide approach to identify novel HNF1β binding sites. Performing a chIP-seq assay allowed for a highly specific identification of all HNF1β binding sites within the DCT. Furthermore, by including a kidney-specific HNF1β knockout mouse model, our findings were confirmed in vivo, which further substantiated the in vitro findings. An important limitation of this study is the early postnatal lethality of the kidney-specific HNF1β knockout animals. DCT-specific knockout of HNF1β would be necessary to further examine the role of HNF1β in the DCT. However, these animals are currently not available.
In conclusion, by using a genome-wide screen for HNF1β targets in a DCT specific cell line, a novel HNF1β binding site was identified in the Kcnj16 promoter. We established that HNF1β regulates Kcnj16 gene transcription in vitro and in vivo. Therefore, our findings provide valuable new insights inside the mechanism behind the electrolyte imbalance in ADTKD-HNF1β patients.
Methods
Cell lines and animals
HEK293 cells were grown in Dulbecco’s modified Eagle’s medium (Lonza, Leusden, The Netherlands) containing 10% (v/v) fetal calf serum (FCS), 2 mM L-glutamine at 37 °C in a humidity controlled incubator with 5% (v/v) CO2. MpkDCT4a were cultured as described previously.42 Distal tubule-specific inactivation of HNF1β was achieved using Cre/LoxP recombination by crossing Ksp-cadherin Cre mice with Hnf1βflox/flox.18 Cre/LoxP activity varies along the nephron and ensures HNF1β inactivation for 27% in the proximal tubule, 99% in the thick ascending limb (TAL), 92% in the DCT/CNT and 100% in the collecting duct.43 All animal procedures were performed in accordance with the guidelines of the Institutional Animal Care and Use Committees of the University of Texas Southwestern Medical Center and the University of Minnesota Medical School.
Immunohistochemistry (IHC)
Immunohistochemistry was performed as previously described.44 In short, stainings for Hnf1β were performed on 4 μm sections of formalin fixed and paraffin embedded mouse kidney samples. Sections were incubated for 16 hours at 4 °C in rabbit anti-HNF1β (Santa Cruz Biotechnology, Santa Cruz, CA) 1:1000 and goat anti-Parvalbumin 1:2000 (Santa Cruz Biotechnology, Santa Cruz, CA). For detection, samples were incubated with an Alexa 594-conjugated donkey anti-goat antibody 1:300 (Thermo Scientific, Amsterdam, The Netherlands) and a biotin-conjugated swine anti-rabbit antibody 1:2000. Subsequently, samples were incubated with streptavidin-HRP 1:100 and fluorescein-tyramide 1:50 using the TSA Fluorescein System (PerkinElmer, Groningen, The Netherlands). Cell nuclei were stained with DAPI (1:20,000) for 10 min at RT. Images were taken with an AxioCam MRm camera (Zeiss, Sliedrecht, The Netherlands). For the IHC in HNF1βflox/flox mice, kidneys were isolated at p14 and fixed in 4% paraformaldehyde and then embedded in paraffin. Sections were incubated for 16 hrs at 4 °C in goat anti-parvalbumin 1:50 (Santa Cruz Biotechnology, Santa Cruz, CA) and goat donkey-goat alexa 488 1:1000 (Invitrogen, Breda, The Netherlands) for 2 hrs at room temperature. Cell nuclei were mounted and stained with ProLong Gold antifade with DAPI (Invitrogen). Slides were visualized under a Leica DM5500 B upright microscope with DFC7000 T camera (Leica).
ChIP-seq
Chromatin was isolated from mpkDCT4a cells by fixing with 1% (v/v) formaldehyde (Ultra-Pure) (Thermo scientific) for 15 min at RT. Cells were washed and permeabilized in 0.25% (v/v) triton-X-100 and 0.05% (v/v) SDS. Samples were sonicated in a Diagenode bioruptor (Diagenode, Ougrée, Belgium), 50 times 30 seconds on 30 seconds off at high intensity. Chromatin samples were then immunoprecipitated with Protein A/G beads (Santa Cruz Biotechnology, Santa Cruz, CA) in either 5μg rabbit anti-Hnf1β (Santa Cruz Biotechnology, Santa Cruz, CA) or rabbit anti-H3K4me3 (Abcam, Cambridge, UK) for 16 hours at 4 °C. Samples were de-crosslinked in 5 M NaCl at 65 °C for 5 hours. De-crosslinked samples were then purified with phenol-chloroform. Sample preparation was performed according to the manufacturers protocol (Illumina, Eindhoven, The Netherlands). In short, adaptor sequences were linked to the generated chIP samples. The library was size selected (200–250 bp) and amplified by PCR. Sequencing was completed on an Illumina HiSeq 2000 (Illumina, Eindhoven, The Netherlands). Peak calling was executed with Macs2, q-value (False discovery rate, FDR) 0.001. Hnf1β peak distribution within genomic features was accomplished with CEAS as a part of the Galaxy/Cistrome toolbox.25, 27 Promoters were defined as <3 kb regions upstream of the TSS. Whereas downstream regions were <3 kb downstream of the TSS. The gene body includes all exons, introns, 5′ UTR and 3′ UTR. Significant enrichment over background was tested with a one-sided binominal test. Hierarchical clustering with Euclidean distance metric was done for Hnf1β and H3K4me3 sequence reads in a window of ±10 kb surrounding Hnf1β peaks. Motif analysis was performed with the GimmeMotifs algorithm as described previously.45 All motifs found by the GimmeMotifs algorithm are described in Table 1. Motif specificity scores were obtained by performing a motif screen with the ‘screen motif’ algorithm from the Galaxy/Cistrome toolbox. 27 All matching motifs underneath HNF1β peaks were given a specificity score based on the resemblance to the positional weight matrix of the HNF1β motif derived from the JASPAR database (ID: MA0153.2). 27 As HNF1β has a tendency to bind ATAT repeats, some motifs besides the HNF1β motif were enriched. However these additional motifs had lower specificity scores, proving less significant than the HNF1β motif (Table 1).
Table 1.
Motifs found by the GimmeMotifs algorithm underneath HNF1β binding sites.
| ID | Consensus | Database match | P-value |
|---|---|---|---|
| GimmeMotifs_13 | TAAATAAATAAATAAATAAATAAAT | Foxg1_DBD_ATAAACAAGTRTAAACA | 0.98 |
| GimmeMotifs_14 | AwwTAwwTAwwTAwwTAwwTA | POU6F2_DBD_WTAATKAGCTMATTAW | 0.39 |
| GimmeMotifs_15 | TAAATAAATA | Foxc1_DBD_GTAAAYAAACA | P>0.01 |
| GimmeMotifs_16 | TnGTTAATnATTnA | HNF1B_full_NRTTAATNATTAACN | P>0.01 |
| GimmeMotifs_3 | sArGmCAGC | TGIF1_DBD_TGACAGSTGTCA | P>0.01 |
| GimmeMotifs_8 | CCAGrAsAGs | MA0092.1_Hand1::Tcfe2a | 0.08 |
| GimmeMotifs_7 | rGCTACAGwG | Osr2_pwm_primary_SCI09 | P>0.01 |
| GimmeMotifs_17 | TTAATnATTAAy | HNF1A_full_NRTTAATNATTAACN | P>0.01 |
| GimmeMotifs_1 | CyCTsyCyy | Esrra_pwm_secondary_SCI09 | P>0.01 |
| GimmeMotifs_12 | GTCTGAAGAC | BATF3_DBD_TGATGACGTCATCA | 0.05 |
| GimmeMotifs_4 | CAGGCTGGCC | MA0112.2_ESR1 | p>0.01 |
| GimmeMotifs_6 | mTkkAnTnrwAnkkAAnnGAATGGAATGnAnTrkAwwGkwATGGmATr | Zfp410_pwm_primary_SCI09 | 0.18 |
| GimmeMotifs_10 | AGTACACTG | SOX10_full_AACAATRTKCAGWGTT | P>0.01 |
| GimmeMotifs_2 | AGCCCTGGC | Zfp691_pwm_primary_RC_SCI09 | P>0.01 |
| GimmeMotifs_9 | ynrCCAsyAGrkGGCrsyn | MA0139.1_CTCF | 0.0 |
| GimmeMotifs_5 | CCTGGAAC | MA0144.1_Stat3 | P>0.01 |
| GimmeMotifs_11 | CCCCmAAmCAmCCmCmmmC | MA0073.1_RREB1 | 0.0 |
| GimmeMotifs_18 | GGAAGGAAGGAAGGAAGG | MA0149.1_EWSR1-FLI1 | 0.0 |
ID; name assigned to the found motif by the GimmeMotifs algorithm. Consensus; the motif sequence found underneath HNF1β binding sites. Database match; depicts the protein and motif from the JASPAR database that optimally fits with the HNF1β dataset motif. P-value; shows whether the HNF1β dataset consensus significantly matches with the JASPAR database motif.
GO-term and KEGG pathway analysis
Gene set enrichment analysis (GSEA) software and the Molecular Signature Database (MSigDB) was used to obtain gene enrichment for both KEGG pathway and GO-term gene sets.46 A total of 2717 genes containing an Hnf1β peak within 50 kb from their respective TSS were used in the analysis. Gene set overlap was calculated for KEGG pathway analysis and GO ‘molecular function’ gene sets. Statistical significance (q<0.05) was determined using hypergeometric testing with a FDR correction.
Cloning
The human Kcnj16 promoter region (−998 bp upstream, +113 bp downstream from the TSS) containing the Hnf1β binding site was amplified from a human BAC-clone (RPCI-11.c 79M2, Source biosciences, Nottingham, UK) using a high fidelity DNA polymerase (Phusion, Thermofisher, Amsterdam, The Netherlands). The PCR product was digested with restriction enzymes KpnI and XmaI (New England Biolabs Ltd, Leiden, The Netherlands). The sequence was than ligated into a pGL3b vector in front of the luciferase gene using T4 DNA ligase (New England Biolabs Ltd, Leiden, The Netherlands). Primers used were; forward 5′-TCTAACAACCGTCAAACAGCAAC-3′ and reverse 5′-GCTAGGTGCTTTCAGCTGGG-3′. Human HNF1β full-length cDNA was amplified by PCR from HNF1β pCMV-SPORT6 (clone IRATp970A0421D), ImaGenes), and subcloned into the pCINeo IRES GFP expression vector. HNF1β p.Lys156Glu was obtained by site-directed mutagenesis (Stratagene, La Jolla, USA).20
Luciferase assay
HEK293 cells were transiently transfected with 700 ng of the promoter firefly luciferase constructs using polyethylenimine cationic polymer (PEI) (Invitrogen, Breda, The Netherlands) (ratio 1μg DNA to 6 μl PEI). Cells were transfected with a pGL3b-empty, pGL3b-hFxyd2a, pGL3b-hKcn16-promoter, or pGL3b-hKcnj16-promoter-bindingsite construct. All four conditions were additionally transfected with 50 ng of the pCINEO-empty, pCINEO-hHNF1β, or pCINEO-hHNF1β p.Lys156Glu mutant construct. For standardization of the transfection efficiency, 20 ng of Renilla luciferase plasmid CMV-pRL was used as a reference in all conditions. Firefly and Renilla luciferase activities were measured with the Dual-Luciferase Reporter Assay (Promega, Fitchburg, MA).
Quantitative Real-Time Polymerase Chain Reaction
MpkDCT cells were transiently transfected with 100 pmol of siRNA against Hnf1β (Dharmacon, Lafayette, USA).47 Cells were transfected using lipofectamine 2000 (Invitrogen, Breda, The Netherlands) adding 3 μl for each condition. After 48 hours, Total RNA isolation was performed with TRizol (Invitrogen, Breda, The Netherlands). 1.5 μg of RNA was used for reverse transcription using a M-MLV transcriptase protocol as described by the manufacturer (Invitrogen, Breda, The Netherlands). The cDNA was used to determine mRNA expression levels by CF96 Real-Time PCR detection system (Bio-Rad, Veenendaal, The Netherlands) for target genes of interest and of the housekeeping gene glyceraldehyde 3-phosphate dehydrogenase (Gapdh), as an endogenous control. Real-Time PCR primers are reported in Table 2.
Table 2.
Primer Sequences for RT-PCR
| Forward | Reverse | |
|---|---|---|
| 18S RNA | 5′-GTAACCCGTTGAACCCCATT-3′ | 5′-CCATCCAATCGGTAGTAGCG-3′ |
|
| ||
| Gapdh | 5′-TAACATCAAATGGGGTGAGG-3′ | 5′-GGTTCACACCCATCACAAAC-3′ |
| Kcnj16 | 5′-GACTTCCGACCAAACCATGTG-3′ | 5′-GTCATCCTCCCTTCACTGTC-3′ |
| Kcnj10 | 5′-CCGCGATTTATCAGAGC-3′ | 5′-AGATCCTTGAGGTAGAGGAA-3′ |
| Egfr | 5′-CAGAACTGGGCTTAGGGAAC-3′ | 5′-GGACGATGTCCCTCCACTG-3′ |
| Fxyd2a | 5′-GAACAGTGGTGGCAGTGCCAAG-3′ | 5′-GATCTGTCAGCGAACAGTG-3′ |
| Fxyd2b | 5′-GTACCTGGGTGGCAGTGCCAAG-3′ | 5′-CTACCATGGACAGGTGGTA-3′ |
| Trpm6 | 5′-AAAGCCATGCGAGTTATCAGC-3′ | 5′-CTTCACAATGAAAACCTGCCC-3′ |
| proEgf | 5′-GAGTTGCCCTGACTCTACCG-3′ | 5′-CCACCATTGAGGCAGTATCC-3′ |
| Slc12a3 | 5′-CTTCGGCCACTGGCATTCTG-3′ | 5′-GATGGCAAGGTAGGAGATGG-3′ |
18S RNA, 18S Ribosomal RNA; Gapdh, glyceraldehyde 3-phosphate dehydrogenase; Kcnj16, ATP-sensitive inward rectifier potassium channel 16; Kcnj10, ATP-sensitive inward rectifier potassium channel 10; Egfr, epidermal growth factor receptor; Fxyd2a–b, FXYD domain containing ion transport regulator 2a–b; Trpm6, transient receptor potential cation channel, subfamily M, member 6; Egf, epidermal growth factor; Slc12a3, solute carrier family 12, member 3.
Real-time qPCR on Ksp-Cre;Hnf1βflox/flox kidneys
Total RNA from postnatal day 28 adult wild–type or HNF1β mutant mouse kidneys was extracted using the RNeasy Mini Kit (Qiagen, Germantown, MD) according to the manufacturer’s protocol. RNA was treated with DNAse (Invitrogen, Breda, The Netherlands) and cDNA was synthesized using superscript III first strand synthesis kit (Invitrogen, Breda, The Netherlands). cDNA was diluted 1:20 and 10 μl was used in the real time qPCR reaction. Real-time qPCR was performed with the iTAG Universal SYBER Green Supermix (Bio-Rad, Veenendaal, The Netherlands) using the CFX Connect Real-Time System (Bio-Rad, Veenendaal, The Netherlands). 18S ribosomal RNA was used as an endogenous control. Real-Time PCR primers are listed in Table 2.
Data analysis
All results presented are based on at least three different experiments. Values are expressed as mean ± SEM. Statistical significance (P<0.05) was determined using one-tailed Students T-test or one-way ANOVA with Holm-Sidak procedure. Data was deposited in NCBI GEO (Accession: GSE77397).
Supplementary Material
HNF1β chip-seq shows enrichment of the MODY and type II diabetes pathways and has novel bindings sites in known cystic and diabetes genes
a) KEGG pathway analysis was performed on genes with a HNF1β binding site in a window of 50 kb surrounding the TSS. The x-axis shows the –log q-value for each identified KEGG pathway. The q-value is adjusted with a FDR correction. b) GO-term molecular function analysis was performed on genes that had an Hnf1β peak in a window of 50 kb surrounding the TSS. The x-axis shows the −log q-value for each significant pathway. The q-value is adjusted for multiple comparisons with a FDR correction.
Novel HNF1β binding sites are found in known diabetes genes.
a–d) Screenshots of the UCSC genome browser for Hnf1α, Irs1 and Irs2 reveals HNF1β binding sites (upper track) near the H3K4me3 enriched transcription start sites (bottom track) of these genes.
The novel HNF1β binding site in the Kcnj16 promoter is significantly enriched in mpkDCT cells.
a) HNF1β ChIP samples of mpkDCT samples were used to verify the HNF1β binding site in the Kcnj16 promoter. The Pkhd1 binding site was used as a positive control. Samples were measured by quantitative RT-PCR. Data represent mean ± SEM and are expressed as fold enrichment over background. The cutoff for sufficient enrichment of the binding site was set at 10 fold enrichment over background. The background signal was determined at genomic coordinates GRCm38 chr15:99578842–99579015.
Knockdown of Hnf1β has no effect on the transcription of Trpm6 and Egf
a–c) The mRNA expression levels of Trpm6 (A) and Egf (B) in mpkDCT cells treated with either non-targeting (nt) (black bars) or Hnf1β targeting (white bars) siRNAs. Samples were measured by quantitative RT-PCR and normalized for Gapdh expression. Data (n=3) represent mean ± SEM and are expressed as the fold difference when compared to the expression in siRNA nt.
No difference in DCT marker Parvalbumin abundance and intensity between HNF1βfl-/fl- wild type and HNF1βfl+/fl+ knockout mice.
Representative images are displayed of kidney slices derived from a HNF1βfl-/fl- wild type (left) and a HNF1βfl+/fl+ knockout mouse (right) at various magnifications 10x (top), 20x (middle) and 40x (bottom). Parvalbumin is shown in green and DAPI in blue. Scale bars are respectively 150 μm (top), 100 μm (middle) and 50 μm (bottom).
Acknowledgments
The authors thank Dr. Svetlana Avdulov for excellent technical assistance.
Footnotes
Supplementary information is available at Kidney International’s website
Disclosure
This work was supported by grants from the Netherlands Organization for Scientific Research (NWO VICI 016.130.668) and the EURenOmics project from the European Union seventh Framework Programme (FP7/2007–2013, agreement no. 305608). Dr. Jeroen de Baaij is supported by grants from NWO (Rubicon 825.14.021) and the Dutch Kidney Foundation (Kolff 14OKG17). Dr. Peter Igarashi is supported by a grant from the National Institutes of Health (grant no. R37DK042921). The authors declare that they have no conflict of interest.
References
- 1.Horikawa Y, Iwasaki N, Hara M, et al. Mutation in hepatocyte nuclear factor-1 beta gene (TCF2) associated with MODY. Nature genetics. 1997;17:384–385. doi: 10.1038/ng1297-384. [DOI] [PubMed] [Google Scholar]
- 2.Bingham C, Bulman MP, Ellard S, et al. Mutations in the hepatocyte nuclear factor-1beta gene are associated with familial hypoplastic glomerulocystic kidney disease. American journal of human genetics. 2001;68:219–224. doi: 10.1086/316945. [DOI] [PMC free article] [PubMed] [Google Scholar]
- 3.Bingham C, Hattersley AT. Renal cysts and diabetes syndrome resulting from mutations in hepatocyte nuclear factor-1beta. Nephrology, dialysis, transplantation : official publication of the European Dialysis and Transplant Association - European Renal Association. 2004;19:2703–2708. doi: 10.1093/ndt/gfh348. [DOI] [PubMed] [Google Scholar]
- 4.Adalat S, Woolf AS, Johnstone KA, et al. HNF1B mutations associate with hypomagnesemia and renal magnesium wasting. J Am Soc Nephrol. 2009;20:1123–1131. doi: 10.1681/ASN.2008060633. [DOI] [PMC free article] [PubMed] [Google Scholar]
- 5.Verhave JC, Bech AP, Wetzels JF, et al. Hepatocyte Nuclear Factor 1beta-Associated Kidney Disease: More than Renal Cysts and Diabetes. Journal of the American Society of Nephrology : JASN. 2015 doi: 10.1681/ASN.2015050544. [DOI] [PMC free article] [PubMed] [Google Scholar]
- 6.Lindner TH, Njolstad PR, Horikawa Y, et al. A novel syndrome of diabetes mellitus, renal dysfunction and genital malformation associated with a partial deletion of the pseudo-POU domain of hepatocyte nuclear factor-1beta. Human molecular genetics. 1999;8:2001–2008. doi: 10.1093/hmg/8.11.2001. [DOI] [PubMed] [Google Scholar]
- 7.Bingham C, Ellard S, Cole TR, et al. Solitary functioning kidney and diverse genital tract malformations associated with hepatocyte nuclear factor-1beta mutations. Kidney international. 2002;61:1243–1251. doi: 10.1046/j.1523-1755.2002.00272.x. [DOI] [PubMed] [Google Scholar]
- 8.Haldorsen IS, Vesterhus M, Raeder H, et al. Lack of pancreatic body and tail in HNF1B mutation carriers. Diabetic medicine : a journal of the British Diabetic Association. 2008;25:782–787. doi: 10.1111/j.1464-5491.2008.02460.x. [DOI] [PubMed] [Google Scholar]
- 9.Iwasaki N, Ogata M, Tomonaga O, et al. Liver and kidney function in Japanese patients with maturity-onset diabetes of the young. Diabetes care. 1998;21:2144–2148. doi: 10.2337/diacare.21.12.2144. [DOI] [PubMed] [Google Scholar]
- 10.van der Made CI, Hoorn EJ, de la Faille R, et al. Hypomagnesemia as First Clinical Manifestation of ADTKD-HNF1B: A Case Series and Literature Review. American journal of nephrology. 2015;42:85–90. doi: 10.1159/000439286. [DOI] [PubMed] [Google Scholar]
- 11.Ferre S, Bongers EM, Sonneveld R, et al. Early development of hyperparathyroidism due to loss of PTH transcriptional repression in patients with HNF1beta mutations? The Journal of clinical endocrinology and metabolism. 2013;98:4089–4096. doi: 10.1210/jc.2012-3453. [DOI] [PubMed] [Google Scholar]
- 12.Clissold RL, Hamilton AJ, Hattersley AT, et al. HNF1B-associated renal and extra-renal disease-an expanding clinical spectrum. Nature reviews Nephrology. 2015;11:102–112. doi: 10.1038/nrneph.2014.232. [DOI] [PubMed] [Google Scholar]
- 13.Cruz DN, Simon DB, Nelson-Williams C, et al. Mutations in the Na-Cl cotransporter reduce blood pressure in humans. Hypertension. 2001;37:1458–1464. doi: 10.1161/01.hyp.37.6.1458. [DOI] [PubMed] [Google Scholar]
- 14.Subramanya AR, Ellison DH. Distal convoluted tubule. Clinical journal of the American Society of Nephrology : CJASN. 2014;9:2147–2163. doi: 10.2215/CJN.05920613. [DOI] [PMC free article] [PubMed] [Google Scholar]
- 15.Reichold M, Zdebik AA, Lieberer E, et al. KCNJ10 gene mutations causing EAST syndrome (epilepsy, ataxia, sensorineural deafness, and tubulopathy) disrupt channel function. Proceedings of the National Academy of Sciences of the United States of America. 2010;107:14490–14495. doi: 10.1073/pnas.1003072107. [DOI] [PMC free article] [PubMed] [Google Scholar]
- 16.Bandulik S, Schmidt K, Bockenhauer D, et al. The salt-wasting phenotype of EAST syndrome, a disease with multifaceted symptoms linked to the KCNJ10 K+ channel. Pflugers Arch. 2011;461:423–435. doi: 10.1007/s00424-010-0915-0. [DOI] [PubMed] [Google Scholar]
- 17.Zhang C, Wang L, Zhang J, et al. KCNJ10 determines the expression of the apical Na-Cl cotransporter (NCC) in the early distal convoluted tubule (DCT1) Proc Natl Acad Sci U S A. 2014;111:11864–11869. doi: 10.1073/pnas.1411705111. [DOI] [PMC free article] [PubMed] [Google Scholar]
- 18.Gresh L, Fischer E, Reimann A, et al. A transcriptional network in polycystic kidney disease. EMBO J. 2004;23:1657–1668. doi: 10.1038/sj.emboj.7600160. [DOI] [PMC free article] [PubMed] [Google Scholar]
- 19.Hiesberger T, Bai Y, Shao X, et al. Mutation of hepatocyte nuclear factor-1beta inhibits Pkhd1 gene expression and produces renal cysts in mice. The Journal of clinical investigation. 2004;113:814–825. doi: 10.1172/JCI20083. [DOI] [PMC free article] [PubMed] [Google Scholar]
- 20.Ferre S, Veenstra GJ, Bouwmeester R, et al. HNF-1B specifically regulates the transcription of the gammaa-subunit of the Na+/K+-ATPase. Biochemical and biophysical research communications. 2011;404:284–290. doi: 10.1016/j.bbrc.2010.11.108. [DOI] [PubMed] [Google Scholar]
- 21.Meij IC, Koenderink JB, van Bokhoven H, et al. Dominant isolated renal magnesium loss is caused by misrouting of the Na(+),K(+)-ATPase gamma-subunit. Nature genetics. 2000;26:265–266. doi: 10.1038/81543. [DOI] [PubMed] [Google Scholar]
- 22.de Baaij JH, Dorresteijn EM, Hennekam EA, et al. Recurrent FXYD2 p.Gly41Arg mutation in patients with isolated dominant hypomagnesaemia. Nephrology, dialysis, transplantation : official publication of the European Dialysis and Transplant Association - European Renal Association. 2015 doi: 10.1093/ndt/gfv014. [DOI] [PubMed] [Google Scholar]
- 23.de Baaij JH, Hoenderop JG, Bindels RJ. Magnesium in man: implications for health and disease. Physiological reviews. 2015;95:1–46. doi: 10.1152/physrev.00012.2014. [DOI] [PubMed] [Google Scholar]
- 24.Santos-Rosa H, Schneider R, Bannister AJ, et al. Active genes are tri-methylated at K4 of histone H3. Nature. 2002;419:407–411. doi: 10.1038/nature01080. [DOI] [PubMed] [Google Scholar]
- 25.Shin H, Liu T, Manrai AK, et al. CEAS: cis-regulatory element annotation system. Bioinformatics. 2009;25:2605–2606. doi: 10.1093/bioinformatics/btp479. [DOI] [PubMed] [Google Scholar]
- 26.Ogata H, Goto S, Sato K, et al. KEGG: Kyoto Encyclopedia of Genes and Genomes. Nucleic Acids Res. 1999;27:29–34. doi: 10.1093/nar/27.1.29. [DOI] [PMC free article] [PubMed] [Google Scholar]
- 27.Liu T, Ortiz JA, Taing L, et al. Cistrome: an integrative platform for transcriptional regulation studies. Genome biology. 2011;12:R83. doi: 10.1186/gb-2011-12-8-r83. [DOI] [PMC free article] [PubMed] [Google Scholar]
- 28.Edghill EL, Bingham C, Slingerland AS, et al. Hepatocyte nuclear factor-1 beta mutations cause neonatal diabetes and intrauterine growth retardation: support for a critical role of HNF-1beta in human pancreatic development. Diabetic medicine : a journal of the British Diabetic Association. 2006;23:1301–1306. doi: 10.1111/j.1464-5491.2006.01999.x. [DOI] [PubMed] [Google Scholar]
- 29.Aboudehen K, Kim MS, Mitsche M, et al. Transcription Factor Hepatocyte Nuclear Factor-1beta Regulates Renal Cholesterol Metabolism. J Am Soc Nephrol. 2015 doi: 10.1681/ASN.2015060607. [DOI] [PMC free article] [PubMed] [Google Scholar]
- 30.Ferre S, de Baaij JH, Ferreira P, et al. Mutations in PCBD1 cause hypomagnesemia and renal magnesium wasting. Journal of the American Society of Nephrology : JASN. 2014;25:574–586. doi: 10.1681/ASN.2013040337. [DOI] [PMC free article] [PubMed] [Google Scholar]
- 31.Lagrutta AA, Bond CT, Xia XM, et al. Inward rectifier potassium channels. Cloning, expression and structure-function studies. Jpn Heart J. 1996;37:651–660. doi: 10.1536/ihj.37.651. [DOI] [PubMed] [Google Scholar]
- 32.Tucker SJ, Imbrici P, Salvatore L, et al. pH dependence of the inwardly rectifying potassium channel, Kir5. 1, and localization in renal tubular epithelia. J Biol Chem. 2000;275:16404–16407. doi: 10.1074/jbc.C000127200. [DOI] [PubMed] [Google Scholar]
- 33.Lourdel S, Paulais M, Cluzeaud F, et al. An inward rectifier K(+) channel at the basolateral membrane of the mouse distal convoluted tubule: similarities with Kir4-Kir5. 1 heteromeric channels. J Physiol. 2002;538:391–404. doi: 10.1113/jphysiol.2001.012961. [DOI] [PMC free article] [PubMed] [Google Scholar]
- 34.Zaika OL, Mamenko M, Palygin O, et al. Direct inhibition of basolateral Kir4.1/5.1 and Kir4. 1 channels in the cortical collecting duct by dopamine. Am J Physiol Renal Physiol. 2013;305:F1277–1287. doi: 10.1152/ajprenal.00363.2013. [DOI] [PMC free article] [PubMed] [Google Scholar]
- 35.Edghill EL, Oram RA, Owens M, et al. Hepatocyte nuclear factor-1beta gene deletions--a common cause of renal disease. Nephrology, dialysis, transplantation : official publication of the European Dialysis and Transplant Association - European Renal Association. 2008;23:627–635. doi: 10.1093/ndt/gfm603. [DOI] [PubMed] [Google Scholar]
- 36.Bellanne-Chantelot C, Clauin S, Chauveau D, et al. Large genomic rearrangements in the hepatocyte nuclear factor-1beta (TCF2) gene are the most frequent cause of maturity-onset diabetes of the young type 5. Diabetes. 2005;54:3126–3132. doi: 10.2337/diabetes.54.11.3126. [DOI] [PubMed] [Google Scholar]
- 37.Heidet L, Decramer S, Pawtowski A, et al. Spectrum of HNF1B mutations in a large cohort of patients who harbor renal diseases. Clinical journal of the American Society of Nephrology : CJASN. 2010;5:1079–1090. doi: 10.2215/CJN.06810909. [DOI] [PMC free article] [PubMed] [Google Scholar]
- 38.Clissold RL, Shaw-Smith C, Turnpenny P, et al. Chromosome 17q12 microdeletions but not intragenic HNF1B mutations link developmental kidney disease and psychiatric disorder. Kidney international. 2016;90:203–211. doi: 10.1016/j.kint.2016.03.027. [DOI] [PMC free article] [PubMed] [Google Scholar]
- 39.Paulais M, Bloch-Faure M, Picard N, et al. Renal phenotype in mice lacking the Kir5. 1 (Kcnj16) K+ channel subunit contrasts with that observed in SeSAME/EAST syndrome. Proceedings of the National Academy of Sciences of the United States of America. 2011;108:10361–10366. doi: 10.1073/pnas.1101400108. [DOI] [PMC free article] [PubMed] [Google Scholar]
- 40.Cuevas CA, Su XT, Wang MX, et al. Potassium Sensing by Renal Distal Tubules Requires Kir4.1. Journal of the American Society of Nephrology : JASN. 2017 doi: 10.1681/ASN.2016090935. [DOI] [PMC free article] [PubMed] [Google Scholar]
- 41.Bech AP, Wetzels JF, Bongers EM, et al. Thiazide Responsiveness Testing in Patients With Renal Magnesium Wasting and Correlation With Genetic Analysis: A Diagnostic Test Study. American journal of kidney diseases : the official journal of the National Kidney Foundation. 2016;68:168–170. doi: 10.1053/j.ajkd.2015.12.023. [DOI] [PubMed] [Google Scholar]
- 42.Diepens RJ, den Dekker E, Bens M, et al. Characterization of a murine renal distal convoluted tubule cell line for the study of transcellular calcium transport. American journal of physiology Renal physiology. 2004;286:F483–489. doi: 10.1152/ajprenal.00231.2003. [DOI] [PubMed] [Google Scholar]
- 43.Li L, Zepeda-Orozco D, Black R, et al. Autophagy Is a Component of Epithelial Cell Fate in Obstructive Uropathy. Am J Pathol. 2010;176:1767–1778. doi: 10.2353/ajpath.2010.090345. [DOI] [PMC free article] [PubMed] [Google Scholar]
- 44.de Baaij JH, Blanchard MG, Lavrijsen M, et al. P2X4 receptor regulation of transient receptor potential melastatin type 6 (TRPM6) Mg2+ channels. Pflugers Archiv : European journal of physiology. 2014;466:1941–1952. doi: 10.1007/s00424-014-1440-3. [DOI] [PubMed] [Google Scholar]
- 45.van Heeringen SJ, Veenstra GJ. GimmeMotifs: a de novo motif prediction pipeline for ChIP-sequencing experiments. Bioinformatics. 2011;27:270–271. doi: 10.1093/bioinformatics/btq636. [DOI] [PMC free article] [PubMed] [Google Scholar]
- 46.Subramanian A, Tamayo P, Mootha VK, et al. Gene set enrichment analysis: a knowledge-based approach for interpreting genome-wide expression profiles. Proc Natl Acad Sci U S A. 2005;102:15545–15550. doi: 10.1073/pnas.0506580102. [DOI] [PMC free article] [PubMed] [Google Scholar]
- 47.Tanaka T, Tomaru Y, Nomura Y, et al. Comprehensive search for HNF-1beta-regulated genes in mouse hepatoma cells perturbed by transcription regulatory factor-targeted RNAi. Nucleic acids research. 2004;32:2740–2750. doi: 10.1093/nar/gkh597. [DOI] [PMC free article] [PubMed] [Google Scholar]
Associated Data
This section collects any data citations, data availability statements, or supplementary materials included in this article.
Supplementary Materials
HNF1β chip-seq shows enrichment of the MODY and type II diabetes pathways and has novel bindings sites in known cystic and diabetes genes
a) KEGG pathway analysis was performed on genes with a HNF1β binding site in a window of 50 kb surrounding the TSS. The x-axis shows the –log q-value for each identified KEGG pathway. The q-value is adjusted with a FDR correction. b) GO-term molecular function analysis was performed on genes that had an Hnf1β peak in a window of 50 kb surrounding the TSS. The x-axis shows the −log q-value for each significant pathway. The q-value is adjusted for multiple comparisons with a FDR correction.
Novel HNF1β binding sites are found in known diabetes genes.
a–d) Screenshots of the UCSC genome browser for Hnf1α, Irs1 and Irs2 reveals HNF1β binding sites (upper track) near the H3K4me3 enriched transcription start sites (bottom track) of these genes.
The novel HNF1β binding site in the Kcnj16 promoter is significantly enriched in mpkDCT cells.
a) HNF1β ChIP samples of mpkDCT samples were used to verify the HNF1β binding site in the Kcnj16 promoter. The Pkhd1 binding site was used as a positive control. Samples were measured by quantitative RT-PCR. Data represent mean ± SEM and are expressed as fold enrichment over background. The cutoff for sufficient enrichment of the binding site was set at 10 fold enrichment over background. The background signal was determined at genomic coordinates GRCm38 chr15:99578842–99579015.
Knockdown of Hnf1β has no effect on the transcription of Trpm6 and Egf
a–c) The mRNA expression levels of Trpm6 (A) and Egf (B) in mpkDCT cells treated with either non-targeting (nt) (black bars) or Hnf1β targeting (white bars) siRNAs. Samples were measured by quantitative RT-PCR and normalized for Gapdh expression. Data (n=3) represent mean ± SEM and are expressed as the fold difference when compared to the expression in siRNA nt.
No difference in DCT marker Parvalbumin abundance and intensity between HNF1βfl-/fl- wild type and HNF1βfl+/fl+ knockout mice.
Representative images are displayed of kidney slices derived from a HNF1βfl-/fl- wild type (left) and a HNF1βfl+/fl+ knockout mouse (right) at various magnifications 10x (top), 20x (middle) and 40x (bottom). Parvalbumin is shown in green and DAPI in blue. Scale bars are respectively 150 μm (top), 100 μm (middle) and 50 μm (bottom).