Abstract
Background
Snoring has been shown to be associated with adverse physical and mental health, independent of the effects of sleep disordered breathing. Despite increasing evidence for the risks of snoring, few studies on sleep and health include objective measures of snoring. One reason for this methodological limitation is the difficulty of quantifying snoring. Conventional methods may rely on manual scoring of snore events by trained human scorers, but this process is both time- and labor-intensive, making the measurement of objective snoring impractical for large or multi-night studies.
Methods
The current study is a proof-of-concept to validate the use of support vector machines (SVM), a form of machine learning, for the automated scoring of an objective snoring signal. An SVM algorithm was trained and tested on a set of approximately 150,000 snoring and non-snoring data segments, and F-scores for SVM performance compared to visual scoring performance were calculated using the Wilcoxon signed rank test for paired data.
Results
The ability of the SVM algorithm to discriminate snore from non-snore segments of data did not differ statistically from visual scorer performance (SVM F-score=82.46 ± 7.93 versus average visual F-score=88.35 ± 4.61, p=0.2786), supporting SVM snore classification ability comparable to visual scorers.
Conclusion
In this proof-of-concept, we established that the SVM algorithm performs comparably to trained visual scorers, supporting the use of SVM for automated snoring detection in future studies.
Keywords: snoring, machine learning, support vector machines, automated snore detection
Introduction
Snoring is one of the most commonly reported sleep complaints among adults, with prevalence rates approaching 50% for men and 30% for women during middle age [1, 2]. Snoring impacts both physical and mental health. Compared to non-snorers, self-reported snorers endorse greater daytime sleepiness, elevated depressive and anxiety symptoms, and poorer quality of life [3–5]. Self-reported snoring frequency has also been associated with increased risk for cardiovascular and cardiometabolic outcomes, including markers of preclinical risk, such as altered baroreflex sensitivity [6] and autonomic function [7–9], and myocardial infarction [10], stroke [11], ischemic cerebral infarction [12], and the metabolic syndrome [13]. However, the few studies that have directly compared subjective and objective snoring found no significant correlation between the two measures [14–16], suggesting that self-reported snoring may be a proxy for another construct, such as sleep disordered breathing. To date, however, few studies have examined whether objective measures of snoring are associated with adverse health outcomes. One recent study reported that objectively-assessed heavy snoring is associated with increased carotid plaque prevalence, independent of sleep disordered breathing [17]. Converging evidence suggests that simple snoring, or snoring that occurs in the absence of sleep apnea, may be an independent risk factor for daytime impairments, as well as adverse health outcomes [17–19]. More studies are needed to better understand the impact of simple snoring, measured objectively, on health. In addition, research is needed to better understand the effects of louder, “heavier”, or more frequent snoring on health, in light of Hedner and colleagues’ [20] model of snoring-induced oscillatory pressure waves, which suggests that the vibrations caused by snoring travel through nearby tissues, triggering endothelial damage and inflammatory responses in these tissues. As a result, it may be critical to not only quantify presence or absence of snoring, but the intensity and frequency of snoring as well.
One of the largest barriers to conducting such studies is the fact that there is currently no established definition of snoring [21], nor does a gold standard for the objective measurement or scoring of snoring exist. Snoring is typically measured with microphones or piezoelectric sensors [15]. The resulting snore signals are most often analyzed by visual scoring, spectral analysis, or acoustic analysis [22]. Visual scoring relies on a priori parameters to identify snore events. Parameters include amplitude, duration, number of events per breath, and co-occurrence with other respiratory signals. This visual scoring method allows for the integration of information from multiple polysomnographic channels, as well as a moment-to-moment assessment of each candidate event against the scoring parameters, similar to the visual scoring methodology for apneic and hypopneic events.
While the use of visual scoring criteria addresses many of the limitations of self-reported snoring, it is time-consuming and inefficient, requiring careful, epoch-by-epoch analyses of entire nights of PSG-recorded sleep. In addition, assessment of reliability across scorers poses significant time and cost burden to researchers and clinicians. We hypothesized that machine learning algorithms, such as support vector machines (SVMs), can be used to identify unique characteristics of snore events. These characteristics, known as features, can then be used to automate the identification of snoring events in a reliable, efficient, and cost effective manner. The machine learning approach offers several advantages over visual scoring or automated proprietary software scoring of snore events. First, machine learning algorithms are trained to learn from experience, allowing for flexibility in classification, and they generate person-specific or group-specific models. In addition, if machine learning algorithms prove to be useful in the classification of snoring events, future algorithms could be developed to quantify the intensity or duration of snoring events as well. Second, machine learning features are obtained from characteristics of the snoring signals, including amplitude variations in the time and frequency domains of the signal; this allows for greater precision in scoring compared to the threshold-based identification of visual scoring. Third, machine learning allows for automated discrimination of snore events from artifact, including background noise and non-snore sounds. Fourth, the machine learning method can be used efficiently with larger sample sizes or multiple sleep nights per participant. Finally, the machine learning method is completely transparent, allowing researchers to know the precise features of the signal that are used to identify snore events, a unique advantage over the “black box” scoring algorithms of commonly-used proprietary software packages.
The present study is a proof-of-concept for the application of machine learning methods for objectively-assessed snore scoring. The aim of this study was to compare the performance of SVMs to visual scoring for the detection of objective snore events in one night of overnight polysomnography (PSG) in a small sample of midlife women.
Methods
Participants
Data were drawn from a larger, community-based cohort of women who participated in the Study of Women’s Health Across the Nation (SWAN) Sleep I Study, a cross-sectional examination of sleep in midlife women. Details about the study design and sample population have been described elsewhere [23,24]. Briefly, this cohort included community-based women in the menopausal transition; women were not selected on the basis of snoring or apneic status. Exclusion criteria for our proof-of-concept study were current menopausal hormone replacement therapy (HRT) use; current chemotherapy or radiation; regular shiftwork; current oral corticosteroid use; current use of medications affecting sleep; and missing or unusable snore channel data. All participants provided written informed consent. Eight participants from the SWAN Sleep I Study were selected for inclusion in the present proof-of-concept study on the basis of four characteristics known to be associated with snoring prevalence: race (n=4 Caucasian participants; n=4 African American participants), body mass index (BMI; n=3 non-obese and n=4 obese participants), presence or absence of sleep disordered breathing as defined by participants’ apnea-hypopnea indices (AHI; n=4 with AHI <5 and n=4 with ≥5), and self-reported weekly snoring frequency (n=2 reported “Never” snoring, n=2 reported “Infrequent” or <3 nights per week snoring, n=3 reported “Frequent” or ≥3 nights per week snoring, and n=1 reported “Don’t Know”). Where possible, we aimed to have balance cell sizes within groups for each characteristic. Given the aim of the present study, to test whether a machine learning algorithm can perform comparably to visual scorers for snoring identification, we believed it to be important to test both visual scorers and the support vector machine algorithm on varying degrees of snoring presentation. To do so, we first identified participants with various combinations of these four characteristics in the larger study cohort; from these lists, we then selected at random eight individuals meeting permutations of these characteristics for inclusion in this proof-of-concept study (see Table 1). In order to maximize the amount of snore and non-snore data for training and testing the algorithm, we divided each participant’s objective sleep recording into segments of approximately 200 samples at a sampling rate of 64 Hz, resulting in an average of 18,000 data segments without snoring and 200 data segments with snoring for each participant. The SVM model was, therefore, tested on a total of approximately 150,000 segments generated by the study sample of 8 participants.
Table 1.
Participant characteristics for reliability file records.
| Participant | Race | BMI | AHI | Self-Reported Snoring Frequency |
|---|---|---|---|---|
| 1 | Caucasian | 35.27 | 12.60 | Never |
| 2 | Caucasian | 40.45 | 50.08 | Frequent |
| 3 | Caucasian | 20.32 | 10.27 | Frequent |
| 4 | Caucasian | 27.68 | 4.98 | Infrequent |
| 5 | African American | 46.99 | 1.17 | Frequent |
| 6 | African American | 39.84 | 9.15 | Never |
| 7 | African American | 22.45 | 0.50 | Infrequent |
| 8 | African American | 30.14 | 0.78 | Don't Know |
|
| ||||
| Totals | Caucasian = 4 | Non-obese = 3 | Non-SDB = 4 | Never = 2 |
| African American = 4 | SDB = 4 | Infrequent = 2 | ||
| Obese = 5 | Frequent = 3 | |||
| Don’t Know = 1 | ||||
Notes: BMI categorization: Non-obese BMI<30; Obese BMI≥30. AHI categorization: Non-SDB AHI<5; SDB AHI≥5.
Self-reported snoring categorization based on responses to PSSQ “frequency of loud snoring” question. BMI=body mass index; AHI=apnea-hypopnea index; SDB=sleep disordered breathing; PSSQ=Pittsburgh Sleep Symptom Questionnaire.
Measures
Sociodemographic information including age and self-identified race/ethnicity (Black or African American and non-Hispanic White) were obtained by self-report at the beginning of the SWAN Sleep I Study. Menstrual bleeding patterns were used to characterize menopausal status (premenopause/early perimenopause, late perimenopause, and postmenopause/surgical menopause) according to World Health Organization criteria [25]. Body mass index (BMI, kg/m2) was calculated using height and weight collected at the SWAN visit closest to the participant’s sleep study. Health behavior variables, including caffeine, alcohol, and cigarette use, use of medications affecting sleep, and physical activity data, were drawn from sleep diaries (Pittsburgh Sleep Diary) [26] completed over a period of 14 to 35 days, depending on participants’ menstrual cycle length, and averaged across all days of the study.
In-home polysomnographic assessment of sleep disordered breathing, including snoring measures, were conducted on one night using Vitaport-3 (TEMEC VP3) ambulatory monitors. Polysomnography signals included bilateral central referential EEG channels (C3 and C4, referenced to linked A1–A2), submentalis electromyogram (EMG), electrooculogram (EOG), electrocardiogram (EKG), nasal pressure cannula, oral-nasal thermistors, fingertip oximeter, and abdominal and thoracic respiratory effort, measured by inductance plethysmography. Airflow was measured using nasal pressure, and the apnea/hypopnea index (AHI) was scored according to standard guidelines [27]. Processing and scoring of all sleep records, including visual sleep staging, were performed at the University of Pittsburgh Neuroscience Clinical and Translational Research Center (N-CTRC) according to standard guidelines [27]. Total sleep time was calculated as the total minutes of any stage of sleep after sleep onset. Raw data from the snore channel were archived for later scoring.
Snoring Measure and Scoring Parameters
The snore signal was collected using an uncalibrated microphone placed on the participant’s skin over the pharyngeal region, which translated snoring-induced vibrations into an electrical signal that oscillated in proportion to air pressure variations. The raw signal, collected in millivolts (mV), captured both duration (length of snoring event) and amplitude (strength of vibration pressure) over time (Figure 1). Visual scoring criteria were established a priori on the basis of previously published snoring literature [17,28]. Due to the lack of gold-standard criteria for snore scoring, no validated visual snore scoring criteria exist at present. All of the following criteria had to be met for the positive identification of a snoring event on the snoring channel: 1) duration of ≥ 0.4 seconds; 2) ≥ 300% change in amplitude from baseline millivolt (mV) signal (established individually per participant on the basis of the average baseline amplitude derived from the biocalibration signals at the beginning of the PSG recording); 3) occurring only once per breath, as established by respiratory PSG signals; 4) occurring during inspiration or expiration, to exclude signal artifacts; and 5) occurring only during epochs scored as NREM or REM sleep (i.e., wake was excluded). All scorers were trained to identify changes in the snoring signal that occurred during biocalibration and conversation with the sleep technician in order to visually distinguish signals associated with breathing and talking from snoring events. Due to natural variations in the baseline signal across the night, all visual scoring accounted for the baseline amplitude in the local epochs in which the snoring event was scored, although variability in baseline amplitude across the night was minor for all participants. All scoring was done using Harmonie® software (Stellate System, Montréal, Québec, Canada). Total snores were summed across one night of sleep for each participant.
Fig. 1.
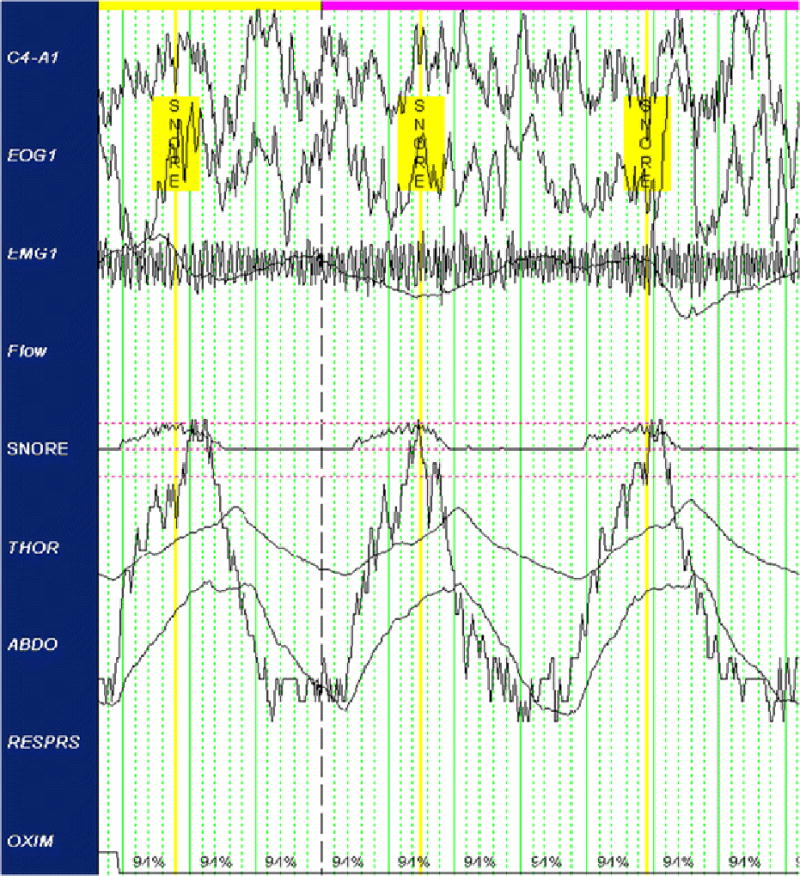
Sample objective snoring signal with identified snore events.
The scoring methodology was adapted from that used by Lee et al. (2008) for uncalibrated signals [17]. The duration parameter represented a sufficient period for snoring accompanying inspiration or expiration and was deemed sufficiently long to eliminate artifacts of sleep, such as sighing, rustling, and snorts. The amplitude parameter was established to eliminate non-snoring sleep artifacts, including labored breathing and non-snoring sounds, such as murmurs or mumbles. Because the snore channel was not calibrated to a standardized baseline voltage before recording, the baseline signal was established independently for each individual using the bio-calibrations performed at the beginning of the night’s recording period. Since snoring occurs with either the inspiration or expiration phase, and occasionally throughout both phases, only events occurring in one of these phases were counted as snore events, pursuant to convention [29,30]. Snoring events occurring during both the inspiration and expiration phase were scored as a single event. Only NREM and REM sleep epochs were scored. Putative events occurring immediately on or before sleep-to-wake transitions were excluded as candidate events and not scored, as they may have been artifacts of wake. To ensure that these parameters were satisfied, the snore channel was visually compared to the corresponding respiration (thoracic, abdominal effort), oxymetry, submentalis EMG, and EEG (C4) channels.
Visual Scoring
The first author (LS) was designated as the “gold standard” or “ground truth scorer” and trained five additional scorers (“trained scorers”). Training involved group instruction of the visual scoring parameters on sample snoring channel data not derived from the eight participants included in the present study, independent labeling of snore versus non-snore events, and reconciliation of discrepancies through guided group re-scoring.
Snoring channel data for each of the eight participants’ records were duplicated and independently scored by all six scorers according to the visual scoring criteria above. To evaluate the inter-rater reliability of the visual scoring paradigm, the scored snore events of the five “trained scorers” were compared to the “ground truth scorer” labels (F-score mean 89.13 ± 4.34). To test the robustness of the scoring paradigm, five additional permutations were run with each “trained scorer” serving as the “ground-truth” scorer. Given that no other snoring data were collected (e.g., sound microphone of snore sounds), we were unable in the present study to validate the snoring events scored on the physiological snoring channel against another objective measure of snoring.
Machine Learning Scoring
A support vector machine (SVM) is a pattern recognition, or machine learning, model that seeks to separate a set of training vectors into two separable classes. In the present study, the goal of SVM in scoring objectively-assessed snoring was to find the maximum margin of separation between two classes of events: “snore” and “non-snore”. The development of the SVM algorithm involved two phases: 1) training phase; and 2) testing phase. The first step of the training phase was to extract features from the snoring channel data. This step optimizes the ability of the SVM algorithm to fit the data by choosing the best parameters (C and gamma). Due to variability in feature ranges, all features were first normalized to means of zero and standard deviations of one. For the purpose of training and testing the SVM, the entire snoring channel signal was next broken into segments of “snore” and “non-snore” segments based on the visually-scored events, as described above. We needed signal segments corresponding to “snore” and “non-snore” events in order for the algorithm to learn the differences in patterns between the two and understand the similarities within the two categories. Also, due to our limited number of subject for this pilot study, this method maximized the utility of the overnight PSG data. The duration of each of the segments was approximately 200 samples (~3 seconds) and the sampling rate for the signal was 64Hz (i.e., 64 sampling points needed to represent 1 second). There were on average approximately 18,000 “non-snore” segments and 200 “snore” segments per participant sleep night. Different sets of parameters were then assessed using WEKA software (The WEKA Data Mining Software (3.6). Waikato, New Zealand: WEKA, 2009) in order to identify the SVM parameters that best characterized the data.
The selected features were then applied to the data to identify the optimal classifier for determining whether a segment should be classified as “snore” or “non-snore”. The best classifier for identifying a snoring event was chosen based on the outcome of a 10-fold cross-validation accuracy method. In this 10-fold cross-validation approach, the entire SVM training set was divided into ten subsets, and training was done on 9 data subsets and tested on the single left-out subset. In the present study, the subsets of data were generated automatically using Matlab, where the data sets are shuffled in random order and divided into 10 sets for the cross-vadliation. This process was repeated ten times with each permutation of training and testing subsets, resulting in a 10-fold cross-validation. The SVM parameters were finalized once the machine learning classifier with the highest cross-validation accuracy was produced.
For the feature reduction for our data, 19 optimal features were selected for classification using the ranker method in WEKA (see Table 2). In this method, the features with the highest variability between two classes and the lowest variability within a class were ranked based upon their ability to classify, and the highest ranked features were selected. Upon finalization of the feature set, the classifier was generated using LIBSVM, a publicly available SVM library [31]. For this classification problem, the detection of snoring events using SVM was formulated as a binary classification (Snore/Non-Snore). The same parameters and same subset of features were used to generate SVMs using each of the six visual scorers as the “ground truth” scorer in turn.
Table 2.
Support Vector Machine (SVM) Features Selected for Generating the Classifier.
| FEATURES EXTRACTED | |
|---|---|
| Raw signal | Minimum(1), Maximum(2), Standard deviation(3), root mean square(4) |
| First Derivative of Raw Signal | Minimum(5), Maximum(6) |
| Area Under the Curve | (7) |
| Width Between Peaks | (8) |
| Number of Peaks | (9) |
| Autocorrelation Maximum | (10) |
| Cepstrum of Raw Signal | Minimum(11), Maximum(12), Standard deviation(13), Mean(14) |
| First Derivative of Cepstrum | Minimum(15), Standard deviation(16) |
| Z score | Minimum(17) |
| Complex Cepstrum | Mean(18) |
| Power Spectrum of Raw Signal | Maximum(19) |
Data Analysis
To evaluate the SVM algorithm, the predicted snore event labels (Snore/Non-Snore) generated by the algorithm were compared to the events scored by visual scoring. This process was repeated six times to compare the predicted SVM algorithm snore labels to each of the six visual scorers’ snoring events.
Performance evaluation of the SVM algorithm was based on true positive (TP), false positive (FP), false negative (FN), and true negative (TN) events. A TP was scored when a snoring event was accompanied by a snoring label, a FP when a non-snoring event received a snoring label, a FN when a snoring event was not accompanied by a snoring label, and a TN for all segments lacking both snoring event and snoring label. Based on these values, we calculated the precision (P), recall (R), and overall F scores for each participant. Precision (P) represents the positive predictive value and is defined as the proportion of true positives to all the positive results [TP/(TP+FP)]. Recall (R), also known as sensitivity, represents the true positive rate of the algorithm and is defined as the ratio of true positives to predicted positives [TP/(TP+FN)]. The F-score is a measure of the test's overall accuracy and is calculated using both precision and recall [2(Precision)(Recall)/(Precision+Recall)]. The resulting F-scores are measures of the overall concordance between the SVM algorithm and the six visual scorers. Analyses were conducted using a 1-second buffer on either side of the ground truth label to account for variability in placement of the event marker between visual scorers, as some scorers placed the event marker at the beginning of the snoring event, while others placed the marker in the center or at the end of the event. Depending on the length of the snoring episodes, event marker placement could vary by one second or longer. Future scoring should standardize event marker placement. To determine whether the SVM performed comparably to visual scoring, we compared the SVM F-score to the computed average F-score of each scorer against the ground truth scorer using the Wilcoxon signed rank test for paired data.
Results
Sample characteristics are shown in Table 3. Participants ranged in age from 48 to 54 years (mean 51.00 ± 1.93 years). As expected given the a priori criteria for participant selection, there was a broad range for both body mass index (BMI mean 32.89, range 20.32–46.99) and apnea-hypopnea index (AHI mean 11.19, range 0.50–50.08). Mean daily alcohol consumption was very low (mean 0.08 ± 0.17 units per day), and all participants denied current cigarette use during the study.
Table 3.
Participant characteristics.
| Total sample Mean (SD) |
|
|---|---|
| Age (years) | 51.00 (1.93) |
| Body mass index (BMI) | 32.89 (9.35) |
| Apnea-hypopnea index (AHI) | 11.19 (16.39) |
| Total snores | 1007.88 (982.01) |
| Total sleep time (min.) | 365.83 (81.48) |
| Mean daily servings of caffeine | 1.30 (0.80) |
| Mean daily # of cigarettes | 0 (0.0) |
| Mean daily servings of alcohol | 0.08 (0.17) |
| % days exercise performed | 66.67 (47.14) |
| % days sleep-affecting medication used | 3.03 (10.05) |
Validation of SVM for Objective Snore Scoring
Table 4 shows the F-scores for all comparisons. First, overall reliability among the six visual scorers was high across all permutations (F-score mean 88.31 ± 6.12, with a perfect F-score=100). To test the performance of the SVM algorithm, its performance was compared to each of the six visual scorers in turn, resulting in a total of 48 permutations across the eight participants. Across all permutations, overall performance of the SVM algorithm in identifying snore events was high (F-score mean 82.43 ± 8.29), with a range comparable to visual scorers (63.49 to 93.41, see Table 4). Statistical analysis of the SVM F-score compared to the computed average F-score of the visual scorers was computed using the Wilcoxon signed rank test for paired data. The ability of the SVM algorithm to discriminate snore from non-snore segments of data did not differ statistically from visual scorer performance (SVM F-score=82.46 ± 7.93 versus average visual F-score=88.35 ± 4.61, p=0.2786), supporting SVM snore classification ability comparable to visual scorers.
Table 4.
Comparison of F-score values for SVM algorithm versus visually scored data.
| Record 1 |
Record 2 |
Record 3 |
Record 4 |
Record 5 |
Record 6 |
Record 7 |
Record 8 |
||
|---|---|---|---|---|---|---|---|---|---|
| F score |
F score |
F score |
F score |
F score |
F score |
F score |
F score |
||
| Ground Truth 1 | Expert 2 | 94 | 89 | 94 | 77 | 88 | 88 | 94 | 93 |
| Expert 3 | 93 | 85 | 93 | 89 | 84 | 87 | 94 | 90 | |
| Expert 4 | 97 | 88 | 97 | 88 | 88 | 89 | 93 | 94 | |
| Expert 5 | 97 | 83 | 97 | 84 | 86 | 87 | 93 | 89 | |
| Expert 6 | 94 | 85 | 94 | 83 | 85 | 87 | 91 | 72 | |
| Average | 95 | 86 | 95 | 84 | 86 | 88 | 93 | 88 | |
| SVM | 89 | 77 | 89 | 80 | 66 | 85 | 88 | 93 | |
| Ground Truth 2 | Expert 1 | 94 | 89 | 94 | 77 | 88 | 88 | 94 | 93 |
| Expert 3 | 95 | 84 | 95 | 78 | 84 | 84 | 93 | 87 | |
| Expert 4 | 93 | 85 | 93 | 76 | 90 | 90 | 93 | 92 | |
| Expert 5 | 94 | 83 | 94 | 70 | 86 | 86 | 92 | 86 | |
| Expert 6 | 90 | 84 | 90 | 67 | 81 | 84 | 90 | 71 | |
| Average | 93 | 85 | 93 | 74 | 86 | 86 | 92 | 86 | |
| SVM | 83 | 81 | 90 | 72 | 64 | 83 | 89 | 91 | |
| Ground Truth 3 | Expert 1 | 93 | 85 | 93 | 89 | 84 | 87 | 94 | 90 |
| Expert 2 | 95 | 84 | 95 | 78 | 84 | 84 | 93 | 87 | |
| Expert 4 | 96 | 80 | 96 | 82 | 85 | 90 | 93 | 96 | |
| Expert 5 | 94 | 92 | 94 | 89 | 80 | 86 | 93 | 94 | |
| Expert 6 | 91 | 88 | 91 | 90 | 83 | 84 | 92 | 91 | |
| Average | 94 | 86 | 94 | 86 | 83 | 86 | 93 | 92 | |
| SVM | 82 | 88 | 88 | 80 | 68 | 89 | 88 | 90 | |
| Ground Truth 4 | Expert 1 | 97 | 88 | 97 | 88 | 88 | 87 | 93 | 94 |
| Expert 2 | 93 | 85 | 93 | 76 | 90 | 84 | 93 | 92 | |
| Expert 3 | 96 | 80 | 96 | 82 | 85 | 85 | 93 | 92 | |
| Expert 5 | 90 | 84 | 90 | 89 | 84 | 92 | 96 | 91 | |
| Expert 6 | 93 | 88 | 93 | 90 | 87 | 92 | 94 | 78 | |
| Average | 94 | 85 | 93 | 85 | 87 | 88 | 94 | 89 | |
| SVM | 80 | 80 | 90 | 70 | 64 | 84 | 90 | 93 | |
| Ground Truth 5 | Expert 1 | 97 | 84 | 97 | 84 | 86 | 89 | 93 | 89 |
| Expert 2 | 94 | 84 | 94 | 70 | 86 | 90 | 92 | 86 | |
| Expert 3 | 94 | 88 | 94 | 76 | 80 | 85 | 93 | 92 | |
| Expert 4 | 90 | 88 | 90 | 82 | 84 | 86 | 96 | 91 | |
| Expert 6 | 95 | 93 | 95 | 89 | 85 | 87 | 96 | 78 | |
| Average | 94 | 87 | 94 | 80 | 84 | 87 | 94 | 87 | |
| SVM | 79 | 84 | 89 | 80 | 66 | 91 | 89 | 79 | |
| Ground Truth 6 | Expert 1 | 94 | 84 | 94 | 83 | 85 | 87 | 91 | 72 |
| Expert 2 | 90 | 84 | 90 | 67 | 81 | 84 | 90 | 71 | |
| Expert 3 | 91 | 88 | 91 | 78 | 83 | 92 | 92 | 78 | |
| Expert 4 | 93 | 88 | 93 | 90 | 87 | 87 | 94 | 74 | |
| Expert 5 | 95 | 93 | 95 | 89 | 85 | 93 | 96 | 78 | |
| Average | 93 | 87 | 93 | 81 | 84 | 89 | 93 | 75 | |
| SVM | 80 | 84 | 90 | 79 | 67 | 89 | 89 | 79 |
Figure 2 provides visual representations of the overall performance of the SVM algorithm to visual scorers across all eight records, using LS as the ground-truth scorer. On average, the SVM algorithm slightly underperformed in comparison to the visual scorers, although the mean performance of the two scoring methods did not differ statistically. Appendix A presents visual representations of the F-score values for each record across all permutations of the six visual scorers as the ground-truth scorer.
Fig. 2.
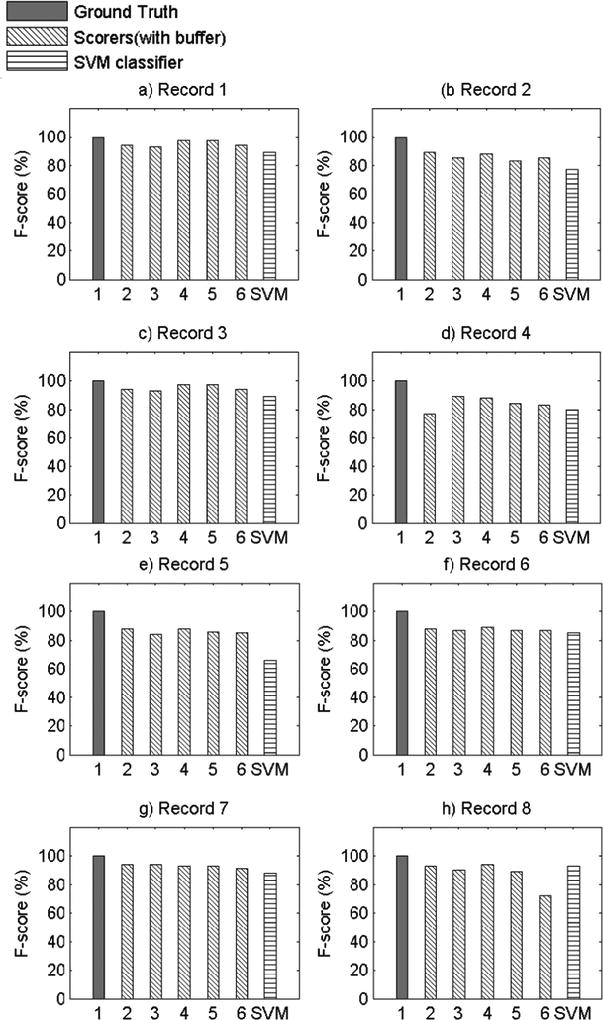
Comparison of F-score Values for All Records with Scorer 1 as Ground Truth Scorer.
Discussion
This paper presents proof-of-concept methods and results for an objective machine learning scoring alternative to human visual scoring of snore events. The SVM algorithm extracted key features of signals that discriminate a snore event from a non-snore event, as an alternative to visual scoring. In this proof-of-concept analysis, an SVM model performed comparably to human visual scoring for the identification of snoring in polysomnographic records. These data support the use of SVM for objective assessment of snoring.
A recent guideline on snoring from the German Society of Otorhinolaryngology, Head and Neck Surgery [21] notes the lack of objective parameters defining “respiration-dependent acoustic phenomena” (i.e. snoring). The present study used a criterion-based visual scoring paradigm that demonstrated good inter-rater reliability. However, even reliable visual scoring methods pose two major limitations. First, the method requires a significant time investment for both training and scoring. The initial training period for scorers can be lengthy, and it requires that all scorers score identical reliability files to assess inter-rater reliability. Adjustments to scoring technique necessitate back-and-forth between the gold standard scorer and all trainees, which can be a time-consuming process. Furthermore, it can take up to two hours for one trained snore scorer to visually score one 8-hour night of PSG-recorded snoring; this scoring is in addition to routine PSG scoring of sleep stages, sleep-disordered breathing, and limb movements, and the resulting time necessary for such thorough visual scoring can be cost prohibitive. Second, visual scoring of snoring, like all human PSG scoring, is subject to rater drift and error.
The use of SVMs addresses both of these limitations. First, SVM is more time-efficient. The initial training phase of the SVM algorithm requires an initial investment of time, but the availability of online machine learning software such as WEKA makes the use of SVM for snore scoring feasible and efficient. Once the algorithm has been trained, it can score an entire 8-hour night of PSG-recorded snoring in minutes. In the present study, our algorithm was able to score one night of PSG in 15–20 minutes (Software: Matlab 8, The MathWorks Inc., Natick, MA, 2000; Hardware: Intel, Core i5, Windows 7 OS), compared to an average of 2 hours for visual scoring. The time necessary for the algorithm to score a night of PSG may be even less, depending on the hardware and software used. The SVM relies on features extracted from the physiologic channel to determine the optimal classifier to label a snore event, and the 10-fold cross-validation training technique ensures that the classifier does not over-fit, i.e. it learns the data rather than just memorizing it. Once the SVM algorithm has been trained using cross- validation on a small test sample, the algorithm generalizes to newer data, which can then be scored using the established classification features. While the SVM algorithm developed in the present study relied fully on comparisons to visually-scored snoring data, unsupervised SVM algorithms can be developed in the future that would eliminate the need for human labeling. These advantages of machine learning SVM make it well-suited for objectively-assessed snoring, particularly with large or epidemiological studies or across multiple nights of PSG-assessed sleep. Furthermore, the SVM pattern recognition algorithms can be far more readily adapted to better and more sensitive snoring-detection technologies than visual scoring, allowing this scoring method greater flexibility while retaining efficiency. For example, while the scope of our present proof-of-concept study was to develop an algorithm solely for dividing a signal into two different categories, i.e. “classification”, machine learning algorithms could also be used to predict continuous data, also known as “regression”. For example, using the regression machine learning technique, we could utilize to predict continuous variables such as snore intensity or esophageal pressure; this is the focus of a follow-up study currently underway.
The present study has several limitations. First, as this was a proof-of-concept study, only eight participants were used to examine the feasibility of machine learning methods for objective snore scoring, potentially resulting in reduced power. However, it is important to note that each participant’s 8-hour night of sleep was segmented into 20,000 approximately 3-second data segments, resulting in a total of approximately 150,000 data segments for analysis. Second, our study examined snoring in a sample of Caucasian and African American midlife women, limiting the generalizability of our findings. Given certain physiological underpinnings of snoring, there may be differences in the objective snoring signal characteristics due to sex, age, or race/ethnicity. Future validation of machine learning methods for snore scoring should be repeated in males and across age and race/ethnic groups. It should also be noted that the SVM performance was not equal or superior to the performance of all of the visual scorers across all participant records. This may be attributed to the robustness of the algorithm features, which were obtained on the basis of the average morphology of the snoring signal during the training phase. This made it difficult for the SVM algorithm developed in this proof-of-concept study to adapt to variability in snoring patterns across participants, which is particularly noticeable in Record 5 (see Appendix A). However, the machine learning algorithm did perform well within each subject’s recording night, as the algorithm was able to learn the variability within a subject but had greater difficulty accounting for between-subject variability. This can readily be addressed in future studies by training and testing on a larger sample size and utilizing different features that allow for greater inter-individual variability. Furthermore, we discovered significant variability in types of snoring patterns even within the eight records used in the current study. By studying these various patterns of snoring, using template matching and correlation, we might further improve the predictive ability of our algorithm to classify snore events. Also, using sets of features that incorporate most of these snoring pattern variations will make the pattern recognition algorithm more adaptable. Additionally, more complex SVM algorithms that incorporate other channels, such as airflow, pressure, or electroencephalogram, may be useful. For example, snoring events during inspiration may be defined by a different set of features than snoring events during expiration; while we were unable to test this hypothesis due to our small sample size, future research to develop snoring algorithms that incorporate multiple channels can and should be done. Due to data blinding prior to scoring and our small sample size, we were also unable to compare SVM performance for apneic compared to non-apneic participants in the present study, but future studies using more participants that incorporate data from other respiratory signals can test the performance of SVM for apneic and non-apneic snorers.
Given our growing understanding of the importance of snoring for cardiovascular and metabolic health outcomes, and the disparate published findings that may result from the use of varied snoring assessments, we recommend that future studies include objective assessments of snoring. The results of this preliminary report support the use of SVM for the scoring of objective, PSG-assessed snoring signals. Although the signal we collected was uncalibrated, we propose that similar methods may be reliably used for the scoring of objectively-assessed and calibrated snoring data. The SVM algorithm learned to identify snore and non-snore events based upon the visual scoring; hence, it is only when the SVM performs identically to the ground truth scorer that we will achieve ideal performance (100% congruity). However, in the present study, this was difficult to achieve due to the noise of the real-time physiological snoring channel data and the high variability between snoring signals. Furthermore, we purposefully tested the SVM algorithm against all possible permutations of visual scorers, and we were able to demonstrate that the algorithm performance was similar to or greater than at least one of the experts when compared to ground truth. Future work should be done to demonstrate that the performance of the machine learning algorithm can improve with additional experience, just as human expertise improves with additional training and testing. We have demonstrated that the SVM method is both valid and feasible and offers a significant reduction in time compared to the visual scoring paradigm. Importantly, the SVM method is flexible and can be adapted to include features of accompanying PSG signals or improved technologies, allowing for improvements in snoring pattern recognition over time.
Acknowledgments
Funding: The Study of Women's Health Across the Nation (SWAN) has grant support from the National Institutes of Health (NIH), DHHS, through the National Institute on Aging (NIA), the National Institute of Nursing Research (NINR) and the NIH Office of Research on Women’s Health (ORWH) (Grants U01NR004061, U01AG012505, U01AG012535, U01AG012531, U01AG012539, U01AG012546, U01AG012553, U01AG012554, U01AG012495). Funding for the SWAN Sleep Study is from the National Institute on Aging (Grants AG019360, AG019361, AG019362, AG019363). The NIH provided additional financial support in the form of funding to Ms. Samuelsson and Dr. Krafty (R01GM113243). The content of this manuscript is solely the responsibility of the authors and does not necessarily represent the official views of the NIA, NINR, ORWH, or the NIH.
Conflict of Interest: All authors certify that they have no affiliations with or involvement in any organization or entity with any financial interest (such as honoraria; educational grants; participation in speakers' bureaus; membership, employment, consultancies, stock ownership, or other equity interest; and expert testimony or patent-licensing arrangements), or non-financial interest (such as personal or professional relationships, affiliations, knowledge or beliefs) in the subject matter or materials discussed in this manuscript.
Appendix A
Visual Comparisons of F-score Values for All Records.
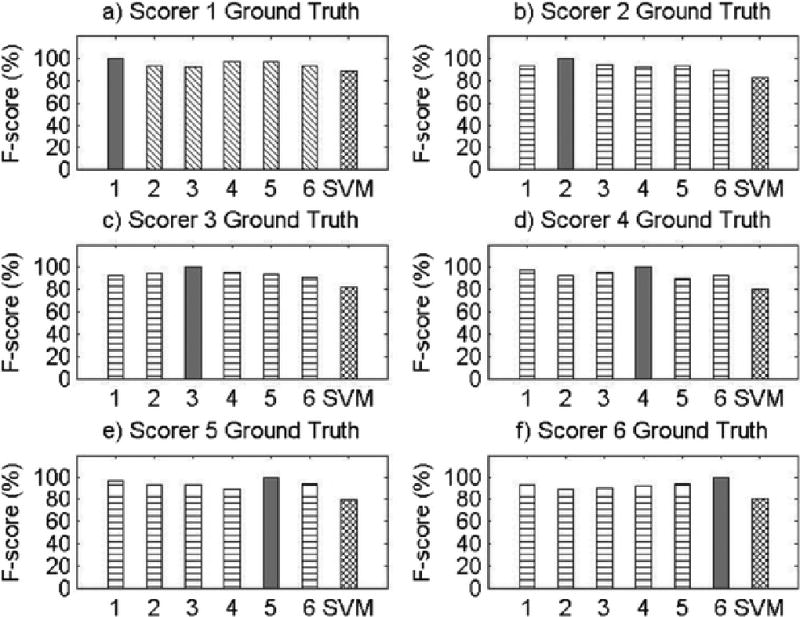
Results for Record 1
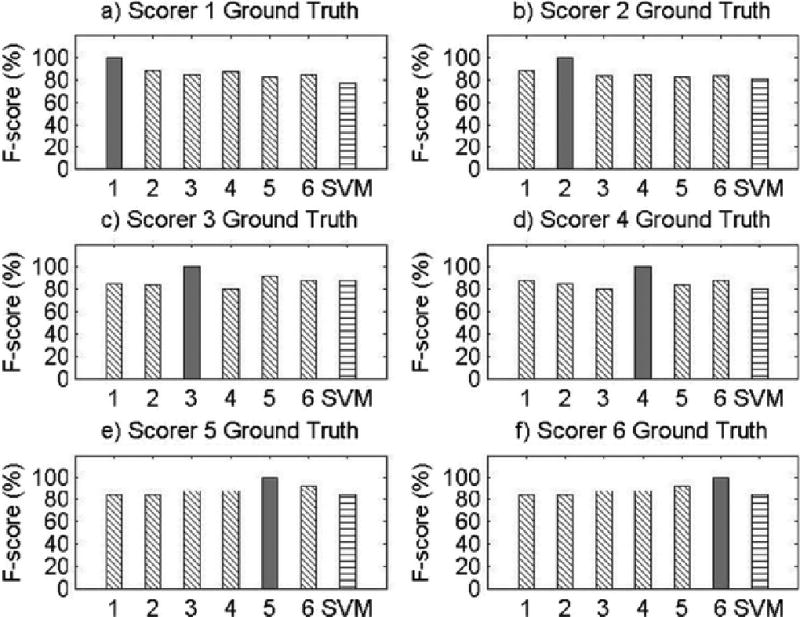
Results for Record 2
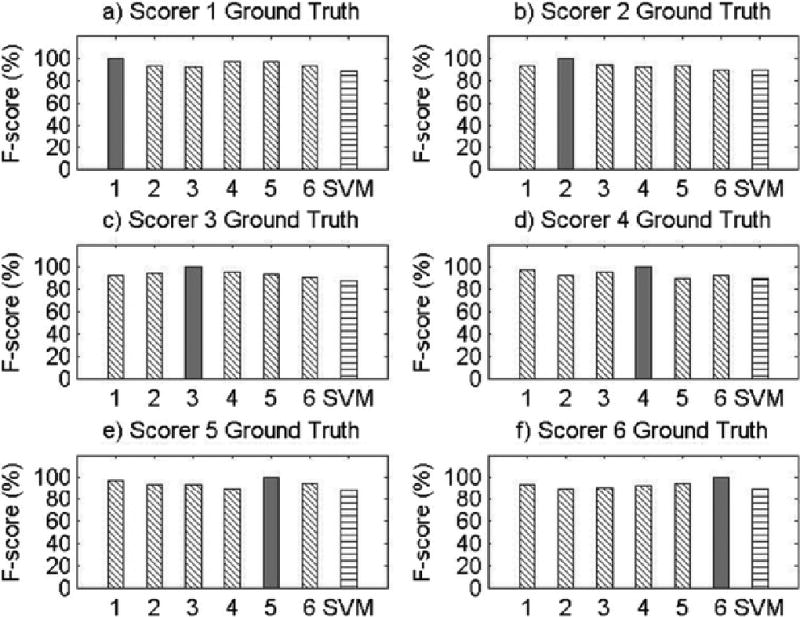
Results for Record 3
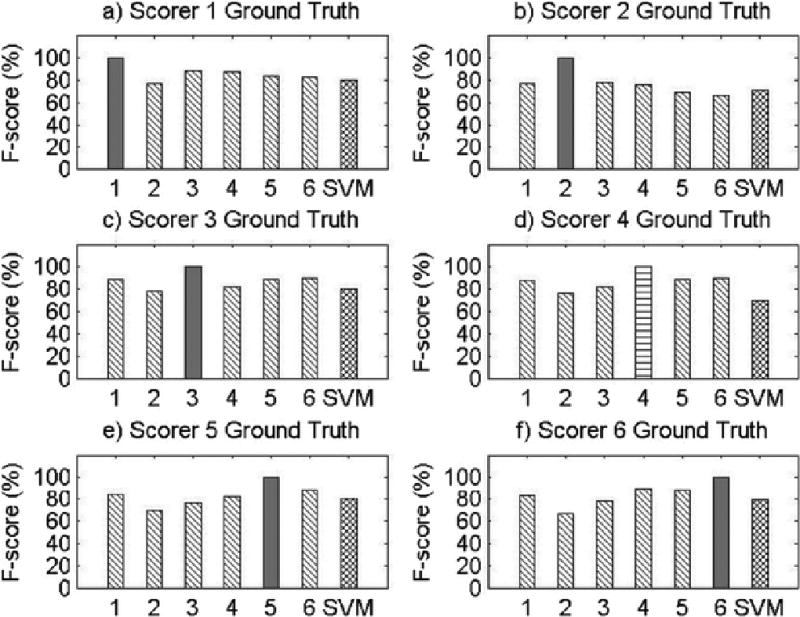
Results for Record 4
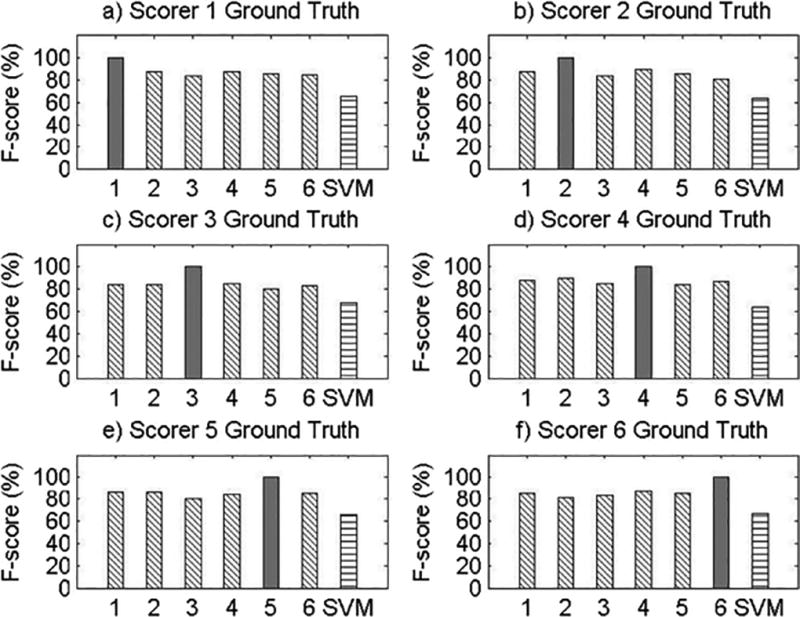
Results for Record 5
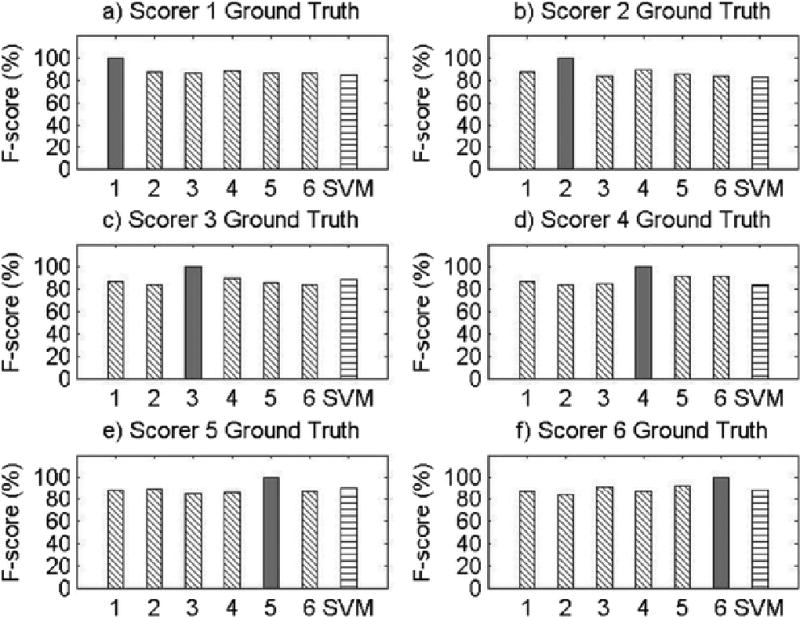
Results for Record 6
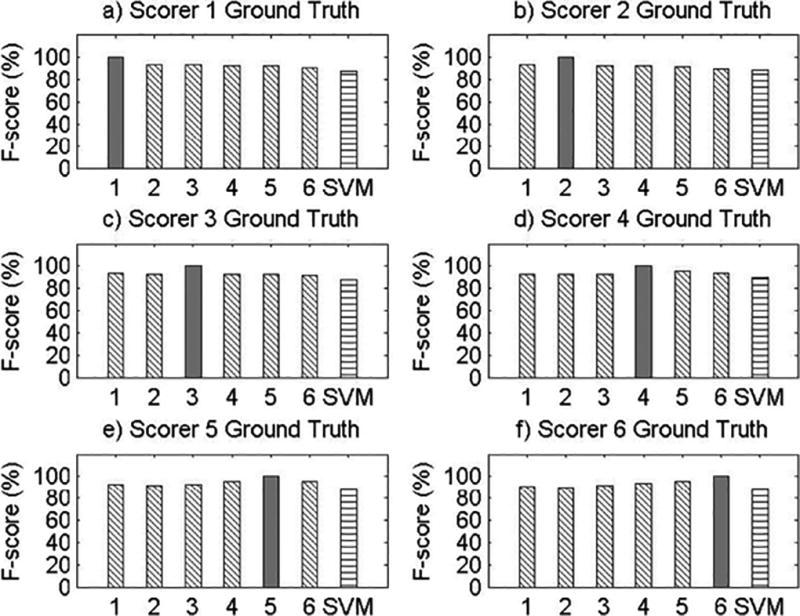
Results for Record 7
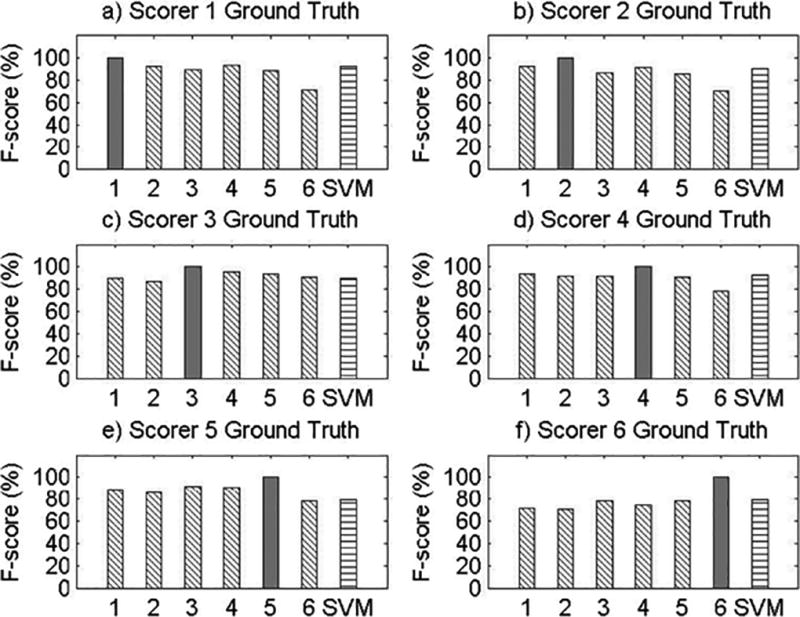
Results for Record 8
Footnotes
Ethical approval: All procedures performed in studies involving human participants were in accordance with the ethical standards of the institutional and/or national research committee and with the 1964 Helsinki declaration and its later amendments or comparable ethical standards.
Informed consent: Informed consent was obtained from all individual participants included in the study.
References
- 1.Kravitz HM, Ganz PA, Bromberger J, Powell LH, Sutton-Tyrrell K, Meyer PM. Sleep difficulty in women at midlife: a community survey of sleep and the menopausal transition. Menopause. 2003;10:19–28. doi: 10.1097/00042192-200310010-00005. [DOI] [PubMed] [Google Scholar]
- 2.Ganguli M, Reynolds CF, Gilby JE. Prevalence and persistence of sleep complaints in a rural elderly community sample: The MoVIES Project. Journal of the American Geriatrics Society. 1996;44:778–784. doi: 10.1111/j.1532-5415.1996.tb03733.x. [DOI] [PubMed] [Google Scholar]
- 3.Balsevicius T, Uloza V, Sakalauskas R, Miliauskas S. Peculiarities of clinical profile of snoring and mild to moderate obstructive sleep apnea-hypopnea syndrome patients. Sleep Breath. 2012;16:835–843. doi: 10.1007/s11325-011-0584-z. [DOI] [PubMed] [Google Scholar]
- 4.Ika K, Suzuki E, Mitsuhashi T, Takao S, Doi H. Shift work and diabetes mellitus among male workers in Japan: does the intensity of shift work matter? Acta Med Okayama. 2013;67:25–33. doi: 10.18926/AMO/49254. [DOI] [PubMed] [Google Scholar]
- 5.Baldwin C. Preventing late-life depression: A clinical update. Int Psychogeriatr. 2010;22:1216–1224. doi: 10.1017/S1041610210000864. [DOI] [PubMed] [Google Scholar]
- 6.Gates GJ, Mateika SE, Basner RC, Mateika JH. Baroreflex sensitivity in nonapneic snorers and control subjects before and after nasal continuous positive airway pressure. Chest. 2004;123:801–807. doi: 10.1378/chest.126.3.801. [DOI] [PubMed] [Google Scholar]
- 7.Gates GJ, Mateika SE, Mateika JH. Heart rate variability in non-apneic snorers and controls before and after continuous positive airway pressure. BMC Pulm Med. 2005;5:1–9. doi: 10.1186/1471-2466-5-9. [DOI] [PMC free article] [PubMed] [Google Scholar]
- 8.Mateika JH, Mateika S, Slutsky AS, Hoffstein V. The effect of snoring on mean arterial blood pressure during non-REM sleep. Am Rev Respir Dis. 1992;145:141–146. doi: 10.1164/ajrccm/145.1.141. [DOI] [PubMed] [Google Scholar]
- 9.Hoffstein V, Mateika J. Evening-to-morning blood pressure variations in snoring patients with and without obstructive sleep apnea. Chest. 1992;101:379–384. doi: 10.1378/chest.101.2.379. [DOI] [PubMed] [Google Scholar]
- 10.D'Alessandro R, Magelli C, Gamberini G, Bacchelli S, Cristina E, Magnani B, Lugaresi E. Snoring every night as a risk factor for myocardial infarction: a case-control study. BMJ. 1990;300:1557–1558. doi: 10.1136/bmj.300.6739.1557-a. [DOI] [PMC free article] [PubMed] [Google Scholar]
- 11.Hu FB, Willett WC, Manson JE, Colditz GA, Rimm EB, Speizer FE, Hennekens CH, Stampfer MJ. Snoring and risk of cardiovascular disease in women. J Am Coll Cardiol. 2000;35:308–313. doi: 10.1016/s0735-1097(99)00540-9. [DOI] [PubMed] [Google Scholar]
- 12.Palomaki H. Snoring and the risk of ischemic brain infarction. Stroke. 1991;22:1021–1025. doi: 10.1161/01.str.22.8.1021. [DOI] [PubMed] [Google Scholar]
- 13.Troxel WM, Buysse DJ, Matthews KA, Kip KE, Strollo PJ, Hall M, Drumheller O, Reis SE. Sleep symptoms predict the development of the metabolic syndrome. Sleep. 2010;33:1633–1640. doi: 10.1093/sleep/33.12.1633. [DOI] [PMC free article] [PubMed] [Google Scholar]
- 14.Cathcart RA, Hamilton DW, Drinnan MJ, Gibson GJ, Wilson JA. Night-to-night variation in snoring sound severity: one night studies are not reliable. Clin Otolaryngol. 2010;35:198–203. doi: 10.1111/j.1749-4486.2010.02127.x. [DOI] [PubMed] [Google Scholar]
- 15.Hoffstein V, Mateika S, Nash S. Comparing perceptions and measurements of snoring. Sleep. 1996;19:783–789. [PubMed] [Google Scholar]
- 16.Perez-Padilla JR, West P, Kryger M. Snoring in normal young adults: prevalence in sleep stages and associated changes in oxygen saturation, heart rate, and breathing pattern. Sleep. 1987;10:249–253. doi: 10.1093/sleep/10.3.249. [DOI] [PubMed] [Google Scholar]
- 17.Lee SA, Amis TC, Byth K, Larcos G, Kairaitis K, Robinson TD, Wheatley JR. Heavy snoring as a cause of carotid artery atherosclerosis. Sleep. 2008;31:1207–1213. [PMC free article] [PubMed] [Google Scholar]
- 18.Deary V, Ellis JG, Wilson JA, Coulter C, Barclay NL. Simple snoring: not quite so simple after all? Sleep Med Rev. 2014;18:453–462. doi: 10.1016/j.smrv.2014.04.006. [DOI] [PubMed] [Google Scholar]
- 19.Gottlieb DJ, Yao Q, Redline S, Ali T, Mahowald MW. Does snoring predict sleepiness independently of apnea and hypopnea frequency? Am J Resp Crit Care Med. 2000;162:1512–1517. doi: 10.1164/ajrccm.162.4.9911073. [DOI] [PubMed] [Google Scholar]
- 20.Hedner JA, Wilcox I, Sullivan CE. Speculations on the interaction between vascular disease and obstructive sleep apnea. In: Saunders NA, Sullivan C, editors. Sleep and breathing. Dekker; New York: 1994. [Google Scholar]
- 21.Stuck BA, Abrams J, de la Chaux R, Dreher A, Heiser C, Hohenhorst W, Kuhnel T, Maurer JT, Pirsig W, Steffen A, Verse T. Diagnosis and treatment of snoring in adults--S1 guideline of the German Society of Otorhinolaryngology, Head and Neck Surgery. Sleep Breath. 2010;14:317–321. doi: 10.1007/s11325-010-0389-5. [DOI] [PubMed] [Google Scholar]
- 22.Jin H, Lee LA, Song L, Li Y, Peng J, Zhong N, Li HY, Zhang X. Acoustic Analysis of Snoring in the Diagnosis of Obstructive Sleep Apnea Syndrome: A Call for More Rigorous Studies. J Clin Sleep Med. 2015;11:765–771. doi: 10.5664/jcsm.4856. [DOI] [PMC free article] [PubMed] [Google Scholar]
- 23.Kravitz HM, Zheng H, Bromberger JT, Buysse DJ, Owens J, Hall MH. An actigraphy study of sleep and pain in midlife women: The SWAN sleep study. Menopause. 2015;22:710–718. doi: 10.1097/GME.0000000000000379. [DOI] [PMC free article] [PubMed] [Google Scholar]
- 24.Hall M, Matthews KA, Kravitz HM, Gold EB, Buysse DJ, Bromberger JT, Owens JF, Sowers MF. Race and financial strain are independent correlates of sleep in mid-life women: The SWAN sleep study. Sleep. 2009;32:73–82. [PMC free article] [PubMed] [Google Scholar]
- 25.World Health Organization Scientific Group. Research on the Menopause in the 1990s. Geneva: World Health Organization; 1996. [PubMed] [Google Scholar]
- 26.Monk T, Reynolds CF, Buysse DJ, Coble PA, Hayes AJ, Machen MA, Petrie SR, Ritenour AM. The Pittsburgh Sleep Diary. J Sleep Res. 1994;3:111–120. [PubMed] [Google Scholar]
- 27.American Academy of Sleep Medicine Task Force. Sleep-related breathing disorders in adults: Recommendations for syndrome definition and measurement techniques in clinical research. The Report of an American Academy of Sleep Medicine Task Force. Sleep. 1999;22:667–689. [PubMed] [Google Scholar]
- 28.Issa FG, Morrison D, Hadjuk E, Iyer A, Feroah T, Remmers JE. Digital monitoring of sleep-disordered breathing using snoring sound and arterial oxygen saturation. Am Rev Respir Dis. 1993;148:1023–1029. doi: 10.1164/ajrccm/148.4_Pt_1.1023. [DOI] [PubMed] [Google Scholar]
- 29.Schwartz RS, Salome NN, Ingmundon PT, Rugh JD. Effects of electrical stimulation to the soft palate on snoring and obstructive sleep apnea. J Prosthet Dent. 1996;76:273–281. doi: 10.1016/s0022-3913(96)90171-7. [DOI] [PubMed] [Google Scholar]
- 30.Hoffstein V, Mateika JH, Mateika S. Snoring and sleep architecture. Am Rev Respir Dis. 1991;143:92–96. doi: 10.1164/ajrccm/143.1.92. [DOI] [PubMed] [Google Scholar]
- 31.Chang CC, Lin CJ. LIBSVM: A library for support vector machines. ACM Transactions on Intelligent Systems and Technology. 2011;27:1–27. [Google Scholar]


