Abstract
Force Sensitive Resistors (FSRs) are commercially available thin film polymer sensors commonly employed in a multitude of biomechanical measurement environments. Reasons for such wide spread usage lie in the versatility, small profile, and low cost of these sensors. Yet FSRs have limitations. It is commonly accepted that temperature, curvature and biological tissue compliance may impact sensor conductance and resulting force readings. The effect of these variables and degree to which they interact has yet to be comprehensively investigated and quantified. This work systematically assesses varying levels of temperature, sensor curvature and surface compliance using a full factorial design-of-experiments approach. Three models of Interlink FSRs were evaluated. Calibration equations under 12 unique combinations of temperature, curvature and compliance were determined for each sensor. Root mean squared error, mean absolute error, and maximum error were quantified as measures of the impact these thermo/mechanical factors have on sensor performance. It was found that all three variables have the potential to affect FSR calibration curves. The FSR model and corresponding sensor geometry are sensitive to these three mechanical factors at varying levels. Experimental results suggest that reducing sensor error requires calibration of each sensor in an environment as close to its intended use as possible and if multiple FSRs are used in a system, they must be calibrated independently.
Keywords: Biomechanical Measurement, Force Sensitive Resistors, FSR, Sensor Accuracy, Calibration Accuracy, Design of Experiments
Introduction
Quantifying biomechanical forces between medical devices and human soft tissue has important implications for comfort, reducing tissue injury and improving device design (Dabling et al., 2012; Lebosse et al., 2011; Mak et al., 2010). Typical measurement of these interactions requires a sensor positioned at the interface between the tissue and medical device. Many biomechanical sensors are described in literature including those based on capacitance, fluid pressure, or optics (Dabling et al., 2012), with one of the more prevalent sensors being Force Sensitive Resistors (FSRs). FSRs are constructed of thin polymer films and change resistance with the application of pressure. With sensor thicknesses as little as 0.2 mm (Dabling et al., 2012), FSRs can be positioned between two contacting surfaces with little mechanical impact on the substrates. FSRs require minimal signal conditioning, and are easily integrated with hobbyist micro-controllers through advanced data acquisition systems. FSRs are inexpensive compared to similar technologies (Dabling et al., 2012; Lebosse et al., 2011), making them an attractive option for research and clinical applications.
FSRs have been employed in numerous biomechanical applications from prosthetic control and pressure measurements (Hebert et al., 2014; Junaid et al., 2014; Silver-Thorn et al., 1996) through gait studies (Moon et al., 2011; Rueterbories et al., 2010) and telerobotics (Yun et al., 1997) among many other biomechanical applications quantifying interface mechanics (Cascioli et al., 2011; Di Fazio et al., 2011).
However, FSRs have limitations; sensor drift and hysteresis have been shown to impact repeatability and accuracy in existing systems (Dabling et al., 2012, Herbert-Copley et al., 2013). Additionally, changes in accuracy and increases in drift error when curvature is applied to the sensors have been shown in prosthetic applications (Polliack et al., 2000), but can be minimized by calibration in the same curved configuration (Buis and Convery, 1997).
FSR manufacturers often recommend calibration and operating conditions to include flat, rigid surfaces at room temperature (Interlink Electronics, 2015; TekScan, 2015). Yet the human body hosts unavoidable curvatures, soft tissue compliances, and temperature differentials. The error imparted by these variables has yet to be comprehensively investigated, preventing researchers and clinicians from understanding the implications of their biological testing environment on sensor accuracy.
Objectives
This work investigates the effects of common biomechanical variables on FSR error with the intent of examining calibration practises and providing recommendations to improve accuracy in a clinical-research environment.
Methods
Variable Testing
Experimental Variables
A full factorial design-of-experiments approach was used (Montgomery D.C., 2012). Twelve unique combinations of temperature, curvature and compliance were introduced to each FSR in a semi-randomized order (Table 1). Temperature was evaluated at room (21°C) and body (37°C) temperature; curvature at the diameter of a 95th percentile male thigh (215 mm), diameter of a 5th percentile female wrist (44 mm) (NASA, 2008) and a flat surface; and material compliance of a human soft tissue analog (SynDaver Labs, Tampa, USA) and a rigid surface.
Table 1.
Combinations of Biomechanical Variables Tested
| Combination | Temperature (°C) | Curvature (Diameter mm) | Compliance |
|---|---|---|---|
| 1 | 21°C | 215 mm | Rigid |
| 2 | 21°C | 44 mm | Rigid |
| 3 | 21°C | Flat | Rigid |
| 4 | 21°C | 215 mm | Soft |
| 5 | 21°C | 44 mm | Soft |
| 6 | 21°C | Flat | Soft |
| 7 | 37°C | 215 mm | Rigid |
| 8 | 37°C | 44 mm | Rigid |
| 9 | 37°C | Flat | Rigid |
| 10 | 37°C | 215 mm | Soft |
| 11 | 37°C | 44 mm | Soft |
| 12 | 37°C | Flat | Soft |
Setup and Procedure
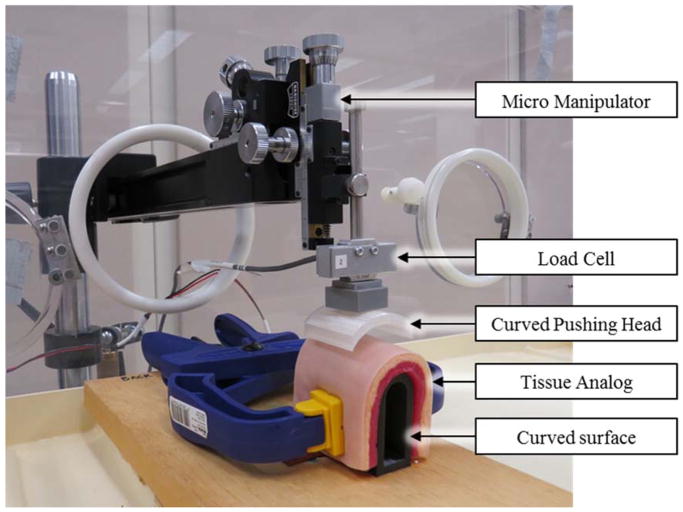
Interlink FSRs were selected for testing due to their widespread usage (Hebert et al., 2014; Jang et al., 2010; More and Lka, 2014; Rogers et al., 2010; Wang et al., 2010; Yun et al., 1997). Two small round (5 mm diameter), two medium round (13 mm diameter) and two 38 mm square (Models 400, 402 and 406 respectively, Interlink Electronics, Camarillo, USA) FSRs were tested. Once calibrated, manufacturer specifications state force accuracy in a range of ±6% to ±50% (Interlink Electronics, 2015). FSRs were wired to a data acquisition system (PCI 6259, National Instruments, Austin, TX, USA) connected to a 10 kΩ resistor in a voltage divider configuration (Interlink Electronics, 2015). FSRs were placed in-line with a load cell calibrated to an accuracy of ±0.02 N (LCM703, Omegadyne, Sunbury, USA) affixed to a micromanipulator (MM-3, Narishige Group, Tokyo JA) (Figure 1). Custom PLA-thermoplastic pushing heads were 3D printed to match the sensing surface dimensions of each FSR and introduce curvature as required (Figure 1). During testing, FSRs were pressed between the pushing head and the test surface. The testing assembly was located inside an incubator (Air-Shields C100, Soma Technology Inc., Bloomfield USA) allowing for precise temperature control.
Figure 1. Experimental Setup.
Experimental setup for testing of the 12 combinations of variables. Setup shown in the body temperature, 44 mm diameter, and soft compliance configuration.
Although the FSRs selected have a working range between 0 to 20 N of force (Interlink Electronics, 2015), a testing range of 0 to 10 N was used (Hollinger and Wanderley, 2006). The upper bound was limited to 10 N, as further force can cause discomfort if applied to human soft tissue over a small surface area (Antfolk et al., 2010; Armiger et al., 2013). Data collection was conducted according to ANSI/ISA 51.1 Standards (ANSI, 1995). Accordingly, FSRs were preconditioned and data logging was initiated mid-way through the force range. The FSRs were loaded to the maximum and minimum values three times at a consistent loading rate (Interlink Electronics, 2015) of 30 seconds/cycle. This loading rate was chosen to reflect a low frequency or static application and to avoid any time dependent dynamic effects (Interlink Electronics, 2015; Lebosse et al., 2011). FSR voltage and load cell forces were sampled at 100 Hz, low-pass filtered at 20 Hz and 10 Hz respectively, and logged at 10 Hz.
Data treatment
For each FSR, calibration equations mapping FSR voltage to applied load (load cell reading) were determined through fitting an inverse logarithmic equation (Eq. 1) as recommended (Interlink Electronics, 2015).
Equation 1.
Where F represent the force predicted from the calibration equation, V measured voltage from the FSR and a, b, and c are constants to be solved for each sensor and combination of variables.
Twelve equations per FSR were determined corresponding to the twelve combinations of temperature, curvature and compliance introduced. The fitted-root-mean-squared-error (RMSE-F), mean absolute error (MAE), and maximum error were calculated and recorded for each combination (Supplementary Table 1).
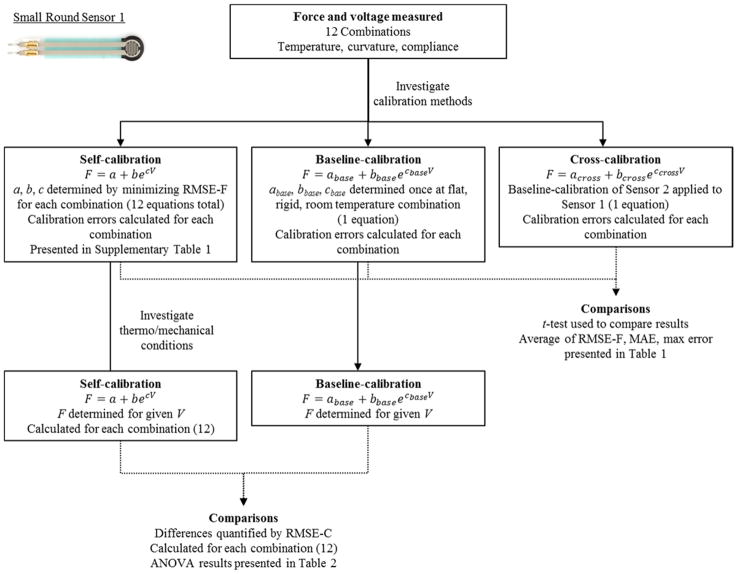
Data for each combination of biomechanical conditions was evaluated under three calibration strategies: self-fit calibration, each sensor calibrated 12 times, once for each combination of variables; baseline-fit, often recommended by manufacturers (Tekscan, 2015), each sensor is calibrated once under optimal conditions (flat, rigid, and room temperature); and cross-fit, one baseline calibration equation applied to all sensors of the same model. Mean differences in RMSE-F, MAE, and maximum error, corresponding to calibration fit strategy, were determined and statistically compared using paired t-tests, with p < 0.05 indicating significance.
The Baseline calibration equation for each sensor was defined as the flat, rigid, room temperature condition. At each of the remaining 11 combinations, calibration equations were compared to the baseline using root means squared error (RMSE-C). This procedure was performed for each sensor independently, yielding twelve RMSE-C values for each of the six sensors. A graphical example is illustrated in Figure 2.
Figure 2.
Example of the data treatment process for small round sensor 1
Three analyses of variance (ANOVAs) were performed, one for each sensor model. Since two sensors of each model were used, this data was treated as replicate measures in the statistical analysis. Temperature, curvature and compliance were held as input variables with RMSE-C evaluated as the output measure, and blocking performed by sensor number. Initially, all main effects, 2-way and 3-way interactions were evaluated with p < 0.05 indicating significance. Non-significant variables were then removed from the model. Significant main effects, significant 2-way interactions, and the main effects corresponding to any significant interactions were reported.
Participant Testing
Two healthy participants were recruited. Ethics approval was obtained through our institute’s review board and participants gave written informed consent.
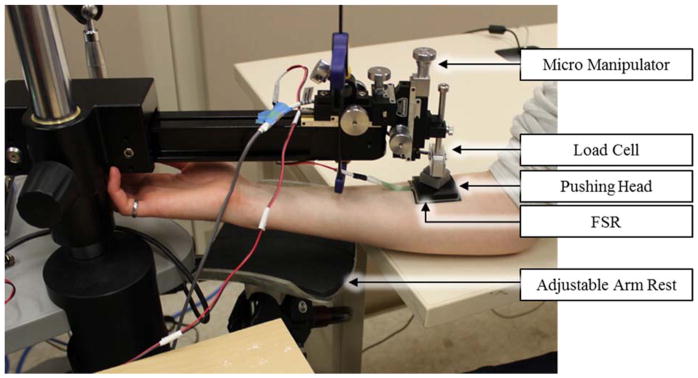
Participant testing closely paralleled the variable testing procedure described previously and was intended to simulate the implications of FSR usage in a biomechanical system. Participants’ arms were secured using an adjustable arm rest. Each FSR was adhered directly to the participants’ skin and given minimally 15 minutes to reach a stable temperature (approximately 32.5 – 34°C). Using the previously described preconditioning and loading procedures, the micromanipulator, load cell, and FSR pushing heads were then pressed tangentially onto each participant’s forearm directly over the sensor (Figure 3). FSR and load cell data was captured over a 0 to 10 N range for each FSR (small round FSRs limited to 0 – 8 N to reduce discomfort).
Figure 3.
Experimental Setup for Participant Trials
From this data, calibration equations were derived for each FSR using the same inverse logarithmic equation described previously. Comparing participant data against each sensor’s previously derived baseline equation; differences in mean RSME-C, MAE and Maximum error were evaluated using a paired t-test, with p < 0.05 indicating significance. Additionally, for each FSR, the participant calibration equations were plotted against their previously-derived baseline equations.
Results
Variable Testing
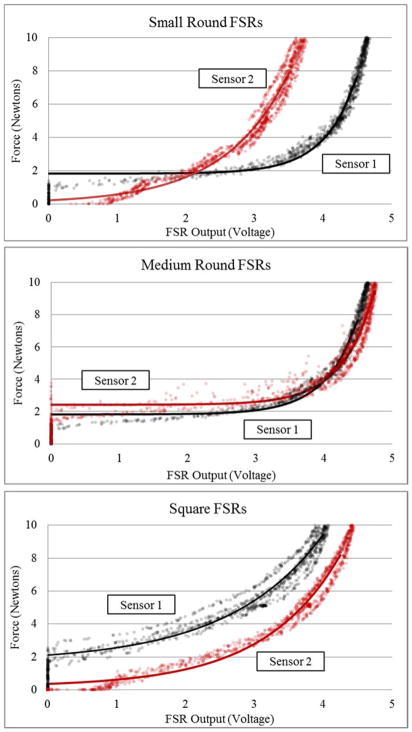
Baseline calibration curves for each of the six sensors are shown in Figure 4 and graphically highlight differences across sensors of the same model.
Figure 4. Baseline Calibration Curves.
Calibration curves for each of the 6 sensors’ force-voltage response in the room temperature, flat, rigid configuration (baseline). Calibration curves are transposed over the raw force-voltage data.
Mean RMSE-F, MAE and maximum error values categorized by sensor model are shown in Table 2. Over the tested 0 – 10 N range, all three error measures in all three sensor models were significantly lower when the self-fit calibration strategy was employed relative to the baseline and cross-fitting strategies.
Table 2.
Mean error based on calibration curve used to fit data
| Small
|
Medium
|
Square
|
|||||||
|---|---|---|---|---|---|---|---|---|---|
| Self | Baseline* | Cross* | Self | Baseline* | Cross* | Self | Baseline* | Cross* | |
| RMSE-F | 0.8±0.4 | 3.0±1.4 | 3.6±2.3 | 0.4±0.1 | 2.2±0.9 | 2.2±0.8 | 0.6±0.3 | 2.5±1.7 | 2.9±1.6 |
| MAE (N) | 0.6±0.3 | 2.5±1.2 | 3.0±2.1 | 0.3±0.1 | 1.9±0.7 | 1.8±0.7 | 0.5±0.3 | 2.2±1.6 | 2.6±1.6 |
| Max (N) | 2.3±1.2 | 6.1±2.5 | 6.7±3.1 | 1.3±0.3 | 4.5±1.3 | 4.4±1.7 | 1.6±0.8 | 4.2±2.2 | 4.8±2.2 |
Indicates significantly different from self-calibration (p < 0.05), Where RMSE-F denotes the root mean squared error for the calibration curve fit to experimental data, MAE and Max denote the mean absolute error and maximum error in force units of Newtons (N)
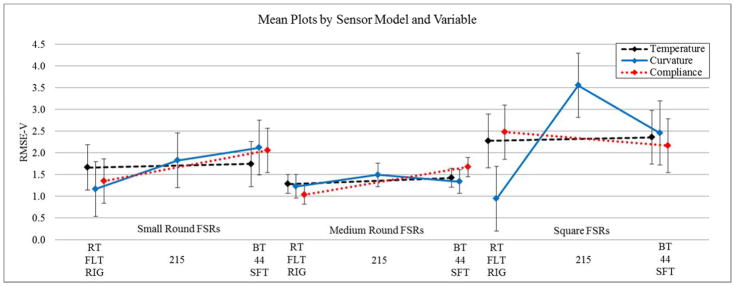
Calibration equations were investigated to determine mechanical conditions responsible for differences from the baseline calibration equations (RMSE-C). The results of the ANOVA analyses (Table 3) and the means plots highlighting the effects of individual experimental variables with all others held constant are shown in Figure 5.
Table 3.
ANOVA Table and Effects Estimates for RMSE-C
| Variables | RMSE-C | ||||
|---|---|---|---|---|---|
|
| |||||
| Effect Estimate | −95% | 95% | p-value | ||
| Small FSR | Mean | 1.92 | 1.62 | 2.22 | - |
|
|
|
||||
| Sensor (blocked) | −0.84 | −1.43 | −0.24 | <0.01* | |
|
|
|||||
| Temp | 0.46 | −0.14 | 1.05 | 0.12 | |
| Curve | −0.40 | −1.13 | 0.34 | 0.27 | |
| Comp | −0.30 | −0.90 | 0.30 | 0.31 | |
|
|
|||||
| Temp-Comp | 0.74 | 0.14 | 1.33 | 0.02* | |
| R2 = 0.45 | Curve-Comp | −1.03 | −1.76 | −0.30 | <0.01* |
|
| |||||
| Medium FSR | Mean | 1.38 | 1.22 | 1.54 | - |

|
|
||||
| Sensor (blocked) | −0.28 | −0.60 | 0.03 | 0.07 | |
| Curve | −0.17 | −0.56 | 0.22 | 0.38 | |
|
|
|||||
| Comp | −0.68 | −1.00 | −0.37 | <0.01* | |
| R2 = 0.33 | Curve-Comp | −0.75 | −1.14 | −0.36 | <0.01* |
|
| |||||
| Square FSR | Mean | 2.27 | 1.81 | 2.74 | - |

|
|
||||
| Sensor (blocked) | 0.44 | −0.49 | 1.37 | 0.33 | |
|
|
|||||
| Curve | −1.52 | −2.66 | −0.38 | 0.01* | |
| Curve(Q) | 1.69 | 0.70 | 2.68 | <0.01* | |
|
|
|||||
| Comp | 0.43 | −0.50 | 1.36 | 0.34 | |
|
|
|||||
| R2 = 0.76 | Curve(Q)-Comp | 1.57 | 0.58 | 2.56 | <0.01* |
Indicates statistical significance (p<0.05). Abbreviations Temp, Curve, and Comp denote temperature, curvature and compliance respectively. As curvature was tested at 3 levels, Curve(Q) signifies quadratic (non-linear) effects, whereas the absence of (Q) signifies linear effects. Hyphenated variables (ex. Temp-Curve) denote two way interaction effects.
Figure 5. RMSE-C Mean Plots for each Experimental Variable according to Sensor Model.
Plots highlight the effects of individual experimental variables with all others held constant. Where RMSE-V denotes the root mean squared error relative to the baseline equations. RT and BT signify room temperature and body temperature respectively. 44, 215 and flat represent sensor curvature in millimetres and SFT and RIG denote soft tissue and rigid compliance respectively. Error bars represent the ±95th confidence interval.
For the small round FSRs, ANOVA results suggested the presence of a significant linear effect of interactions between temperature and curvature as well as curvature and compliance. Blocking by sensor demonstrated a significant effect, with statistical differences in calibration equations across sensors of the same model. Medium round FSRs displayed a significant effect from tissue compliance, as well as an interaction effect between curvature and compliance. As curvature was tested at three values, both linear and quadratic main effects were evaluated. For the square FSRs, curvature was found to have both a linear and quadratic effect. Quadratic interaction effects were found between curvature and compliance.
Participant Testing
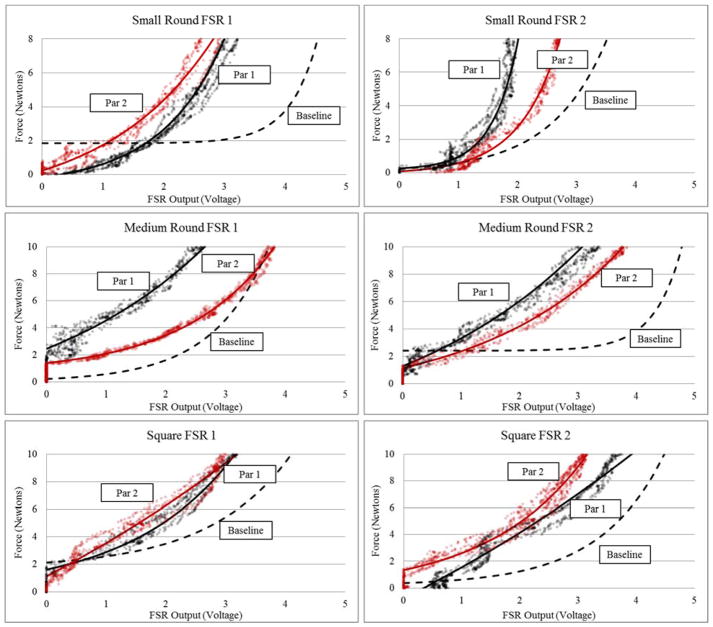
Participant data is plotted in Figure 6, highlighting differences in each FSRs force-voltage response at baseline conditions and on soft tissue. There were notable differences across sensors of the same model and between participants.
Figure 6. Participant Testing Data for Individual FSR Sensors.
Calibration curves plotted for each sensor and participant against the previously determined baseline calibration curve (under room temperature, flat, rigid conditions), where Par 1 and Par 2 abbreviates participant 1 and participant 2 respectively. Participant calibration curves are transposed over the raw force-voltage data.
Discussion
FSRs are attractive sensors for biomechanical applications due to their versatility, small profile and low cost. Yet FSRs have limitations such as sensor drift and hysteresis (Buis and Convery, 1997; Dabling et al., 2012; Herbert-Copley et al., 2013; Polliack et al., 2000b). To achieve optimal performance it is recommended that these sensors be used on flat, rigid surfaces at approximately room temperature (Interlink Electronics, 2015; TekScan, 2015). Yet in many biomechanical environments temperature differentials, curvatures and compliant tissues are unavoidable. Therefore, investigation of the effect of these variables is necessary to understand how calibration and implementation of FSRs may impact sensor accuracy.
The data supports the use of a self-fit calibration scheme to reduce calibration error and yield more accurate readings. The raw force and voltage data, and calibration curves demonstrated varying force-voltage responses from sensors of the same model even under optimal operating conditions (room temperature, flat, rigid). These curves (Figure 4) paired with the significantly higher cross-fit error data (Table 2) suggest that in a system using multiple FSRs of the same model, independent calibration equations for each sensor are necessary to minimize calibration error and improve the accuracy of the sensor readings.
The individual impact of manipulating temperature, curvature and compliance on calibration equations (in terms of RMSE-C) were investigated. No single variable impacted calibration equations for all three sensor models. Rather, each sensor model illustrated a unique combination of significant main effects and interaction effects that influenced RMSE-C values (Table 3). These main effects and interactions, if not held constant at the baseline values, will significantly impact the individual sensor’s calibration equation and force accuracy. Additionally, given that the self-fit calibration strategy yields significantly lower mean error values, error induced from biomechanical conditions of a sensor’s environment should be minimized by calibrating the FSR in an environment as close to its intended use as possible.
Participant testing highlighted that two participants tested in the same location of the body yielded different calibration curves and that these calibration curves strayed from the baseline curves for each sensor. Additionally, Figure 6 highlights changes in the dead band of each FSR (the small force application required to initially register a voltage change). By introducing the varying curvatures of a human forearm, the sensor is forced into physical configurations known to impact FSR performance such as mechanical deformation and shearing effects (Hall et al., 2008). These mechanical conditions can lower the dead band or induce an artificial preload into the sensor. In all, the biomechanical environment of a human forearm introduces inherent changes in temperature, curvature and tissue compliance relative to baseline conditions; these changes are clearly reflected in the calibration curves. These findings further illustrate the need to calibrate FSR sensors as close to their intended use as possible. In doing so, the resulting self-fit calibration equation will be specific to the participant and the individual set of mechanical variables they introduce to the sensing environment.
The results of this study highlight inherent advantages and disadvantages for each of the three calibration techniques evaluated: The self-fit strategy is a rigorous and more time consuming approach that significantly minimizes calibration error; The baseline-fit strategy is a time saving approach at the cost of increased error; The cross-fit strategy is the least time consuming approach yielding the highest calibration error.
Taken together, temperature, curvature and tissue compliance all have the potential to impact FSR calibration curves. The FSR models are sensitive to these three factors at varying levels, supporting two key recommendations:
Each FSR in a system should be calibrated independently. This may help reduce calibration error as multiple sensors of the same model demonstrated notable differences in force-voltage response.
FSRs must be calibrated in the environment of their intended use or as close as possible. This will ensure the corresponding calibration curve will account for the physical and mechanical variables affecting its force-voltage response. If the application of the FSR prohibits such a calibration strategy, the researcher or clinician must be aware of the implications on sensor accuracy.
Limitations and Future Considerations
The intent of this study was to identify biomechanical variables impacting FSR calibration and evaluate strategies to minimize calibration error. Expanding on this work and increasing the number of FSRs tested, would lend further confidence to the results discussed and provide the ability to develop a statistical model for the prediction of FSR error based on the biomechanical environment. Additional limitations of this work may lie in the choice of loading rate (30sec/ cycle). FSRs are sensitive to dynamic load rates. Further multivariate testing including load rate effects may be warranted. Finally, this work calibrates FSRs to a known force, as recommended by the manufacturer (Interlink Electronics, 2015) and standard practice in literature (Buis and Convery, 1997; Lebosse et al, 2011). Yet each sensor model has different sensing surface geometries. Calibration practices mapping FSR voltage to applied pressure may be more appropriate in future work as this would account for sensing surface geometry.
Supplementary Material
Acknowledgments
The authors would like to thank Rory Dawson and Brodi Roduta Roberts for their technical assistance.
This work was funded by the US taxpayers through the National Institutes of Health Common Fund Transformative R01 Research Award, grant number 1R01NS081710 – 01. JSS is supported by the Natural Sciences and Engineering Research Council of Canada Postgraduate Scholarship-Doctoral (PGS D) and Alberta Innovate Health Solutions Graduate Scholarship. KRE is supported by the Alberta Innovates Technology Futures Graduate Scholarship.
Footnotes
Conflict of Interests Statement
The authors have no financial or personal conflicts of interest to declare.
References
- ANSI. ANSI/ISA–51.1–1979 (R1993) Process Insturmentation Terminology. 1995. [Google Scholar]
- Antfolk C, Balkenius C, Lundborg G, Rosén B, Sebelius F. A tactile display system for hand prostheses to discriminate pressure and individual finger localization. Journal of Medical and Biological Engineering. 2010;30:355–360. [Google Scholar]
- Armiger RS, Tenore FV, Katyal KD, Johannes MS, Makhlin A, Natter ML, Colgate JE, Bensmaia SJ, Vogelstein RJ. Enabling closed-loop control of the Modular Prosthetic Limb through haptic feedback. Johns Hopkins APL Technical Digest (Applied Physics Laboratory) 2013;31:345–353. [Google Scholar]
- Buis AWP, Convery P. Calibration problems encountered while monitoring stump/socket interface pressures with force sensing resistors: Techniques adopted to minimize inaccuracies. Prosthetics and Orthotics International. 1997;21:179–182. doi: 10.3109/03093649709164552. [DOI] [PubMed] [Google Scholar]
- Cascioli V, Liu Z, Heusch AI, McArthy PW. Settling down time following initial sitting and its relationship with comfort and discomfort. Journal of Tissue Viability. 2011;20:121–129. doi: 10.1016/j.jtv.2011.05.001. [DOI] [PubMed] [Google Scholar]
- Dabling JG, Filatov A, Wheeler JW. Static and cyclic performance evaluation of sensors for human interface pressure measurement. Proceedings of the Annual International Conference of the IEEE Engineering in Medicine and Biology Society, EMBS; 2012. [DOI] [PubMed] [Google Scholar]
- Di Fazio D, Lombardo L, Gracco A, D’Amico P, Siciliani G. Lip pressure at rest and during function in 2 groups of patients with different occlusions. American Journal of Orthodontics and Dentofacial Orthopedics. 2011;139:e1–e6. doi: 10.1016/j.ajodo.2010.02.030. [DOI] [PubMed] [Google Scholar]
- Fernandes CP, Glantz PJ, Svensson SA, Bergmark A. A novel sensor for bite force determinations. Dental Materials. 2003;19:118–126. doi: 10.1016/s0109-5641(02)00020-9. [DOI] [PubMed] [Google Scholar]
- Hall RS, Desmoulin GT, Milner TE. A technique for conditioning and calibrating force-sensing resistors for repeatable and reliable measurement of compressive force. Journal of Biomechanics. 2008;41:373–377. doi: 10.1016/j.jbiomech.2008.09.031. [DOI] [PubMed] [Google Scholar]
- Hebert JS, Olson JL, Morhart MJ, Dawson MR, Marasco PD, Kuiken TA, Chan KM. Novel Targeted Sensory Reinnervation Technique To Restore Functional Hand Sensation After Transhumeral Amputation. IEEE Transactions on Neural Systems and Rehabilitation Engineering. 2014;22:765. doi: 10.1109/TNSRE.2013.2294907. [DOI] [PubMed] [Google Scholar]
- Herbert-Copley AG, Sinitski EH, Lemaire ED, Baddour N. Temperature and measurement changes over time for F-Scan sensors. MeMeA 2013 - IEEE International Symposium on Medical Measurements and Applications, Proceedings.2013. [Google Scholar]
- Hollinger A, Wanderley MM. NIME 2006. Paris, Fr: 2006. Evaluation of Commercial Force-Sensing Resistors. [Google Scholar]
- Interlink Electronics. FSR Integration Guide. 2015. [Google Scholar]
- Jang E, Cho Y, Chi S, Lee J, Kang SS, Chun B. Recognition of walking intention using multiple bio/kinesthetic sensors for lower limb exoskeletons. ICCAS 2010-International Conference on Control, Automation and Systems.2010. [Google Scholar]
- Junaid AB, Tahir S, Rasheed T, Ahmed S, Sohail M, Afzal MR, Ali M, Kim Y. Low-cost design and fabrication of an anthropomorphic robotic hand. Journal of Nanoscience and Nanotechnology. 2014;14:7427–7431. doi: 10.1166/jnn.2014.9558. [DOI] [PubMed] [Google Scholar]
- Lebosse C, Renaud P, Bayle B, De Mathelin M. Modeling and evaluation of low-cost force sensors. IEEE Transactions on Robotics. 2011;27:815–822. [Google Scholar]
- Mak AFT, Zhang M, Tam EWC. Biomechanics of pressure ulcer in body tissues interacting with external forces during locomotion. Annual Review of Biomedical Engineering. 2010;12:29–53. doi: 10.1146/annurev-bioeng-070909-105223. [DOI] [PubMed] [Google Scholar]
- Montgomery D.C. Factorials with Mixed Levels. Wiley; 2012. p. 412. [Google Scholar]
- Moon S, Lee C, Lee S. A study of knee brace locking timing and walking pattern detected from an FSR and knee joint angle. International Conference on Control, Automation and Systems.2011. [Google Scholar]
- More M, Lka O. Design of active feedback for rehabilitation robot. Applied Mechanics and Materials. 2014;611:529–535. [Google Scholar]
- NASA. Volume I Section 3: Anthropometry and Biomechanics. 2008. 2015. [Google Scholar]
- Polliack AA, Sieh RC, Craig DD, Landsberger S, McNeil DR, Ayyappa E. Scientific validation of two commercial pressure sensor systems for prosthetic socket fit. Prosthetics and Orthotics International. 2000a;24:63–73. doi: 10.1080/03093640008726523. [DOI] [PubMed] [Google Scholar]
- Polliack AA, Sieh RC, Craig DD, Landsberger S, McNeil DR, Ayyappa E. Scientific validation of two commercial pressure sensor systems for prosthetic socket fit. Prosthetics and Orthotics International. 2000b;24:63–73. doi: 10.1080/03093640008726523. [DOI] [PubMed] [Google Scholar]
- Rogers B, Zhang W, Narayana S, Lancaster JL, Robin DA, Fox PT. Force sensing system for automated assessment of motor performance during fMRI. Journal of Neuroscience Methods. 2010;190:92–94. doi: 10.1016/j.jneumeth.2010.04.011. [DOI] [PubMed] [Google Scholar]
- Rueterbories J, Spaich EG, Larsen B, Andersen OK. Methods for gait event detection and analysis in ambulatory systems. Medical Engineering and Physics. 2010;32:545–552. doi: 10.1016/j.medengphy.2010.03.007. [DOI] [PubMed] [Google Scholar]
- Silver-Thorn MB, Steege JW, Childress DS. A review of prosthetic interface stress investigations. Journal of Rehabilitation Research and Development. 1996;33:253–266. [PubMed] [Google Scholar]
- TekScan. Pressure Mapping, Force Measurement & Tactile Sensors. 2015;2015 [Google Scholar]
- Wang X, Zhao J, Yang D, Li N, Sun C, Liu H. Biomechatronic approach to a multi-fingered hand prosthesis. 2010 3rd IEEE RAS and EMBS International Conference on Biomedical Robotics and Biomechatronics, BioRob 2010.2010. [Google Scholar]
- Yun MH, Cannon D, Freivalds A, Thomas G. An instrumented glove for grasp specification in virtual-reality-based point-and-direct telerobotics. IEEE Transactions on Systems, Man. 1997 doi: 10.1109/3477.623236. [DOI] [PubMed] [Google Scholar]
Associated Data
This section collects any data citations, data availability statements, or supplementary materials included in this article.


