

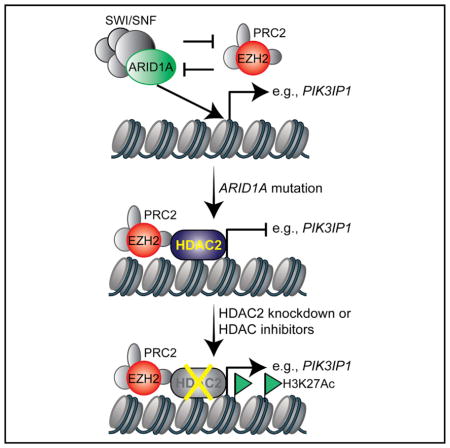
SUMMARY
ARID1A , a subunit of the SWI/SNF complex, is among the most frequently mutated genes across cancer types. ARID1A is mutated in more than 50% of ovarian clear cell carcinomas (OCCCs), diseases that have no effective therapy. Here, we show that ARID1A mutation confers sensitivity to pan-HDAC inhibitors such as SAHA in ovarian cancers. This correlated with enhanced growth suppression induced by the inhibition of HDAC2 activity in ARID1A-mutated cells. HDAC2 interacts with EZH2 in an ARID1A status-dependent manner. HDAC2 functions as a co-repressor of EZH2 to suppress the expression of EZH2/ARID1A target tumor suppressor genes such as PIK3IP1 to inhibit proliferation and promote apoptosis. SAHA reduced the growth and ascites of the ARID1A-inactivated OCCCs in both orthotopic and genetic mouse models. This correlated with a significant improvement of survival of mice bearing ARID1A-mutated OCCCs. These findings provided preclinical rationales for repurposing FDA-approved pan-HDAC inhibitors for treating ARID1A-mutated cancers.
In Brief
Fukumoto et al. show that ARID1A mutation confers sensitivity to pan-HDAC inhibitors such as SAHA in ovarian cancers. This correlated with enhanced growth suppression induced by the inhibition of HDAC2 activity in ARID1A-mutated cells. These findings provided preclinical rationales for repurposing FDA-approved pan-HDAC inhibitors for treating ARID1A-mutated cancers.
INTRODUCTION
SWI/SNF chromatin remodeling complexes regulate gene transcription by changing chromatin accessibility through hydrolyzation of ATP (Wilson and Roberts, 2011). Cancer genome sequencing revealed that mutations in genes encoding for the subunits of the SWI/SNF complexes collectively occur in ~20% of all human cancers (Kadoch et al., 2013). For example, saturation analysis of The Cancer Genome Atlas (TCGA) cancer mutational profile finds that the ARID1A subunit of the SWI/SNF complex is among the genes that show the highest mutation rates across multiple cancer types (Lawrence et al., 2014). ARID1A is mutated in more than 50% of ovarian clear cell carcinomas (OCCCs) and 30% of ovarian endometrioid carcinomas (OECs) (Jones et al., 2010; Wiegand et al., 2010). ARID1A mutation is a known genetic driver of ovarian cancer. More than 90% of the ARID1A mutations observed in ovarian cancer are frame-shift or nonsense mutations that result in the loss of ARID1A protein expression (Jones et al., 2010; Wiegand et al., 2010). Loss of ARID1A correlates with late-stage disease and predicts early recurrence of OCCC (Ye et al., 2016). OCCC ranks second as the cause of death from ovarian cancer and is associated with the worst prognosis among the major ovarian cancer subtypes when diagnosed at advanced stages (Chan et al., 2008; Mackay et al., 2010). For advanced-stage disease, there is no effective therapy. In Japan, its prevalence is higher than in western countries, with an estimated incidence of ~25% of ovarian cancers (Saito and Katabuchi, 2016). ARID1A is mutated in ~62% of Japanese OCCC patients (Murakami et al., 2017).
Histone deacetylases (HDACs) are established targets against cancers (West and Johnstone, 2014). Several HDAC inhibitors have been approved by the U.S. Food and Drug Administration (FDA) for treating hematopoietic malignancies. The most extensively studied and commonly used HDAC inhibitor is suberoylanilide hydroxamine (SAHA or vorinostat). SAHA is a nonselective pan-HDAC inhibitor and was the first FDA-approved HDAC inhibitor (Mann et al., 2007). HDAC2 belongs to class I HDACs that function to remove acetyl groups from histones to condense chromatin and repress transcription (West and Johnstone, 2014). High expression of HDAC2 is associated with poor outcomes in ovarian cancer (Weichert et al., 2008). However, whether HDAC2 can be explored as a therapeutic target for ARID1A-mutated cancers has never been investigated. Here we show that ARID1A-mutated ovarian cancers are selectively sensitive to HDAC2 inhibition. The HDAC inhibitor SAHA reduces the tumor burden of ARID1A-mutated ovarian cancer and improves the survival of mice bearing ARID1A-mutated ovarian cancers. Our findings provide scientific rationale for repurposing FDA-approved HDAC inhibitors such as SAHA for ARID1A-mutated cancers.
RESULTS
HDAC2 Interacts with EZH2 in an ARID1A Status-Dependent Manner
Because EZH2 inhibition is synthetically lethal with ARID1A mutation (Bitler et al., 2015; Januario et al., 2017; Kim et al., 2015), and EZH2-containing PRC2 complex interacts with HDAC2 (van der Vlag and Otte, 1999), we sought to determine whether ARID1A regulates the interaction between EZH2 and HDAC2. Co-immunoprecipitation (coIP) analysis revealed that EZH2 and HDAC2 interact with each other in ARID1A-mutated TOV21G cells (Figure 1A). However, restoration of wild-type ARID1A impaired the interaction between EZH2 and HDAC2 (Figure 1A). EZH2 did not interact with HDAC2 in ARID1A wild-type RMG1 cells, whereas CRISPR-mediated knockout of ARID1A promoted their interaction (Figure S1A). As a control, there is no interaction based on coIP analysis between EZH2 and HDAC1 regardless of ARID1A status (Figure S1B). In addition, ARID1A does not interact with HDAC2 in ARID1A wild-type cells (Figure S1C). Consistent with previous reports (Helming et al., 2014), wild-type ARID1A restoration decreased the expression of ARID1B, the mutually exclusive subunit of ARID1A, in ARID1A-mutated cells (Figure S1D). However, HDAC2 did not interact with ARID1B in ARID1A-mutated cells (Figure S1E). Thus, we conclude that HDAC2 interacts with EZH2 in an ARID1A status-dependent manner.
Figure 1. HDAC2 Inhibition Suppresses Cell Growth and Induces Apoptosis in ARID1A-Inactivated Cells.

(A) ARID1A-mutated TOV21G cells with or without wild-type ARID1A restoration were subjected to co-immunoprecipitation (coIP) analysis using antibodies against EZH2 or HDAC2 or an immunoglobulin G (IgG) control. Immunoblots of the indicated proteins were performed.
(B) Immunoblot of the indicated proteins in parental and ARID1A CRISPR RMG1 cells.
(C) Indicated cells were grown in 3D using Matrigel. Scale bars, 75 measurable units (a.u.) using NIH ImageJ software.
(D) Quantification of the diameter of acini formed by the indicated cells in 3D culture. *p < 0.05. n = 3.
(E) Quantification of the number of cells recovered from 3D culture of the indicated cells. *p < 0.05. n = 3.
(F) ARID1A-mutated TOV21G cells with endogenous HDAC2 knockdown using a shRNA that targets the 3′ UTR region of the human HDAC2 gene were concurrently expressing a FLAG-tagged, shRNA-resistant wild-type HDAC2 or a catalytically inactivated H142A HDAC2 mutant. Expression of HDAC2, FLAG, and β-actin was determined by immunoblot.
(G) Same as (F), but the indicated cells were subjected to growth analysis using the colony formation assay. Integrated density of colonies formed by the indicated cells was quantified. n = 4.
(H) Immunofluorescence staining of Ki67 (red), cleaved caspase-3 (green), and DAPI (blue) of the acini formed by ARID1A-mutated TOV21G cells with or without HDAC2 knockdown in 3D culture on day 12. Scale bars, 20 μm.
(I and J) Quantification of (H). 200 cells from each indicated group were examined for expression cleaved caspase-3 (I) or Ki67 (J). n = 3.
(K) ARID1A-mutated TOV21G cells with or without HDAC2 knockdown were examined for expression of markers of apoptosis cleaved caspase-3 and cleaved PARP p85, HDAC2, and GAPDH by immunoblot.
Error bars represent the SEM p value calculated with two-tailed t test. See also Figure S1.
HDAC2 Inhibition Suppresses Growth and Induces Apoptosis in ARID1A-Inactivated Cells
We next sought to determine whether ARID1A status affects response to HDAC2 inhibition. ARID1A knockout significantly enhanced the growth inhibition induced by HDAC2 knockdown in ARID1A wild-type RMG1 cells in both conventional two-dimensional (2D) cultures and three-dimensional (3D) cultures using Matrigel that more closely mimic the tumor environment (Figures 1B–1E, S1F, and S1G). Similar observations were made using additional ARID1A wild-type and mutated OCCC cell lines, as well as primary OCCC cultures from tumors with or without ARID1A expression (Figures S1H–S1R). Restoration of wild-type ARID1A in ARID1A-mutated cells de-sensitized these cells to HDAC2 knockdown (Figures S1S–S1V). We next sought to determine whether the observed sensitivity depends on the catalytic activity of HDAC2. The observed growth inhibition induced by HDAC2 knockdown can be rescued by a short hairpin RNA (shRNA)-resistant wild-type HDAC2, but not a mutant HDAC2 H142A that is deficient for its catalytic activity (Figures 1F, 1G, S1W, and S1X) (Kobayashi et al., 2017). Compared with ARID1A-proficient cells, ARID1A-deficient cells are more sensitive to CAY10683, a relatively selective tool HDAC2 inhibitor (Figure S1Y) (Pavlik et al., 2013). Altogether, we conclude that HDAC2 interacts with EZH2 in an ARID1A status-dependent manner, which correlates with the observed changes in sensitivity to inhibition of HDAC2 activity.
We next determined the expression of markers of apoptosis in ARID1A wild-type and mutated cells with or without HDAC2 knockdown by immunofluorescence staining of cleaved caspase-3, a marker of apoptosis, in acini formed in 3D culture (Figures 1H and S1Z). Cleaved caspase-3 was significantly induced by HDAC2 knockdown in ARID1A-mutated cells, but not wild-type cells (Figures 1I and S1AA). This was accompanied by a significant decrease in the cell proliferation marker Ki67 in ARID1A-mutated cells, but not wild-type cells (Figures 1J and S1AB). Immunoblot experiments revealed that markers of apoptosis such as cleaved caspase-3 and cleaved PARP p85 were significantly induced by HDAC2 knockdown in ARID1A-mutated cells, but not wild-type cells (Figures 1K and S1AC). Knockdown of EZH2- or HDAC2-induced growth inhibition and apoptosis were comparable, and there were no significant additive effects on growth inhibition or apoptosis induced by knockdown of EZH2 and HDAC2 (Figures S1AD–S1AE).
HDAC2 Regulates Expression of EZH2/ARID1A Target Gene PIK3IP1
To identify genes that are repressed by HDAC2, we performed RNA sequencing (RNA-seq) analysis in TOV21G cells with or without knockdown of HDAC2 expression by two independent short hairpin HDAC2s (shHDAC2s). RNA-seq analysis revealed that 1,111 genes were significantly upregulated by HDAC2 knockdown (GEO: GSE107201). Given that EZH2 and HDAC2 interaction is ARID1A status dependent and HDAC2 represses gene expression, we cross-referenced genes upregulated by HDAC2 knockdown with 45 EZH2/ARID1A target genes we have previously identified (Bitler et al., 2015). There is a significant enrichment of EZH2/ARID1A targets in genes upregulated by HDAC2 knockdown (Figure 2A). Among the identified genes, PIK3IP1, an inhibitor of phosphatidylinositol 3-kinase (PI3K)/AKT signaling (Zhu et al., 2007), plays a major role in apoptosis induced by EZH2 inhibition in ARID1A-mutated cells (Bitler et al., 2015). Thus, we explored whether HDAC2 regulates PIK3IP1 expression in an ARID1A status-dependent manner. HDAC2 knockdown induced PIK3IP1 expression in ARID1A-mutated cells, but not wild-type cells (Figures 2B and S2A). ARID1A knockout in ARID1A wild-type cells led to upregulation of PIK3IP1 by HDAC2 knockdown (Figure S2B), while wild-type ARID1A restoration in ARID1A-mutated cells suppressed HDAC2 knockdown-induced PIK3IP1 upregulation (Figure 2C). Consistent with previous reports (Weichert et al., 2008), compared with normal human ovarian surface epithelial cells, HDAC2 is expressed at higher levels in laser capture and micro-dissected OCCCs in a published dataset (Figure S2C) (Stany et al., 2011). Based on protein expression as determined by immunohistochemical (IHC) staining in 105 human OCCC and OEC specimens, HDAC2 negatively correlated with PIK3IP1 expression, while ARID1A positively correlated with PIK3IP1 expression (Figures 2D–2F). Altogether, these results support that HDAC2 and ARID1A antagonistically regulate PIK3IP1 expression.
Figure 2. HDAC2 and ARID1A Antagonistically Regulate PIK3IP1 Expression.

(A) ARID1A-mutated TOV21G cells expressing two independent shHDAC2s or control were subjected to RNA-seq analysis. The genes upregulated by both shHDAC2s were cross-referenced with ARID1A/EZH2 target genes (Bitler et al., 2015).
(B and C) Immunoblot of the indicated proteins in ARID1A-mutated TOV21G without (B) or with (C) wild-type ARID1A restoration with or without HDAC2 knockdown by two independent shHDAC2s.
(D) Representative images of immunohistochemical staining using the indicated antibodies in 105 human ovarian clear cell carcinoma (OCCC) and ovarian endometrioid carcinoma (OEC) specimens. Scale bar, 100 μm.
(E and F) Quantification of (D). Expression of PIK3IP1, ARID1A, and HDAC2 was scored as high or low based on histological scores (H-scores). An H-score higher than the median of H-scores was considered high, and one lower than the median of H-scores was considered low. Correlation between HDAC2 and PIK3IP1 expression (E) and between ARID1A and PIK3IP1 (F) was examined. The p value was calculated by two-tailed Fisher’s exact test.
(G–J) Immunoblot of the indicated proteins in ARID1A-mutated TOV21G cells expressing shHDAC2, shPIK3IP1, or a combination (G). The indicated cells were subjected to 2D colony formation assay and 3D growth using Matrigel (H). Scale bar, 75 measurable units (a.u.) using NIH ImageJ software. n = 3. Integrated density of colonies formed in 2D was quantified (I). n = 4. The diameter of acini formed by the indicated cells in 3D was quantified (J). n = 3. Error bars represent the SEM p value calculated with two-tailed t test.
See also Figure S2.
We next determined the role of PIK3IP1 upregulation in mediating the observed sensitivity induced by HDAC2 inhibition. Toward this goal, we knocked down PIK3IP1 in HDAC2 knockdown, ARID1A-mutated TOV21G cells (Figure 2G). PIK3IP1 knockdown significantly impaired the growth inhibition induced by HDAC2 knockdown in both 2D and 3D cultures (Figures 2H–2J), which correlated with a suppression of apoptosis markers induced by HDAC2 knockdown (Figure 2G). Consistent with previous reports that PIK3IP1 suppresses PI3K/AKT signaling (Zhu et al., 2007), the observed changes correlated with the restoration of phosphor-AKT1 levels in PIK3IP1 knockdown cells (Figure 2G).
We next sought to determine whether HDAC2’s association with the PIK3IP1 gene promoter is regulated. Toward this goal, we performed chromatin immunoprecipitation (ChIP) analysis for HDAC2 in ARID1A wild-type RMG1 cells with or without ARID1A knockout. There is no significant association of HDAC2 with the PIK3IP1 gene promoter in ARID1A wild-type cells (Figure 3A). In contrast, ARID1A knockout led to a significant increase in the association of HDAC2 with the PIK3IP1 gene promoter (Figure 3B). HDAC2 knockdown significantly increased H3K27ac on the PIK3IP1 gene promoter in ARID1A knockout cells, but not ARID1A wild-type cells (Figures 3A and 3B). This correlates with a significant increase in the association of RNA polymerase II (Pol II) with the PIK3IP1 gene promoter in ARID1A knockout cells, but not ARID1A wild-type cells (Figures 3A and 3B). Consistent with previous reports (Bitler et al., 2015), EZH2’s association with the PIK3IP1 gene promoter was not affected by ARID1A status (Figures S3A and S3B). Similar to what we observed in ARID1A knockout cells, HDAC2’s association with the PIK3IP1 gene promoter was reduced by HDAC2 knockdown in ARID1A-mutated cells (Figure 3C). This correlated with an increase in H3K27ac and RNA Pol II’s association with the PIK3IP1 gene promoter in ARID1A-mutated TOV21G cells (Figure 3C). In contrast, there were no changes in EZH2’s association with the PIK3IP1 gene promoter in ARID1A-mutated TOV21G cells (Figure S3C). HDAC2’s association with the PIK3IP1 promoter was not affected by knockdown of EZH2 (Figure S3D) or ARID1B in ARID1A-mutated TOV21G cells (Figures S3E and S3F). Altogether, these data support a model whereby ARID1A prevents the binding of HDAC2 to the PIK3IP1 gene promoter (Figure S3G). This model is consistent with the findings that HDAC2 and EZH2 interact with each other in ARID1A-mutated cells, but not wild-type cells.
Figure 3. HDAC2 Directly RegulatesPIK3IP1 Gene in an ARID1A Status-Dependent Manner.

(A–C) ARID1A wild-type RMG1 cells (A), ARID1A CRISPR RMG1 cells (B), and ARID1A-mutated TOV21G cells (C) with or without HDAC2 knockdown were subjected to ChIP analysis for the PIK3IP1 gene promoter using the indicated antibodies. An isotype-matched IgG was used as a control. n = 4. Error bars represent the SEM p value calculated with two-tailed t test. See also Figure S3.
SAHA Reduced Tumor Burden and Improved Survival of Mice Bearing ARID1A-Inactivated Ovarian Cancers
There is no selective HDAC2 inhibitor available for in vivo animal studies. Thus, we explored the therapeutic potential for SAHA, an FDA-approved pan-HDAC inhibitor that is suitable for in vivo animal studies (Mann et al., 2007), in ARID1A-mutated ovarian cancers of preclinical models. Compared with ARID1A wild-type cells, the half maximal inhibitory concentration (IC50) of SAHA is significantly lower in ARID1A-mutated cells (Figure 4A; Table S1).
Figure 4. SAHA Reduced Tumor Burden and Improved Survival of Mice BearingARID1A-Inactivated Ovarian Cancers.

(A) The IC50 of SAHA is significantly higher in ARID1A wild-type cells than in mutated cells. Red labels indicate primary OCCC cultures.
(B–F) Mice with established TOV21G tumors were randomized and treated with vehicle control or SAHA (50 mg/kg) daily by i.p. injection for 3 weeks. Representative images of reproductive tracks with tumors treated with vehicle control or SAHA (B). Scale bar, 10 mm. Tumor weigh was quantified and used as a surrogate for tumor burden (C). Representative images of ascites collected from the mice treated with vehicle control or SAHA (D). The volume of ascites produced was quantified (E). After stopping the treatment, the mice from the indicated groups were followed for survival (F).
(G–L) Pik3caH1047R/Arid1aflox/flox-driven OCCCs were allowed to establish for 5 weeks and then were randomized and treated daily with 50 mg/kg of i.p. SAHA or vehicle control for 3 weeks. Representative images of mice treated with vehicle control or SAHA (G). White dashed lines indicate reproduction tracks, and the yellow dashed circle indicates the tumor formed. Images of dissected reproductive tracks with tumors from mice treated with vehicle control or SAHA (H). Scale bar, 10 mm. Tumor weigh was quantified and used as a surrogate for tumor burden (I). Representative images of ascites collected from the mice treated with vehicle control or SAHA (J). The volume of ascites produced was quantified (K). After stopping the treatment, the mice from the indicated groups were followed for survival (L).
(M and N) Same as (B). The consecutive sections of the xenograft tumors dissected from the indicated treatment groups were subjected to immunohistochemical staining using the indicated antibodies (M). Scale bar, 50 μm. H-score was quantified (N).
Error bars represent the SEM p value calculated with two-tailed t test. See also Figure S4 and Table S1.
To determine the effects of HDAC2 inhibition in vivo on the growth of ARID1A-mutated tumors, we orthotopically transplanted luciferase-expressing ARID1A-mutated TOV21G cells into the bursa sac covering the ovary of immunocompromised nude mice to mimic the tumor microenvironment. The injected ARID1A wild-type or mutant cells were allowed to grow for 1 week to establish the orthotopic tumors. Mice were then randomized and treated daily for 3 weeks with vehicle control or SAHA (50 mg/kg) by intraperitoneal (i.p.) injection at the same dose as previously reported (Butler et al., 2000). SAHA treatment significantly inhibited the growth of xenografted ARID1A-mutated tumors (Figures S4A and S4B). We next examined the effects of SAHA treatment on the tumor burden of the transplanted ARID1A-mutated cells. Using tumor weight as a surrogate, we found that SAHA treatment significantly reduced the burden of orthotopically xenografted ARID1A-mutated tumors (Figures 4B and 4C). Malignant ascites presents a considerable clinical challenge to the management of ovarian cancer (Kipps et al., 2013). Thus, we examined the effects of SAHA treatment on ascites production. SAHA significantly reduced the amount of ascites formed in mice bearing ARID1A-mutated tumors (Figures 4D and 4E). We next followed the survival of the treated mice after discontinuing the treatment regimens. Compared with vehicle controls, SAHA significantly improved the survival of mice bearing the orthotopically transplanted ARID1A-mutated tumors (Figure 4F). Likewise, SAHA significantly suppressed tumor growth, reduced the amount of ascites, and improved the survival in the pre-established, conditional Arid1a−/−/Pik3caH1047R-immuno-competent genetic OCCC mouse model (Figures 4G–4L). As a control, SAHA did not significantly affect the growth of ortho-topically transplanted ARID1A wild-type RMG1 tumors (Figures S4C and S4D). Thus, we conclude that SAHA significantly improved the survival of mice bearing ARID1A-mutated ovarian tumors.
Finally, we sought to correlate the observed improvement of survival, suppression of tumor growth, and reduction in tumor burden in vivo with the molecular pathways we have revealed in vitro. To do so, we performed IHC analysis for markers of cell proliferation (Ki67), apoptosis (cleaved caspase-3), and PIK3IP1 in the dissected ARID1A-mutated tumors treated with SAHA or controls. SAHA significantly decreased the cell proliferation marker Ki67 and increased the apoptotic marker cleaved caspase-3 (Figures 4M and 4N). Furthermore, PIK3IP1 staining was significantly increased by SAHA treatment (Figures 4M and 4N). ARID1A-mutated tumors also depend on HDAC6 activity, which is due to the deacetylation of pro-apoptotic lysine 120 residue of p53 (p53K120ac) by HDAC6 (Bitler et al., 2017). However, the dose of SAHA used in the present study did not significantly affect p53K120ac levels, suggesting that the observed anti-tumor effects are independent of HDAC6 (Figures S4E and S4F). Altogether, we conclude that SAHA suppresses the growth of ARID1A-mutated ovarian tumors, which correlates with a decrease in cell proliferation, an increase in apoptosis, and an upregulation of HDAC2/ARID1A target gene PIK3IP1 in the treated ARID1A-mutated tumors.
DISCUSSION
Here, we show that ARID1A-mutated ovarian cancer cells are sensitive to HDAC2 inhibition. This correlates with the recruitment of HDAC2 to the ARID1A/EZH2 target genes such as PIK3IP1 in an ARID1A status-dependent manner. HDAC2 and EZH2 interact with each other in ARID1A-deficient cells, but not in ARID1A-proficient cells. This supports the notion that the presence of ARID1A in the ARID1A/EZH2 target gene promoters prevented the recruitment of HDAC2 to these loci (Figure S3G). Growth inhibition and apoptosis induced by HDAC2 and EZH2 inhibition are comparable in ARID1A-mutated cells. However, it might be advantageous to inhibit HDAC2 and EZH2 activity simultaneously to prevent the development of resistance to inhibition of either HDAC2 or EZH2 alone. HDAC2 does not interact with either ARID1A or ARID1B. However, it is possible that ARID1A is mutually exclusive to an HDAC2-containing complex other than HDAC2-EZH2. We previously showed that ARID1A-mutated ovarian cancers depend on HDAC6 activity due to direct suppression of HDAC6 gene by ARID1A (Bitler et al., 2017). In ARID1A wild-type cells, HDAC2 knockdown did not show selectivity against shRNA-mediated ARID1A knockdown (Bitler et al., 2017). In contrast, here we showed that compared with ARID1A wild-type cells, CRISPR-mediated ARID1A knockout cells are more sensitive to HDAC2 knockdown (Figures 2B–2E). This highlighted the advantage of performing analysis in complete-knockout cells compared to partial-knockdown cells. In addition to HDAC2, pan-HDAC inhibitors inhibit the activities of other HDACs that are equally effective in suppressing both ARID1A-deficient and ARID1A-proficient cells (Bitler et al., 2017). However, the IC50 of SAHA is significantly lower in ARID1A-mutated cells compared with ARID1A wild-type cells (Figure 4A). This suggests selectivity can be achieved with pan-HDAC inhibitors in ARID1A-inactivated cells.
In summary, our studies demonstrate that targeting HDAC2 activity using pan-HDAC inhibitors such as SAHA in ARID1A-mutated cells represents an urgently needed therapeutic strategy. SAHA is FDA approved. Thus, our studies provide a scientific rationale for a potential translation of these findings by repurposing the FDA-approved pan-HDAC inhibitors such as SAHA for ARID1A-mutated ovarian cancers, for which no effective therapies exist. Given that mutation and loss of expression of ARID1A and genetic alterations in other subunits of ATP-dependent chromatin remodeling complexes are observed in ~20% of all human cancers (Kadoch et al., 2013), our findings may have far-reaching implications for improving therapy for an array of cancer types.
EXPERIMENTAL PROCEDURES
ChIP
ChIP was performed as previously described (Bitler et al., 2015). The following antibodies were used to perform ChIP: anti-HDAC2 (Abcam), anti-H3K27ac (Millipore), anti-Pol II (Santa Cruz), and anti-EZH2 (Cell Signaling). Isotype-matched immunoglobulin G was used as a negative control. ChIP DNA was analyzed by qPCR against the promoter of the human PIK3IP1 gene using the following primers: forward, 5′-AGGTGATTGAACGACCAGTG-3′, and reverse, 5′-GGGAAGCTCCCAGTTCTAAAG-3′.
Orthotopic Xenograft Ovarian Cancer Mouse Models In Vivo
The protocols were approved by the Institutional Animal Care and Use Committee (IACUC). For in vivo experiments, the sample size of mice per group was determined based on the data shown from in vitro experiments. Intrabursal orthotopic xenograft was performed as described previously (Bitler et al., 2015). Briefly, 1 × 10⁶ luciferase-expressing, ARID1A-mutated TOV21G or ARID1A wild-type RMG1 cells were unilaterally injected into the ovarian bursa sac of 6- to 8-week-old female immunocompromised NOD scid gamma mice (NSG) mice. One week after injection of TOV21G cells, we visualized tumors by injecting luciferin (i.p.; 4 mg per mouse) resuspended in PBS and imaged with an In Vivo Imaging System (IVIS) Spectrum imaging system. The mice were then randomized into two groups based on luciferase activity and treated with vehicle control (2% DMSO/30% polyethylene glycol [PEG] 300/double distilled water [ddH2O]) or SAHA (50 mg/kg) daily by i.p. injection for an additional 3 weeks. Images were analyzed using Live Imaging 4.0 software. Imaging analysis was performed blindly, but not randomly. Animal experiments were randomized. There was no exclusion from the experiments.
Arid1a−/−/Pik3caH1047R Genetic Clear Cell Ovarian Tumor Mouse Model
All experiments were approved by the IACUC. Transgenic mice with latent mutations in Arid1a and Pik3ca were generated by crossing Arid1aflox/flox mice (provided by Dr. Wang, University of Michigan, and crossed onto a C57BL/6J background for 9 generations) with R26-Pik3caH1047R mice carrying inducible Pik3ca mutations (Jackson Laboratory, Jax 016977) as previously described (Bitler et al., 2017). All mice were maintained in specific pathogen-free barrier facilities. To induce tumorigenesis, 6- to 10-week-old Pik3caH1047R/Arid1a−/− female mice were intrabursally injected with adenovirus-Cre as previously described (Bitler et al., 2017). 5 weeks after adenovirus-Cre injection, mice with palpable tumors were randomized and treated with SAHA (50 mg/kg) or vehicle control for 21 days. Following treatment, mice were sacrificed and the tumors were surgically dissected or followed for survival.
Statistical Analysis
Statistical analyses were performed using GraphPad Prism 6 (GraphPad) for Mac OS. Quantitative data are expressed as mean ± SEM unless otherwise stated. ANOVA with Fisher’s least significant difference was used to identify significant differences among multiple groups. For all statistical analyses, the level of significance was set at 0.05.
Supplementary Material
Highlights.
ARID1A inactivation enhanced growth suppression induced by HDAC2 inhibition
HDAC2 interacts with EZH2 in an ARID1A status-dependent manner
HDAC2 functions as a co-repressor of EZH2 to promote apoptosis
SAHA improved the survival of mice bearing ARID1A-mutated cancer
Acknowledgments
We thank Dr. Cigall Kadoch for the ARID1A CRISPR plasmid and Drs. David Hunstman and Yemin Wang for primary ovarian clear cell carcinoma cultures. This work was supported by the NIH (R01CA160331, R01CA163377, and R01CA202919 to R.Z. and R00CA194318 to B.G.B.), the U.S. Department of Defense (OC140632P1 and OC150446 to R.Z.), and an Ovarian Cancer Research Fund Alliance (OCRFA) program project (#291009 to R.Z.). Support of core facilities was provided by a Cancer Centre Support Grant (CCSG) (CA010815) to The Wistar Institute.
Footnotes
DATA AND SOFTWARE AVAILABILITY
The accession number for the RNA-sequence data reported in this paper is GEO: GSE107201.
Supplemental Information includes Supplemental Experimental Procedures, four figures, and one table and can be found with this article online at https://doi.org/10.1016/j.celrep.2018.03.019.
AUTHOR CONTRIBUTIONS
T.F., P.H.P., S.W., N.F., S.K., and T.N. performed the experiments and analyzed data. B.G.B. and R.Z. designed the experiments. A.V.K. performed the bioinformatics analysis. D.W.S., S.J., L.Z., and J.R.C.-G. participated in the experimental design. T.-L.W. and I.-M.S. contributed key reagents. T.F., B.G.B., J.R.C.-G., and R.Z. wrote the manuscript. R.Z. conceived the study.
DECLARATION OF INTERESTS
The authors declare no competing interests.
References
- Bitler BG, Aird KM, Garipov A, Li H, Amatangelo M, Kossenkov AV, Schultz DC, Liu Q, Shih IeM, Conejo-Garcia JR, et al. Synthetic lethality by targeting EZH2 methyltransferase activity in ARID1A-mutated cancers. Nat Med. 2015;21:231–238. doi: 10.1038/nm.3799. [DOI] [PMC free article] [PubMed] [Google Scholar]
- Bitler BG, Wu S, Park PH, Hai Y, Aird KM, Wang Y, Zhai Y, Kossenkov AV, Vara-Ailor A, Rauscher FJ, III, et al. ARID1A-mutated ovarian cancers depend on HDAC6 activity. Nat Cell Biol. 2017;19:962–973. doi: 10.1038/ncb3582. [DOI] [PMC free article] [PubMed] [Google Scholar]
- Butler LM, Agus DB, Scher HI, Higgins B, Rose A, Cordon-Cardo C, Thaler HT, Rifkind RA, Marks PA, Richon VM. Suberoylanilide hydroxamic acid, an inhibitor of histone deacetylase, suppresses the growth of prostate cancer cells in vitro and in vivo. Cancer Res. 2000;60:5165–5170. [PubMed] [Google Scholar]
- Chan JK, Teoh D, Hu JM, Shin JY, Osann K, Kapp DS. Do clear cell ovarian carcinomas have poorer prognosis compared to other epithelial cell types? A study of 1411 clear cell ovarian cancers. Gynecol Oncol. 2008;109:370–376. doi: 10.1016/j.ygyno.2008.02.006. [DOI] [PubMed] [Google Scholar]
- Helming KC, Wang X, Wilson BG, Vazquez F, Haswell JR, Manchester HE, Kim Y, Kryukov GV, Ghandi M, Aguirre AJ, et al. ARID1B is a specific vulnerability in ARID1A-mutant cancers. Nat Med. 2014;20:251–254. doi: 10.1038/nm.3480. [DOI] [PMC free article] [PubMed] [Google Scholar]
- Januario T, Ye X, Bainer R, Alicke B, Smith T, Haley B, Modrusan Z, Gould S, Yauch RL. PRC2-mediated repression of SMARCA2 predicts EZH2 inhibitor activity in SWI/SNF mutant tumors. Proc Natl Acad Sci USA. 2017;114:12249–12254. doi: 10.1073/pnas.1703966114. [DOI] [PMC free article] [PubMed] [Google Scholar]
- Jones S, Wang TL, Shih IeM, Mao TL, Nakayama K, Roden R, Glas R, Slamon D, Diaz LA, Jr, Vogelstein B, et al. Frequent mutations of chromatin remodeling gene ARID1A in ovarian clear cell carcinoma. Science. 2010;330:228–231. doi: 10.1126/science.1196333. [DOI] [PMC free article] [PubMed] [Google Scholar]
- Kadoch C, Hargreaves DC, Hodges C, Elias L, Ho L, Ranish J, Crabtree GR. Proteomic and bioinformatic analysis of mammalian SWI/SNF complexes identifies extensive roles in human malignancy. Nat Genet. 2013;45:592–601. doi: 10.1038/ng.2628. [DOI] [PMC free article] [PubMed] [Google Scholar]
- Kim KH, Kim W, Howard TP, Vazquez F, Tsherniak A, Wu JN, Wang W, Haswell JR, Walensky LD, Hahn WC, et al. SWI/SNF-mutant cancers depend on catalytic and non-catalytic activity of EZH2. Nat Med. 2015;21:1491–1496. doi: 10.1038/nm.3968. [DOI] [PMC free article] [PubMed] [Google Scholar]
- Kipps E, Tan DS, Kaye SB. Meeting the challenge of ascites in ovarian cancer: new avenues for therapy and research. Nat Rev Cancer. 2013;13:273–282. doi: 10.1038/nrc3432. [DOI] [PMC free article] [PubMed] [Google Scholar]
- Kobayashi T, Nakazono K, Tokuda M, Mashima Y, Dynlacht BD, Itoh H. HDAC2 promotes loss of primary cilia in pancreatic ductal adenocarcinoma. EMBO Rep. 2017;18:334–343. doi: 10.15252/embr.201541922. [DOI] [PMC free article] [PubMed] [Google Scholar]
- Lawrence MS, Stojanov P, Mermel CH, Robinson JT, Garraway LA, Golub TR, Meyerson M, Gabriel SB, Lander ES, Getz G. Discovery and saturation analysis of cancer genes across 21 tumour types. Nature. 2014;505:495–501. doi: 10.1038/nature12912. [DOI] [PMC free article] [PubMed] [Google Scholar]
- Mackay HJ, Brady MF, Oza AM, Reuss A, Pujade-Lauraine E, Swart AM, Siddiqui N, Colombo N, Bookman MA, Pfisterer J, et al. Prognostic relevance of uncommon ovarian histology in women with stage III/IV epithelial ovarian cancer. Int J Gynecol Cancer. 2010;20:945–952. doi: 10.1111/IGC.0b013e3181dd0110. [DOI] [PubMed] [Google Scholar]
- Mann BS, Johnson JR, Cohen MH, Justice R, Pazdur R. FDA approval summary: vorinostat for treatment of advanced primary cutaneous T-cell lymphoma. Oncologist. 2007;12:1247–1252. doi: 10.1634/theoncologist.12-10-1247. [DOI] [PubMed] [Google Scholar]
- Murakami R, Matsumura N, Brown JB, Higasa K, Tsutsumi T, Kamada M, Abou-Taleb H, Hosoe Y, Kitamura S, Yamaguchi K, et al. Exome sequencing landscape analysis in ovarian clear cell carcinoma shed light on key chromosomal regions and mutation gene networks. Am J Pathol. 2017;187:2246–2258. doi: 10.1016/j.ajpath.2017.06.012. [DOI] [PubMed] [Google Scholar]
- Pavlik CM, Wong CY, Ononye S, Lopez DD, Engene N, McPhail KL, Gerwick WH, Balunas MJ. Santacruzamate A, a potent and selective histone deacetylase inhibitor from the Panamanian marine cyanobacterium cf Symploca sp. J Nat Prod. 2013;76:2026–2033. doi: 10.1021/np400198r. [DOI] [PMC free article] [PubMed] [Google Scholar]
- Saito T, Katabuchi H. Annual report of the Committee on Gynecologic Oncology, Japan Society of Obstetrics and Gynecology: patient annual report for 2013 and treatment annual report for 2008. J Obstet Gynaecol Res. 2016;42:1069–1079. doi: 10.1111/jog.13043. [DOI] [PubMed] [Google Scholar]
- Stany MP, Vathipadiekal V, Ozbun L, Stone RL, Mok SC, Xue H, Kagami T, Wang Y, McAlpine JN, Bowtell D, et al. Identification of novel therapeutic targets in microdissected clear cell ovarian cancers. PLoS ONE. 2011;6:e21121. doi: 10.1371/journal.pone.0021121. [DOI] [PMC free article] [PubMed] [Google Scholar]
- van der Vlag J, Otte AP. Transcriptional repression mediated by the human polycomb-group protein EED involves histone deacetylation. Nat Genet. 1999;23:474–478. doi: 10.1038/70602. [DOI] [PubMed] [Google Scholar]
- Weichert W, Denkert C, Noske A, Darb-Esfahani S, Dietel M, Kalloger SE, Huntsman DG, Köbel M. Expression of class I histone de-acetylases indicates poor prognosis in endometrioid subtypes of ovarian and endometrial carcinomas. Neoplasia. 2008;10:1021–1027. doi: 10.1593/neo.08474. [DOI] [PMC free article] [PubMed] [Google Scholar]
- West AC, Johnstone RW. New and emerging HDAC inhibitors for cancer treatment. J Clin Invest. 2014;124:30–39. doi: 10.1172/JCI69738. [DOI] [PMC free article] [PubMed] [Google Scholar]
- Wiegand KC, Shah SP, Al-Agha OM, Zhao Y, Tse K, Zeng T, Senz J, McConechy MK, Anglesio MS, Kalloger SE, et al. ARID1A mutations in endometriosis-associated ovarian carcinomas. N Engl J Med. 2010;363:1532–1543. doi: 10.1056/NEJMoa1008433. [DOI] [PMC free article] [PubMed] [Google Scholar]
- Wilson BG, Roberts CW. SWI/SNF nucleosome remodellers and cancer. Nat Rev Cancer. 2011;11:481–492. doi: 10.1038/nrc3068. [DOI] [PubMed] [Google Scholar]
- Ye S, Yang J, You Y, Cao D, Huang H, Wu M, Chen J, Lang J, Shen K. Clinicopathologic significance of HNF-1β, AIRD1A, and PIK3CA expression in ovarian clear cell carcinoma: a tissue microarray study of 130 cases. Medicine (Baltimore) 2016;95:e3003. doi: 10.1097/MD.0000000000003003. [DOI] [PMC free article] [PubMed] [Google Scholar]
- Zhu Z, He X, Johnson C, Stoops J, Eaker AE, Stoffer DS, Bell A, Zarnegar R, DeFrances MC. PI3K is negatively regulated by PIK3IP1, a novel p110 interacting protein. Biochem Biophys Res Commun. 2007;358:66–72. doi: 10.1016/j.bbrc.2007.04.096. [DOI] [PMC free article] [PubMed] [Google Scholar]
Associated Data
This section collects any data citations, data availability statements, or supplementary materials included in this article.