Abstract
The EPA’s Water Security Test Bed (WSTB) facility is a full-scale representation of a drinking water distribution system. In collaboration with the Idaho National Laboratory (INL), EPA designed the WSTB facility to support full-scale evaluations of water infrastructure decontamination, real-time sensors, mobile water treatment systems, and decontamination of premise plumbing and appliances. The EPA research focused on decontamination of 1) Bacillus globigii (BG) spores, a non-pathogenic surrogate for Bacillus anthracis and 2) Bakken crude oil. Flushing and chlorination effectively removed most BG spores from the bulk water but BG spores still remained on the pipe wall coupons. Soluble oil components of Bakken crude oil were removed by flushing although oil components persisted in the dishwasher and refrigerator water dispenser. Using this full-scale distribution system allows EPA to 1) test contaminants without any human health or ecological risk and 2) inform water systems on effective methodologies responding to possible contamination incidents.
INTRODUCTION
Decontamination of drinking water systems following an intentional contamination incident or after a natural disaster (e.g., pipe breaks, earthquakes, etc.) is critical for the effective return of the system to operation and for restoring public confidence in the safety of the water distribution system for drinking and other applications. The drinking water distribution system is vulnerable to contamination, and presents operational challenges in maintaining good water quality to protect human health and ensure water availability for fire protection and other uses. Natural and man-made incidents further exacerbate the declining integrity of our aging water infrastructure. Regardless of whether the water quality delivered to the tap is compromised from an industrial accident, terrorist attack, loss of power from an extreme storm event, or massive main break, the ability to reliably and cost effectively decontaminate miles of distribution system pipes and premise plumbing will be a critical capability that utilities will need to ensure public safety and confidence in their drinking water following an incident.
Much of the early decontamination research conducted by EPA’s Homeland Security Research Program (HSRP)and others was performed at the bench or pilot scale level(USEPA 2014). While these research efforts address a relatively uncharted research area with chemical, biological and radiological(CBR) threat agents, the applicability of these results to a full-scale system in unknown. Discussions with stakeholders in the drinking water community and recommendations from the Water Sector Critical Infrastructure Partnership Advisory Council (CIPAC) emphasized the importance of testing water infrastructure decontamination methods and technologies at a large scale, representative of a real drinking water distribution system.
Given that the evaluation of CBR agents or their surrogates in an actual distribution system is not feasible, EPA’s HSRP embarked on building a test facility to address this need. In 2014, in collaboration with the Department of Energy’s (DOE) Idaho National Laboratory (INL), EPA began construction of the Water Security Test Bed (WSTB) facility on the grounds of the INL. The core of the WSTB facility is 450 ft of previously used 40-year-old 8-inchcement -mortar lined iron drinking water pipe that was out of commission, excavated from the INL grounds, and reassembled above ground. The pipe is pressurized to 40 psi and has locally chlorinated groundwater flowing through it. CBR surrogate contaminants can be injected into the system, water quality sampled, and pipe samples harvested to examine contaminant persistence in the water and on the pipe material. The effectiveness of decontamination methods, especially those that were successful at the bench and pilot scales, can then be examined. An adjacent building contains a constructed full scale household plumbing system with appliances that are connected to the main WSTB facility pipe through a 1-inch copper service connection. These capabilities make the WSTB facility a unique resource for examining water infrastructure decontamination in the distribution system and in home plumbing and appliances at full scale, which brings real-world complexity, and results, to the water industry.
In addition to describing the capabilities of the WSTB facility, this manuscript summarizes some of the drinking water infrastructure decontamination research that has been conducted at the WSTB site to date. Research thus far has examined the persistence and decontamination of Bacillus globigii(BG) spores, a non-pathogenic surrogate for Bacillus anthracis(BA )in the main pipe, appliances, and premise plumbing. Decontamination research with BG spores in the WSTB facility built upon bench and pilot scale research conducted in EPA facilities, and provides a unique look at how smaller scale research compares to similar experiments conducted on a large scale (Szabo 2017). Finally, due to the increase in crude oil transportation across the United States via rail car and pipeline, spills into waterways reaching drinking water intakes are more likely. Therefore, the persistence of Bakken crude oil components in the WSTB facility was examined, as was the effectiveness of flushing to remove any persistent oil fractions in the pipeline, appliances, and premise plumbing. Using this simulated distribution system allows EPA to 1) test contaminants without any human health or ecological risk and 2) inform water systems on effective methodologies tested in a real-world set-up, which will improve utility response to contamination incidents.
WSTB FACILITY DESIGN, CAPABILITIES AND EXPERIMENTAL PROCEDURES
Main WSTB facility pipe
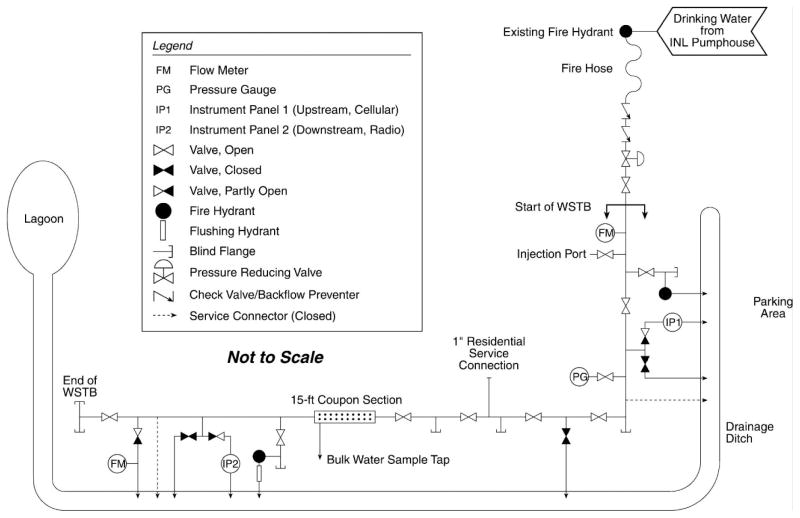
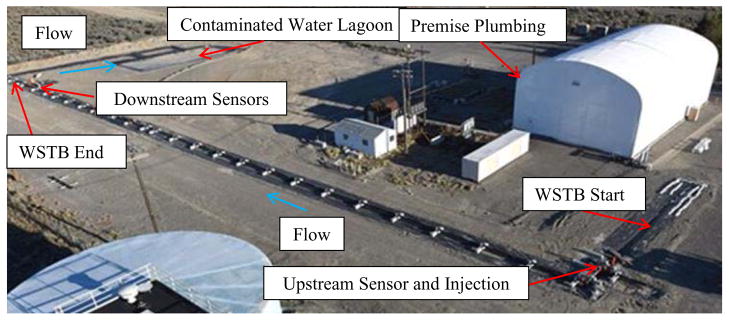
Figure 1 depicts the main features of the WSTB facility and Figure 2 shows the aerial view. The primary element of the WSTB facility is the 8 -inch diameter cement lined ductile iron drinking water pipe that is situated in an L-shape with a straight 450 ft run between 2 fire hydrants. This orientation is meant to represent a small portion of a drinking water distribution system. The pipe is pressurized to 40 psi and is supplied with local INL chlorinated ground water. Water demand can be simulated by allowing flow through service connections located along the length of the pipe. The total volume of the WSTB facility pipes is approximately 1,150 gallons. A lined ditch is situated below the pipe to contain any leaks or spills and to protect the groundwater aquifer. Effluent from the WSTB facility pipe discharges to a 28,000-gallon lagoon through a 1-inch valve or a flow meter, which can be used to control flow. The lagoon allows for on-site testing of mobile treatment technologies that can be quickly deployed and will be described in a future publication. Additional details about the construction and experimental approach are described in USEPA 2015 and USEPA 2016.
Figure 1.
Schematic overview of Water Security Test Bed
Figure 2.
Aerial view of the Water Security Test Bed
Fire hydrants are located near each end of the WSTB facility pipe. The down stream fire hydrant has an automatic flusher installed. Next to each fire hydrant is a weatherproof panel containing on-line free chlorine and UV-based total organic carbon monitors. The WSTB facility also contains a 15 -foot pipe section that includes removable coupons to allow sampling of the pipe interior. These coupons are screwed into the side of the pipe so that the coupon surface is flush with the inside of the pipe. The coupons were cut from the same cement-mortar lined iron INL pipes that compose the WSTB facility set up.
WSTB facility household plumbing system
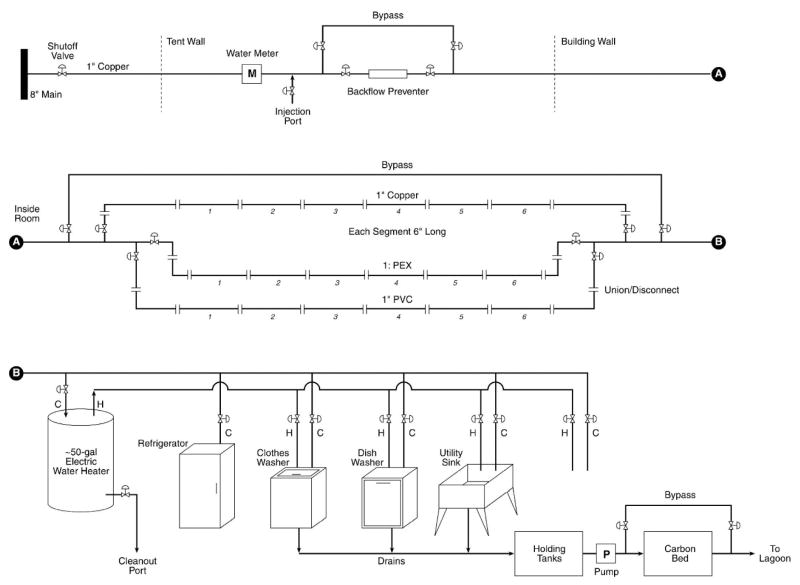
In Figure 2, the white tented building contains household plumbing and appliances that are connected to the main WSTB facility pipe via approximately 200 ft of 1 -inch copper service line. Figure 3 shows a schematic of the premise plumbing system. Water flows under pressure through the 1-inch copper service connection from the WSTB facility pipe to the premise plumbing and appliances. A standard home flow meter and backflow preventer are installed in-line with the service connection. Water flows through three branches in the pipe. E ach pipe has six, 6-inch long (1-inch diameter) sections made of either PEX, PVC or copper. These removable sections allow for the determination of contaminant persistence on the pipe wall in common home plumbing materials, and the effectiveness of decontamination methods such as flushing with clean water, or disinfection. After the home plumbing sections, water flows into a common household 50-gallon water heater, refrigerator with a water/ice dispenser, washing machine, dishwasher, and utility sink. A previous study conducted by the HSRP showed that BG spores persisted on these typical household appliances presenting a decontamination challenge(USEPA 2011). All effluent flows into a 200 gallon holding tank where the water can be either disinfected or treated with activated carbon, if necessary, prior to flowing into the lagoon.
Figure 3.
Schematic of the WSTB facility indoor plumbing and appliances
BG spore decontamination experimental methodology: Main WSTB Facility Pipe
BG spores used in these experiments were generated by culturing in generic sporulation media and incubated by gentle shaking at 35°C for 7 days. They were then stored at 4°C until use. Approximately 40 L BG spores were injected into the WSTB facility pipe for one hour to achieve a concentration of 10 6 CFU/ml in the pipe. Coupons and bulk water were sampled before, during and after injection for the presence of BG spores. Decontamination was undertaken by injecting 25 L of chlorine dioxide into the WSTB facility pipe over one hour so that 100 mg/L was achieve in the pipe, stopping flow and holding the disinfectant stagnant for 24 hours. Chlorine dioxide was selected based on successful results from previous pilot -scale studies (Szabo 2017). After the 24-hour contact period, the chlorine dioxide was flushed out of the pipe at 15 GPM and coupons and bulk water sampled further. Additional details on the experimental procedures can be found in USEPA 2015.
BG spore decontamination experimental methodology: Household plumbing system
BG spores were injected into the plumbing system for one hour to achieve 106 CFU/ml in the plumbing pipes for the duration of the injection. After the injection slug of BG spores had cleared the plumbing system, a mixture of amended bleach was prepared at the ratios proposed by the US National Response Team for disinfection of water (1-partbleach: 11.75-partwater: 1-partvinegar) (USNRT 2012 ). The amended bleach was injected so that it filled all the premise plumbing and appliances, and was allowed to contact the plumbing surfaces for one hour, as recommended in the NRT procedure. This was followed by flushing all the amended bleach out of the plumbing system with the locally chlorinated ground water. Additional flushing was then undertaken based on the findings of the Water Research Foundation report 4572, which provides guidance for flushing premise plumbing and service lines (WRF 2016). After sitting stagnant overnight with regular tap water, this flushing procedure was repeated again in the plumbing system. Furthermore, three sections of the PVC, PEX and copper were sampled via swabbing after spore injection, after disinfection and then after the first round of flushing, respectively. Additional details on sampling and analyses can be found in USEPA 2015.
Bakken crude oil decontamination experimental methodology: Main WSTB Facility Pipe
Bakken Oil used in this experiment was from North Dakota and was provided by Marathon Petroleum. Bakken oil was added to Snake River water from Idaho Falls, ID and allowed it to mix in a carboy by stirring overnight (2.5 L of crude oil mixed with 22.5 L of water). Twenty liters of the water layer below the oil (also known as the subnatent)was then injected into the WSTB facility pipe over the course of one hour. This setup was meant to imitate an oil slick on top of river water, with soluble components dissolving into the water and entering a submerged water intake. Benzene, toluene, ethylbenzene and xylenes (BTEX) as well as gasoline range organics (GRO), oil range organics (ORO), and diesel range organics (DRO) were analyzed to determine the presence of oil components in the WSTB facility pipe. After the subnatent oil slug passed through the WSTB facility pipe, flushing at 15 GPM was undertaken for 75 minutes, after which a surfactant (Surfonic® DOS-75PG from Huntsman Chemical) was introduced at a concentration of 0.1% (v/v). A similar surfactant was successfully used in a previous decontamination study to remove adhered diesel fuel from drinking water pipe (USEPA 2008). Additional details on the experimental methods and procedures can be found in USEPA 2016.
Bakken crude oil decontamination experimental methodology: Household plumbing system
The subnatent water layer with dissolved oil components was added to the home plumbing system using the same method described for the main WSTB facility pipe. After the oil slug had cleared the plumbing, flushing was undertaken following the home plumbing flushing guidance provided by Water Research Foundation (WRF 2016). Briefly, the hot water was turned off and the cold water tap on the utility sink was fully opened. Simultaneously, the cold water dispenser on the refrigerator was opened to its maximum setting. Both the utility tap and the refrigerator water dispenser were flushed for 20 minutes. After the cold water system was flushed, the hot water heater tank was drained via the cleanout port at the bottom of the tank, refilled with tap water, and the hot water tap in the utility sink was fully opened for 75 minutes. This 75 minute flush continuously pulled water from the hot water tank, which was immediately replenished. At the conclusion of the hot water flushing, the dishwasher and washing machine were operated for one cycle with only water (no detergent). After sitting stagnant with tap water overnight, this flushing procedure was repeated again the next day.
EXPERIMENTAL DECONTAMINATION RESULTS
BG spore decontamination in the 8-inch distribution system pipe
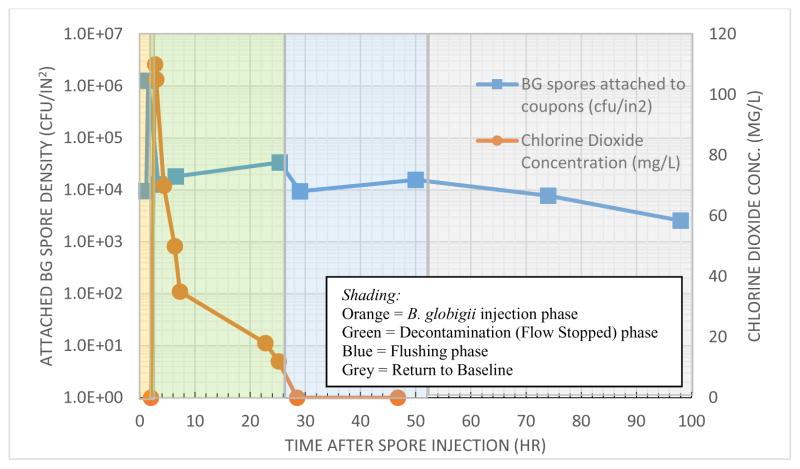
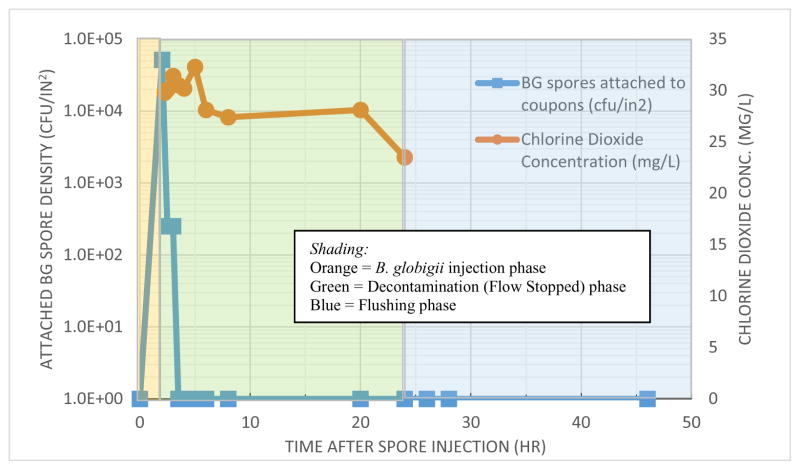
Figures 4 and 5 show data on contamination and decontamination of the full scale WSTB facility drinking water infrastructure (Figure 4), and the pilot-scale drinking water research conducted at EPA’s Test and Evaluation (T&E) facility located in Cincinnati, Ohio (Figure 5), respectively. Both experiments include injection of BG spores into an experimental pipe system, allowing them to come into contact with cement-mortar drinking water infrastructure surfaces, followed by chlorine dioxide decontamination. However, the pilot scale system is made of PVC with iron and cement-mortar coupons inserted that allow for biofilm growth. A detailed description of the pilot scale system at the T&E facility can be found in Szabo et al. 2012.
Figure 4.
BG spore persistence on the coupons in the WSTB facility and chlorine dioxide concentration during decontamination
Figure 5.
BG spore persistence on coupons in the pilot-scale system and chlorine dioxide concentration during decontamination
After injection of BG spores into the WSTB facility pipe bulk water phase, spores were detected at approximately 106 CFU/ml. Within an hour after the slug of BG spores exited the pipe, chlorine dioxide was injected at approximately 100 mg/L to decontaminate the pipe. Between the slug of spores exiting the pipe and the introduction of chlorine dioxide, the number of spores in the bulk water phase dropped to between 1 and 5 CFU/100 ml due to the injection slug being flushed out. Figure 4 shows spores were detected on the cement-mortar pipe coupon surfaces immediately after injection at a concentration of 106 CFU/in2. Introduction of chlorine dioxide decreased the spore levels on the coupons to approximately 104 CFU/in2, or a 2 log 10 reduction. In the presence of chlorine dioxide, the number of spores remained relatively stable on the coupons in the subsequent phases of the experiment, namely flushing. Figure 4 also shows that the chlorine dioxide levels dropped precipitously after introduction into the WSTB facility pipe. The degradation of the chlorine dioxide may be due to demand from the pipe walls or elevated temperature in the WSTB facility (with daily ranges from 17 to 27° C due to being above ground). Although the chlorine dioxide concentration was high in the bulk phase, demand from the pipe wall may have hindered the penetration of the chlorine dioxide into the cement-mortar matrix and thus limited contact with the attached spores, or the spores were attached to the cement-mortar matrix in a place where the chlorine dioxide could not penetrate.
As noted in USEPA 2015, a key benefit of conducting research at the WSTB facility is generating data at a realistic field scale pipe system. Decontamination data collected using smaller bench or pilot scale systems can then be compared to the data generated from the WSTB facility. Comparing small and large scale data helps our understanding of the scale -up of bench or pilot scale results for application in the field. If data generated from a full scale system like the WSTB facility is different from data obtained in small scale studies, it may be because the WSTB facility simulates real world drinking water system characteristics with many more site specific challenges that are difficult to capture in smaller scale experiments.
Key differences were observed between the WSTB facility and the pilot study. In the pilot scale system, 2 hours of contact time with 25 mg/L chlorine dioxide yielded a greater than 4 log10 reduction of the adhered spores, and spore counts dropped below the analytical method detection limit. In the WSTB facility, the initial chlorine dioxide injection initially achieved 100 mg/L, and for the first six hours of decontamination, this concentration remained above 50 mg/L. However, even with the higher levels of chlorine dioxide, only a 2 log10 reduction of BG spores was observed in the WSTB facility.
Chlorine dioxide concentrations also showed significant differences between the two experiments. Chlorine dioxide concentration ranging from 25 to 30 mg/L was easily maintained for 24 hours in the pilot -scale test at the T&E facility(note that chlorine dioxide decreased to zero in the flushing phase). This was likely due to the fact that the pilot scale system is made mostly of PVC, which has lower disinfectant demand. The initial chlorine dioxide concentration of 110 mg/L in the WSTB facility experiment dropped to 70 mg/L at 4 hours after decontamination began, 35 mg/L at 8 hours and 12 mg/L after 24 hours of contact time. These data suggest that the real cement-mortar pipe in the field had significant disinfectant demand (possibly also affected by the outdoor temperature gradient), and raises possibility that the chlorine dioxide was not effectively penetrating into the areas of the pipe where the spores were located.
Comparing these sets of pilot and full scale data suggests that decontaminating drinking water infrastructure in the real world is more challenging than in smaller experimental set-ups. In the future, decontamination research efforts may focus on physical removal of spore contaminated pipe material in the WSTB facility. Nevertheless, these data show the importance of performing research at facilities like the WSTB facility, where experimental conditions more relevant to the real world can be effectively recreated.
BG spore decontamination in the household plumbing system
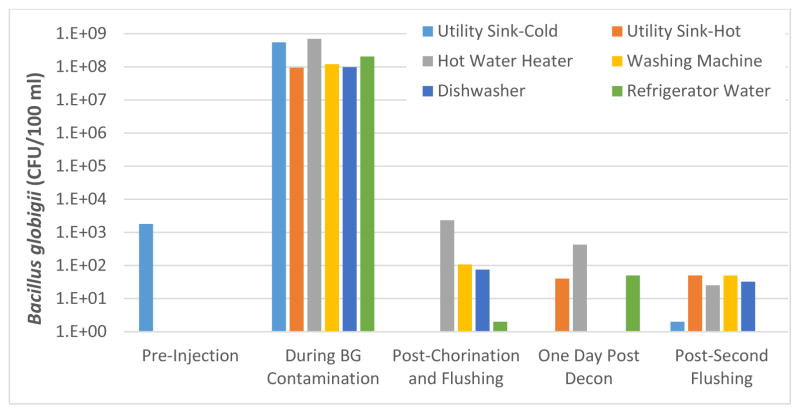
Figure 6 shows the presence of BG spores in the plumbing water phase and appliances during contamination and after decontamination. It is notable that some spores were found in the pre-injection cold water tap baseline sample. The authors attribute this to possible residual external contamination that could have come from the main pipeline experiments the previous year. Even though the main pipe was drained and left dry during the winter months, low levels of BG spores were found on the pipe wall coupons when put back into service in the Spring During pre-injection sampling, the same cold water that supplied the cold water tap also flowed to the appliances and hot water heater, and no spores were detected in these locations. During contamination, BG spore levels were approximately 106 CFU/ml (or 108 CFU/100 ml)in the plumbing pipes and appliances.
Figure 6.
BG spore concentrations in the plumbing system and appliances before, during and after decontamination
After contamination, amended bleach was added to the plumbing system. This included the hot water heater, which was drained and refilled with the amended bleach solution. Free chlorine levels were measured at 2,300 mg/L in the pipes and 660 mg/L in the hot water heater. After the bleach was flushed from the plumbing system, the system was flushed according to the protocol in WRF 2016. Following decontamination, a decrease of 5.5 log10 from the peak levels was observed in the hot water heater. Spores were undetectable in the hot and cold water taps after decontamination, and the washing machine and dishwasher contained roughly 6 log 10 fewer spores than during contamination.
After letting the plumbing system and appliances sit stagnant overnight with tap water, spores were still detected in the hot water heater, and at the hot water tap the next morning. It is possible that spores in the hot water heater were flushed through to the hot water tap. After a second round of flushing (no additional chlorination), spores were detected in all of the taps and appliances, but at levels 6 to 7 log10 less than during contamination. While flushing and chlorination were effective at removing the vast majority of spores in the plumbing and appliances, spores can persist in some places where flushing is not effective or if the disinfectants cannot reach these locations. This testing also supports previous research showing that hot water heaters are difficult to completely flush and decontaminate (USEPA 2011).
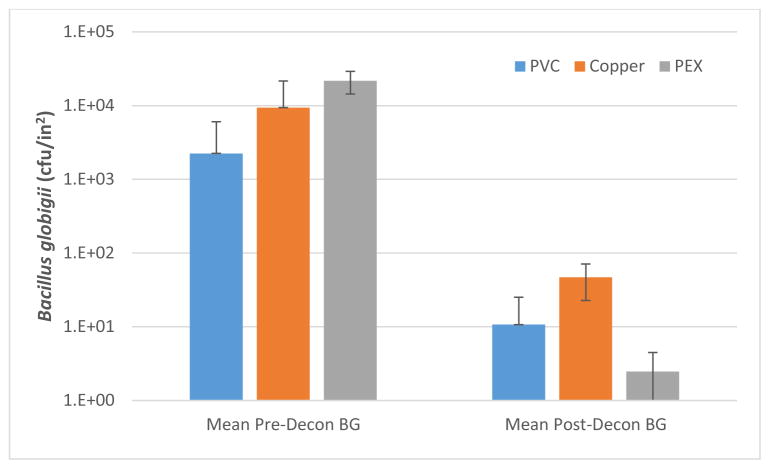
Spore persistence is also noticeable in Figure 7, which shows the number of spores adhered to PVC, PEX and copper pipe material before and after decontamination with chlorination (amended bleach) and flushing. Decontamination of PVC and copper resulted in log10 reductions of 2.3±0.6 and 2.3±0.5, while the number of spores adhered to PEX was decreased by 3.9±0.2. Additional flushing cycles beyond the two used in this study may be required to reduce the number of spores to ‘undetectable’ within a home plumbing system. However due to numerous confined or dead-end areas within the home system, a complete decontamination via this method maybe difficult to achieve. Depending on the contaminant and the decontamination technique employed, a utility will have to tailor their post-event sampling to insure a safe return to service and public safety.
Figure 7.
BG spores on plumbing pipe coupons before and after treatment with amended bleach and flushing
Bakken oil decontamination in the 8-inch distribution system pipe
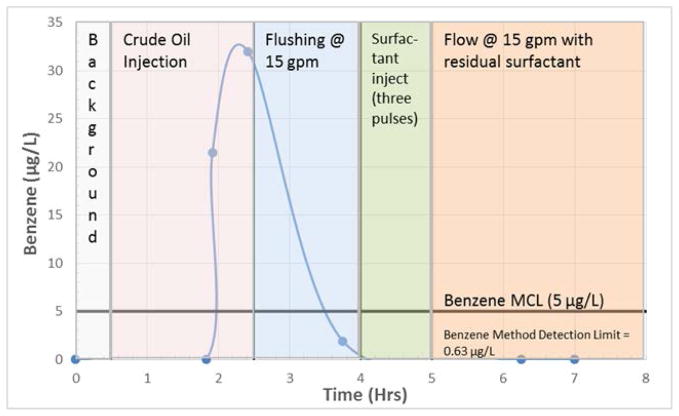
Upon injection of the Bakken oil subnatent water, a spike in total petroleum hydrocarbons, gasoline -range organics and benzene was observed in the WSTB facility pipe water column. Figure 8 shows the increase in benzene during injection of the Bakken oil subnatent water layer. The figure shows the phase before injection of the Bakken oil subnatent water (Background), during injection of the Bakken oil subnatnet water( Crude Oil Subnatent Injection), during clean water flushing (flushing @ 15 GPM), surfactant addition (Surfactant Injection ) and then during clean water flow (Flow@15 GPM with residual surfactant). No benzene was detected in the background water sample before injection of the Bakken oil subnatent water. A spike in benzene was detected when the oil components were travelling down the pipe. It should be noted that all personnel on site could detect an oil or gasoline smell in the water samples removed from the WSTB facility pipe when the oil slug was present. However, after the oil slug exited the pipe and clean water was flushed through, the benzene level dropped precipitously. It appears that simple water flushing cleared the pipe of benzene. No benzene was detected during the addition of surfactant or thereafter (USEPA 2016).
Figure 8.
Benzene concentration in the WSTB facility pipe bulk water during contamination and decontamination
Bakken oil components were not detected on the pipe coupon surfaces before, during or immediately after the oil subnatent injection. However, ethylbenzene and toluene were detected on some of the pipe coupon surfaces at two and three days after injection of the Bakken oil subnatent water. Bakken oil components may have been trapped some place in the WSTB facility (e.g. a dead end pipe) and broke loose or detached in the days after the contamination event and adhered to the coupons. However, no corresponding increase in toluene or ethylbenzene was detected in the bulk water samples, nor was any petroleum odor noticed in the samples. This sampling event demonstrates that monitoring may be needed in the days after a decontamination takes place to ensure that no contamination reemerges.
Figure 8 also shows the portion of the decontamination experiment where a surfactant (Surfonic® DOS-75PG) was added to the pipe to enhance the effectiveness of flushing. At the time the surfactant was added, it was unknown if the Bakken oil components were adhering to the pipe material or persisting in the water phase. Since flushing was effective at removing the oil components from the pipe, surfactant addition would not have been necessary. Another important finding was that although the surfactant was flushed out of the pipe, water samples taken up to two weeks after removal of the surfactant were noticeable “foamy”, indicating that surfactant was still present to some degree. This observation highlights the fact that it may be difficult to remove a decontamination agent from a water distribution system after it has been added, especially with characteristics similar to the above surfactant.
Bakken oil decontamination in the home plumbing system
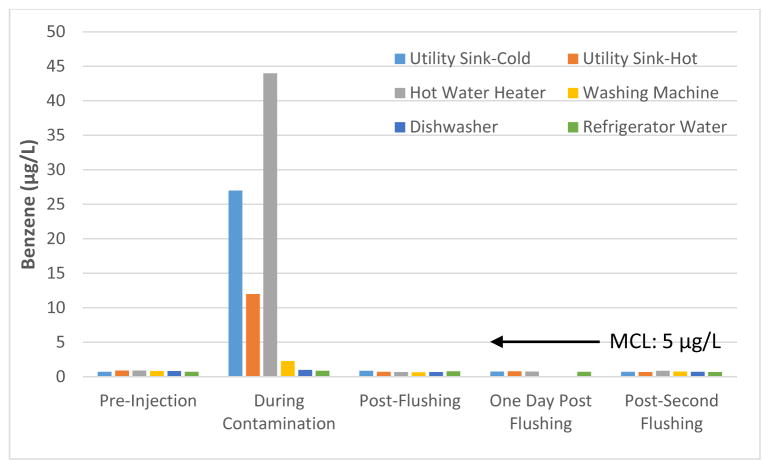
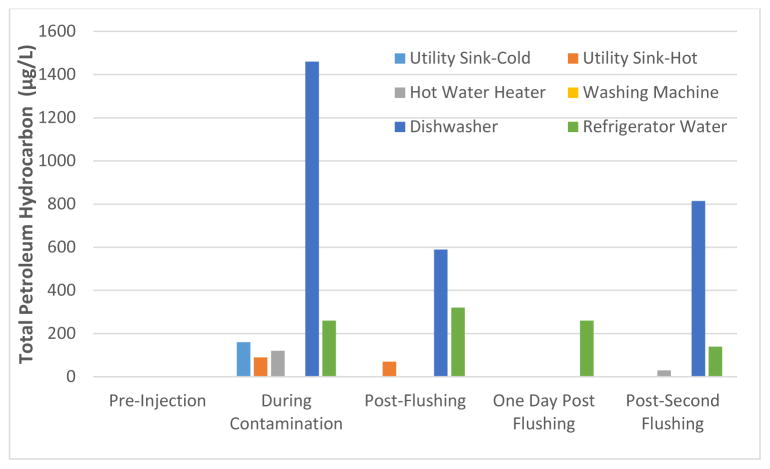
Bakken oil subnatent water was injected through the 1-inch copper service connection and into the home plumbing and appliance system at the same ratio used for 8-inch WSTB facility pipe. Figures 9 and 10 show the concentration of benzene and Total Petroleum Hydrocarbons (TPH) in the appliances and at the water taps respectively. TPH is the summation of ORO, DRO and GRO. Figure 9 shows a clear spike in benzene at the cold and hot water taps, at the utility sink, as well as in the hot water heater during contamination, and a slight increase in the washing machine. After following the cold and hot water flushing procedure described in WRF 2016 (the post -flushing portion of Figure 9) the levels of benzene detected at the hot and cold tap as well as in the appliances returned to the pre-injection baseline. After this initial flushing, the plumbing system and appliances were allowed to sit stagnant overnight with tap water present. Sampling was conducted the next morning (one-day post flushing on Figure 9) and again after the previously described hot and cold flushing procedure was conducted again (post-second flushing on Figure 9). In both cases, benzene levels at the taps and in the appliances were equivalent to the pre-injection baseline. Flushing was effective in removing benzene from the premise plumbing and the appliances, but this may not be true if a different petroleum product was used as the contaminant.
Figure 9.
Benzene concentration in the home plumbing system before, during and after flushing
Figure 10.
TPH in the home plumbing system before, during and after flushing
As shown in Figure 10, TPH was detected in the highest quantities during contamination in the dishwasher and refrigerator water, and at lower levels at the cold and hot taps as well as in the hot water heater. During contamination, it was expected that TPH levels in the appliances should be similar to the levels in the water from the taps or hot water heater. After the first round of flushing, allowing the plumbing and appliances to sit stagnant overnight, and a second round of flushing, elevated levels of TPH were still detected in the refrigerator water and dishwasher. It is possible that the materials of construction in the dishwasher and refrigerator water dispenser adsorbed or concentrated some of the organic constituents from the Bakken oil, which later released in the water samples. It should also be noted that when the oil subnatent contamination was in the plumbing, a noticeable petroleum smell was in the water, but none was present after either round of flushing, or after allowing the plumbing system and appliances to sit stagnant overnight. However, in the future, long term monitoring of the water may be needed to determine whether any adsorbed oil components slowly release over time.
Toluene (MCL=1000 μg/L), ethylbenzene (MCL=700 μg/L) and total xylenes (MCL=1000 μg/L) were also analyzed during all phases of the experiment. Throughout each phase of the experiment, toluene, ethylbenzene and total xylenes ranged from 1.0–1.6 μg/L, 0.2–0.5 μg/L and 2.0–3.0 μg/L, respectively. It is unclear if decontamination had an effect on any of these constituents, but all were detected far below their MCLs. Overall, flushing the plumbing and appliances according to the guidelines presented in WRF 2016 was effective at removing benzene from the plumbing system. This is also true for TPH in the hot and cold taps and the water heater. However, some of the soluble Bakken oil constituents may adsorb to the materials present in the refrigerator water dispenser and dishwasher. More aggressive flushing or decontamination using a detergent or surfactant may be needed for these appliances in future experiments.
CONCLUSIONS
The WSTB facility is a unique testing facility that can be used for a wide variety of water research focused on both the distribution system, household plumbing, and appliances. The facility also allows for testing methods of managing contaminated water, which will be described in a future publication. The results presented here focus on decontamination of the drinking water infrastructure. The primary conclusions from the decontamination research conducted at the WSTB facility thus far are as follows:
Decontamination with chlorine dioxide, selected as the most effective disinfectant during pilot testing, reduced the number of BG spores (a surrogate for BA)adhered to the WSTB facility cement-mortar lined iron pipe by 2-log10. Chlorine dioxide injected into the WSTB facility pipe degraded quickly, which was likely due to pipe demand and temperature effects. Data from the WSTB facility showed that decontamination with chlorine dioxide in the field was more challenging than in pilot scale experiments, which were conducted in a PVC system with less disinfectant demand.
Chlorination and flushing reduced BG spores in the bulk water phase of the WSTB facility plumbing system by 6 to 7 log10, but low levels (30–50 CFU/100 ml) of spores did persist in the plumbing system after decontamination for the duration of the testing. Pipe coupon decontamination results showed 2.3 log10 reduction of spores on copper and PVC, and 3.9 log10 removal on PEX. Decontamination via flushing and chlorination was generally effective, but the data show that small numbers of spores persisted in the plumbing and appliances over the course of the two-day experiment.
If soluble Bakken oil constituents from an oil spill in a water body enter a drinking water distribution system, the data presented here suggest that flushing is an effective method to remove them. In particular, benzene in the WSTB facility spiked above the MCL after contamination, but flushing reduced benzene levels below the MCL to undetectable levels.
Similar results were observed for Bakken crude oil components and benzene in home plumbing pipes and appliances. Benzene spiked above the MCL after contamination but fell below the MCL to pre-injection baseline levels after flushing. TPH was detected in the dishwasher and refrigerator water dispenser after flushing, which indicates that the soluble oil components may persist or concentrate on some of the materials in these appliances.
These results at the full-scale cement-mortar pipe with biofilm were different than previous tests done in the pilot-scale PVC system (also with biofilm), demonstrating the challenges associated with scale-up, pipe demand, temperature conditions and dead ends in the distribution system, as well as the materials used in various premise plumbing pipes and appliances.
Cleaning the cement mortar pipe from spore contamination will require high levels of chlorine dioxide and flushing as they seem to adhere to the infrastructure. Physical removal remains to be tested. The Bakken oil supernatant was effectively removed with flushing but testing needs to be done for a few days after clean up to ensure that no leaching is occurring.
The WSTB facility is a good test facility to target testing the scale up of successful treatment and decontamination technologies.
Acknowledgments
The U.S. Environmental Protection Agency (EPA), through its Office of Research and Development’s National Homeland Security Research Center (NHSRC), funded and managed this project under Interagency Agreement (IA) DW-89-92381801 with the Department of Energy and contract EP-C-14-012 with CB&I Federal Services LLC.
Footnotes
DISCLAIMER
This report has been peer and administratively reviewed and has been approved for publication. It does not necessarily reflect the views of the EPA. Mention of trade names or commercial products does not constitute endorsement or recommendation for use of a specific product.
Contributor Information
Jeffrey Szabo, Environmental Engineer, U.S. Environmental Protection Agency, 26 W. Martin Luther King Dr., (MS NG-16), Cincinnati, OH 45268, 513-487-2823.
John Hall, Physical Scientist, U.S. Environmental Protection Agency, 26 W. Martin Luther King Dr. (MS NG-16), Cincinnati, OH 45268, 513-487-2814.
Steve Reese, Engineer, Idaho National Laboratory, 2525 Fremont Ave, Idaho Falls, ID 83402, 208-526-0070.
Jim Goodrich, Senior Research Advisor, U.S. Environmental Protection Agency, 26 W. Martin Luther King Dr. (MS NG-16), Cincinnati, OH 45268, 513-569-7605.
Sri Panguluri, Senior Project Engineer, CB&I Federal Services, LLC, 1600 Gest St., Cincinnati, OH 45204, 513-487-2811.
Greg Meiners, Senior Project Engineer, CB&I Federal Services, LLC, 1600 Gest St., Cincinnati, OH 45204, 513-487-2821.
Hiba Ernst, Division Director, U.S. Environmental Protection Agency, 26 W. Martin Luther King Dr. (MS NG-16), Cincinnati, OH 45268, 513-569-7930.
References
- Szabo JG, Muhammad N, Heckman L, Rice EW, Hall JS. Germinant-enhanced decontamination of Bacillus spores adhered to iron and cement-mortar drinking water infrastructure. Applied and Environment Microbiology. 2012;78(7):2449. doi: 10.1128/AEM.07242-11. [DOI] [PMC free article] [PubMed] [Google Scholar]
- Szabo JG, Meiners G, Heckman L, Rice EW, Hall J. Decontamination of Bacillus spores adhered to iron and cement-mortar drinking water infrastructure in a model system using disinfectants. Journal of Environmental Management. 2017;187:1. doi: 10.1016/j.jenvman.2016.11.024. [DOI] [PMC free article] [PubMed] [Google Scholar]
- USEPA (United States Environmental Protection Agency) Pilot-Scale Tests and Systems Evaluation for the Containment, Treatment, and Decontamination of Selected Materials from T&E Building Pipe Loop Equipment. Washington: 2008. EPA/600/R-08/016. [Google Scholar]
- USEPA (United States Environmental Protection Agency) Development and Testing of Methods to Decontaminate a Building’s Plumbing System Impacted by Water Contamination Event: Decontamination of Bacillus Spores. Washington: 2011. EPA/600/R-09/089. [Google Scholar]
- USEPA (United States Environmental Protection Agency) Decontamination of Drinking Water Infrastructure: A Literature Review and Summary. Washington: 2014. EPA/600/R-13/156. [Google Scholar]
- USEPA (United States Environmental Protection Agency) Water Security Test Bed Experiments at the Idaho National Laboratory. Washington: 2015. EPA/600/R-15/146. [Google Scholar]
- USEPA (United States Environmental Protection Agency) Testing large volume water treatment and crude oil decontamination using the Water Security Test Bed at the Idaho National Laboratory. Washington: 2016. EPA/600/R-16/126. [Google Scholar]
- USNRT (United States National Response Team) [accessed 01/18/2016];NRT Quick Reference Guide, Bacillus anthracis PPE Wash Water Decontamination. 2012 https://www.nrt.org/sites/2/files/120531_BAC_Wastewater_QRG_FINAL.pdf.
- WRF (Water Research Foundation) Flushing Guidance for Premise Plumbing and Service Lines to Avoid or Address a Drinking Water Advisory. Denver: 2016. WRF 4572. [Google Scholar]


