

Abstract
Objectives
In response to an expressed need for more focused measurement of preconception health, we identify a condensed set of preconception health indicators for state and national surveillance.
Methods
We used a systematic process to evaluate, prioritize, and select 10 preconception health indicators that maternal and child health programs can use for surveillance. For each indicator, we assessed prevalence, whether it was included in professional recommendations, Healthy People 2020 objectives, Centers for Disease Control and Prevention winnable battles, measurement simplicity, data completeness, and stakeholders’ input.
Results
A total of 50 preconception health indicators were evaluated and prioritized. The condensed set includes indicators that rely on data from the Pregnancy Risk Assessment Monitoring System (n=4) and the Behavioral Risk Factor Surveillance System (n=6). The content encompasses heavy alcohol consumption, depression, diabetes, folic acid intake, hypertension, normal weight, recommended physical activity, current smoking, unwanted pregnancy, and use of contraception.
Conclusions
Having a condensed set of preconception health indicators can facilitate surveillance of reproductive-aged women’s health status that supports monitoring, comparisons, and benchmarking at the state and national levels.
Introduction
Promoting preconception health (PCH) is a Healthy People 2020 strategy for preventing adverse pregnancy outcomes and improving women’s health overall.1 PCH is a broad term that encompasses the overall health of non-pregnant women during their reproductive years (defined here as 18–44 years of age), and that when optimized, improves both birth outcomes should pregnancy occur, and the woman’s health regardless of whether she has children. Several federal agencies, professional health organizations, and national experts have acknowledged the importance of PCH and preconception care (PCC) for women of reproductive age.2–5 Over a decade ago, the Centers for Disease Control and Prevention (CDC)/Agency for Toxic Substances and Disease Registry Preconception Care Work Group and the Select Panel on Preconception Care developed and published recommendations for improving PCH and PCC in the United States, and recognized the need to “maximize public health surveillance and related research mechanisms to monitor preconception health.”6
After the recommendations were published, the Select Panel on Preconception Care expanded and became known as the National Preconception Health and Health Care (PCHHC) Initiative. As a public-private collaboration of organizations committed to maternal and child health (MCH), the PCHHC Initiative advances PCH and PCC at the national, state, and local levels.7 Members represent local, state, and federal maternal and child health organizations, and other groups interested in MCH. The PCHHC Initiative’s Public Health workgroup convened a voluntary committee of policy/program leaders and epidemiologists working in seven states (California, Delaware, Florida, Michigan, North Carolina, Texas, and Utah) to identify core state PCH and PCC indicators. After reviewing five population-based data systems, the workgroup proposed 45 core PCH and PCC indicators for state surveillance.8
Approximately one year after that publication was released,8 the Association of Maternal and Child Health Programs (AMCHP) sent an assessment to 50 U.S. states and 9 territories to determine the capacity for using the core PCH indicators at that time. Most MCH program directors had calculated at least some of the core PCH indicators, about one in five had not calculated any, and none reported calculating all 45 indicators (unpublished). The indicators have thus been used as a “menu of options.”
In 2014, the Select Panel on Preconception Health and Health Care reconvened to review progress in advancing preconception health. The group identified a lack of focused clinical and population health measures as hindering change. They recommended a multi-faceted approach to measurement including the identification of 5–10 population level indicators and 5–10 clinical indicators from the 45 core PCH and PCC indicators.9
Given the expressed need for more focused measurement of PCH and PCC, the authors of this paper led the time-intensive effort to evaluate and prioritize the PCH indicators. In the absence of funding for a multi-state collaborative, it was not practical for states to lead this process. Through partnerships with national leaders from the PCHHC Initiative and AMCHP, multiple opportunities for broad stakeholder input were integrated at various junctures of the process.
PCH indicators were evaluated separately from PCC indicators because PCH and PCC relate to different core functions of public health and are likely to be used for different purposes by different actors. Moreover, a simultaneous effort by the PCHHC initiative’s clinical work group was underway to develop a set of measures that can be used to evaluate the preconception wellness of women in clinical health settings.10 The PCH indicators are intended to be used to monitor health status and to identify sub-populations of women with higher risks (i.e., assessment), whereas PCC indicators and the preconception wellness indicators10 can be used to monitor access and delivery of clinical care (i.e., assurance).11 This report focuses only on the evaluation of PCH indicators and proposes a condensed set of PCH indicators that MCH programs can use to monitor the health status and document the needs of reproductive-aged women in the United States to inform public health needs assessments, program planning, and advocacy efforts.
Methods
In an effort to evaluate and prioritize PCH indicators, we used a systematic process that identified and reviewed indicators for the evaluation, defined exclusion and evaluation criteria, and obtained and considered stakeholder input and feedback throughout the process. The methodology is illustrated in Figure 1. IRB approval was not needed for this project because this project was not human subjects’ research.
Figure 1.
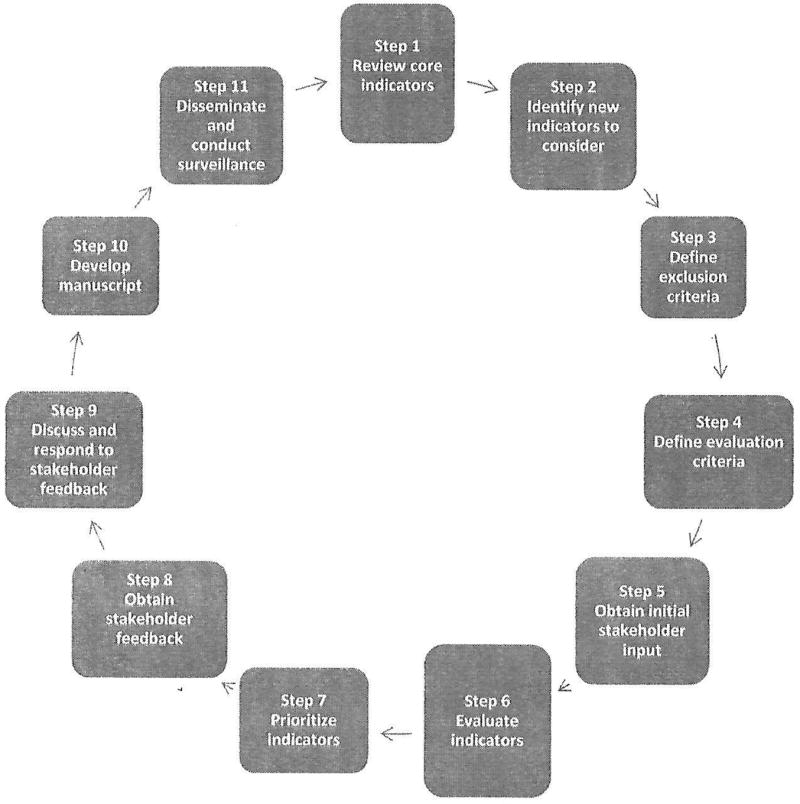
Process Used to Develop the Recommended Preconception Health Indicators
Included Indicators (Steps 1–2)
To identify the universe of PCH indicators to evaluate, we began with the original list of 45 indicators that states had identified themselves.8 We also searched the literature for other sets of indicators. We reviewed the 124 chronic disease surveillance indicators,12 the 59 maternal and child health life course indicators,13 and the nine preconception wellness surrogate measures of quality preconception care previously proposed by the Clinical Workgroup of the National Preconception Health and Health Care Initiative.10 Additionally, we reviewed the most current core surveys available at the time for state level data: the 2016 Pregnancy Risk Assessment Monitoring System (PRAMS) and the 2015 Behavioral Risk Factor Surveillance System (BRFSS). Once all potential indicators from these sources were identified, we separated indicators that had multiple categories into multiple binary indicators to simplify measurement and ensure that each indicator being evaluated was just a single concept. The ‘deconstructed’ indicators were evaluated individually (e.g., separate measures for underweight, normal weight, overweight, and obesity were evaluated).
Exclusion Criteria (Step 3)
Exclusion criteria and examples of each are summarized in Table 1. We excluded indicators that were purely health care related (e.g., having a postpartum check-up). We excluded non-core indicators that were measured by PRAMS 2016 or BRFSS 2014–15 surveys since those indicators will not be available for comparisons across all states in the future. Indicators that were demographic or non-specific to PCH were also excluded (e.g., education and insurance). Because we separated composite indicators (i.e., indicators that had multiple components) into their component parts, we excluded the original composite indicators because they were redundant.
Table 1.
Exclusion Criteria for Evaluation of Preconception Health Indicators
| Exclusion Criteria | Examples |
|---|---|
| Health care: Indicators that evaluate PCC (will be considered separately) |
|
| Non-Core: Indicators measured by PRAMS or BRFSS that are currently not included on the core surveys |
|
| Demographic: Indicators that are demographic or non-specific to PCH |
|
| Redundancy: Indicators for which their deconstructed parts are being evaluated as separate indicators |
|
Note. PCC: Preconception care; PCH: Preconception health; PRAMS: Pregnancy Risk Assessment Monitoring System; BRFSS: Behavioral Risk Factor Surveillance System; GED: General equivalency diploma; BMI: Body mass index
Evaluation Criteria (Step 4)
The evaluation criteria closely mapped to the criteria that were originally used to identify and propose the 45 core PCH and PCC indicators.8 We operationalized scoring and weighted the following criteria related to each indicator: (1) prevalence; (2) inclusion in professional recommendations;1 (3) inclusion in Healthy People 2020 objectives or CDC winnable battles;14 and (4) simplicity of calculating prevalence through online data systems (Table 2). Information about data completeness was originally considered, but it was unavailable for some of the indicators, so this criterion was assessed but not included in the scores.
Table 2.
Evaluation Criteria and Scoring for Preconception Health Indicator
| Criterion (weight) | Description for criterion | Scoring |
|---|---|---|
| Prevalence (30%) | As a measure of public health importance, higher prevalence of risk factors or adverse conditions received higher scores than lower prevalence risk factors/conditions. Prevalence estimates of indicators connoting healthy behaviors were transformed to reflect a negative outcome for comparability, e.g. % of women with postpartum checkup is 91.2%, and the negative would thus be 8.8%. Scoring cut-points were established based on frequency distributions, which ranged 2.2–87.2%. |
|
| Addressed in professional recommendations (15%) | Inclusion in professional recommendations (e.g., Community Guide, USPSTF, ACOG, AAFP, ASRM, IOM) for clinical care related to the PCH indicators was considered to be evidence of the public health importance. Indicators with such evidence received higher scores. |
|
| Addressed in the Healthy People (HP) 2020 objectives and/or CDC winnable battles (15%) | Inclusion in HP 2020 objectives or CDC winnable battles was considered to be evidence of policy or program importance and indicators with such evidence received higher scores. |
|
| Simplicity – Calculating the indicator (40%) | This criterion refers to the level of difficulty in calculating estimates of the indicator. Indicators with ease of calculation received higher scores. |
|
| Data Completeness (0%) | This criterion assesses an aspect of data quality. Missing data for source survey questions was reviewed and indicators based on survey questions with less missing data received higher scores. |
|
Note. USPSTF: U.S. Preventive Services Task Force; ACOG: American College of Obstetrics & Gynecology; AAFP: American Academy of Family Physicians; ASRM: American Society for Reproductive Medicine; IOM: Institute of Medicine; HP: Healthy People; CDC: Centers for Disease Control and Prevention
Initial Stakeholder Input (Step 5)
Stakeholder input about use of indicators was obtained through a collaboration with AMCHP, which is one of the leading conveners of local and state professionals with interest in PCH. AMCHP has a long history of working with states to identify challenges in using the core PCH indicators and by leveraging that history and prior work with state MCH leaders, we were able to efficiently re-assess current state level MCH leaders’ capacity for using the core PCH indicators. AMCHP obtained stakeholder input from MCH directors and MCH epidemiologists working in states by developing and implementing an online assessment and two interactive webinars that were facilitated using discussion prompts, chat box to capture quotes and encourage dialogue, and polling features.
The purpose of the online assessment was to gather preliminary information regarding usefulness of the 45 core PCH and PCC indicators that could be summarized and used as a springboard for discussion in the webinars. The online assessment offered six pre-defined categories of use: grant applications, needs assessments, program evaluations, program planning, resource allocation, and advocacy. Respondents were instructed to select all categories that describe how their MCH program uses each indicator. In addition, they were asked which indicators for pregnancy intention and body mass index were most useful to their states.
The objectives for the webinars were to describe the proposed process for evaluating and prioritizing the PCH indicators, share results from the online assessments, and engage state-level stakeholders in the process. Discussion prompts during the interactive webinars focused on high priority topics related to PCH and PCC, a deeper examination of how states use the indicators in their work, usefulness of specific indicators relative to others, and types of support needed to facilitate stakeholders’ use of the indicators. The webinar moderator facilitated discussions for each topic in an open and spontaneous format to elicit maximum input without placing any limits on the number of contributions that any individual participant could make.
Evaluation and Prioritization Process (Steps 6–7)
A primary and secondary evaluator (from the authors of this paper) independently evaluated each indicator. The primary evaluator created a summary document that described the indicator (i.e., demographic group, data source, and definitions of numerators and denominators), addressed the evaluation criteria, and specified comparable data availability through California’s Maternal and Infant Health Assessment survey since California does not have PRAMS data. The primary evaluator entered numeric scores that corresponded to each quantifiable evaluation criterion into an Excel file. The secondary evaluator reviewed the summary document and quantitative scores. The two evaluators reconciled any differences in assessments through discussion. The summaries were shared with CDC subject matter experts (SME) for review and input.
During deliberations, we discussed the weighted scores, SME feedback, and initial stakeholder feedback for each indicator (Table 3). Thus, decisions were not made solely on rank of quantitative scores. Stakeholder feedback was considered relative to the other evaluation criteria and SME input. Each indicator was assigned to one of three tiers. Tier 1 represented the highest priority indicators recommended for inclusion in the condensed set of PCH indicators; Tier 2 included the next highest priority indicators, and Tier 3 represented indicators that we agreed should not be considered for the condensed set. We aimed for consistency in our approach to deliberations and also considered the face validity of the (collective) condensed set. Decisions were made by consensus.
Table 3.
Evaluated Preconception Health Care Indicators by Content Are
| Domain: Sub-domain | Indicator | Data Source* |
Original Indicator or New |
|
|---|---|---|---|---|
| 1 | General Health Status: Self-rated Health | Percentage of women who report good, very good or excellent health | BRFSS | Original |
| 2 | Reproductive Health: Previous Preterm Birth | Percentage of women having a live birth who had a previous preterm birth | NVSS | Original |
| 3 | Reproductive Health: Inter-pregnancy Interval | Percentage of women having a live birth who had less than 18 months between their previous live birth and the start of the most recent pregnancy | NVSS | Original |
| 4 | Reproductive Health: Pregnancy Intention | Percentage of women having a live birth who reported that just before their most recent pregnancy, they did not want to be pregnant sooner or then (unintended) | PRAMS | New |
| 5 | Reproductive Health: Pregnancy Intention | Percentage of women having a live birth who reported that just before their most recent pregnancy, they wanted to be pregnant sooner | PRAMS | New |
| 6 | Reproductive Health: Pregnancy Intention | Percentage of women having a live birth who reported that just before their most recent pregnancy, they wanted to be pregnant then | PRAMS | New |
| 7 | Reproductive Health: Pregnancy Intention | Percentage of women having a live birth who reported that just before their most recent pregnancy, they wanted to be pregnant later (mistimed) | PRAMS | New |
| 8 | Reproductive Health: Pregnancy Intention | Percentage of women having a live birth who reported that just before their most recent pregnancy, they didn’t want to be pregnant then or at anytime in the future (unwanted) † | PRAMS | New |
| 9 | Reproductive Health: Pregnancy Intention | Percentage of women having a live birth who reported that just before their most recent pregnancy, they were unsure if they wanted to be pregnant | PRAMS | New |
| 10 | Reproductive Health: Contraception | Percentage of women having a live birth who reported that they or their husband or partner were currently doing something to keep from getting pregnant | PRAMS | Original |
| 11 | Reproductive Health: Contraception | Percentage of women having a live birth who reported that they or their husband or partner were currently using a more effective contraceptive method to keep from getting pregnant (i.e., sterilization, implant, IUD, hormonal method [injectable, pill, patch, ring]) † | PRAMS | New |
| 12 | Tobacco, alcohol, and substance use: Smoking | Percentage of women who currently smoke every day or some days † | BRFSS | Original |
| 13 | Tobacco, alcohol, and substance use: Smoking | Percentage of women having a live birth who smoked cigarettes during the three months prior to pregnancy | PRAMS | Original |
| 14 | Tobacco, alcohol, and substance use: Smoking | Percentage of women having a live birth who used E-cigarettes or other electronic nicotine products in the 2 years prior to pregnancy | PRAMS | New |
| 15 | Tobacco, alcohol, and substance use: Smoking | Percentage of women having a live birth who used E-cigarettes or other electronic nicotine products in the 3 months prior to pregnancy. | PRAMS | New |
| 16 | Tobacco, alcohol, and substance use: Smoking | Percentage of women having a live birth who used hookah in the 2 years prior to pregnancy | PRAMS | New |
| 17 | Tobacco, alcohol, and substance use: Alcohol Consumption | Percentage of women who had 8 or more drinks in an average week during the three months prior to pregnancy † | PRAMS | New |
| 18 | Tobacco, alcohol, and substance use: Alcohol Consumption | Percentage of women who had an average of more than 1 drink per day on the days they drank alcohol during the previous 30 days (heavy drinking) | BRFSS | Original |
| 19 | Tobacco, alcohol, and substance use: Alcohol Consumption | Percentage of women who had four or more drinks on at least one occasion in the past month (binge drinking) | BRFSS | Original |
| 20 | Tobacco, alcohol, and substance use: Alcohol Consumption | Percentage of women having a live birth who drank any amount of alcohol during the three months prior to pregnancy | PRAMS | Original |
| 21 | Nutrition and Physical Activity: Fruit & Vegetable Consumption | Percentage of women who consume fruits and vegetables at least five times per day | BRFSS | Original |
| 22 | Nutrition and Physical Activity: Obesity and Overweight | Percentage of women who are underweight (BMI<18.5 kg/m2) | BRFSS | New |
| 23 | Nutrition and Physical Activity: Obesity and Overweight | Percentage of women who are normal weight (BMI 18.5–24.9 kg/m2) † | BRFSS | New |
| 24 | Nutrition and Physical Activity: Obesity and Overweight | Percentage of women who are overweight (BMI ≥ 25 kg/m2 but < 30 kg/m2) | BRFSS | New |
| 25 | Nutrition and Physical Activity: Obesity and Overweight | Percentage of women who are obese (BMI ≥ 30 kg/m2) | BRFSS | New |
| 26 | Nutrition and Physical Activity: Obesity and Overweight | Percentage of women with a pre-pregnancy BMI<18.5 kg/m2(underweight) | PRAMS | New |
| 27 | Nutrition and Physical Activity: Obesity and Overweight | Percentage of women with a pre-pregnancy BMI 18.5–24.9 kg/m2(normal weight) | PRAMS | New |
| 28 | Nutrition and Physical Activity: Obesity and Overweight | Percentage of women with a pre-pregnancy BMI ≥ 25 kg/m2 but < 30 kg/m2(overweight) | PRAMS | New |
| 29 | Nutrition and Physical Activity: Obesity and Overweight | Percentage of women with a pre-pregnancy BMI ≥ 30 kg/m2(obese) | PRAMS | New |
| 30 | Nutrition and Physical Activity: Folic Acid Supplementation | Percentage of women having a live birth who took a multivitamin, prenatal vitamin, or a folic acid supplement every day of the month prior to pregnancy † | PRAMS | Original |
| 31 | Nutrition and Physical Activity: Exercise/Physical Activity | Percentage of women who participate in enough moderate and/or vigorous physical activity in a usual week to meet the recommended levels of physical activity † | BRFSS | Original |
| 32 | Mental Health: General Mental Distress | Percentage of women who report that their mental health was not good for at least 14 out of the past 30 days | BRFSS | Original |
| 33 | Mental Health: Depression | Percentage of women ever told by health care professional that they have a depressive disorder † | BRFSS | New |
| 34 | Mental Health: Postpartum Depression | Percentage of women having a live birth who experienced depressive symptoms after pregnancy | PRAMS | Original |
| 35 | Emotional and Social Support: Domestic Abuse | Percentage of women having a live birth who were physically abused by their partner during the 12 months prior to pregnancy | PRAMS | Original |
| 36 | Chronic Conditions: Diabetes | Percentage of women who have ever been told by a health care provider that they had diabetes including gestational diabetes | BRFSS | Original |
| 37 | Chronic Conditions: Diabetes | Percentage of women ever told by a health care professional that they had diabetes (excluding only during pregnancy and borderline/pre-diabetes) † | BRFSS | New |
| 38 | Chronic Conditions: Diabetes | Percentage of women ever told by a health care professional that they had pre-diabetes or borderline diabetes | BRFSS | New |
| 39 | Chronic Conditions: Diabetes | Percentage of women having a live birth who before their most recent pregnancy had ever been told by a health care provider that they had Type I or Type II diabetes | PRAMS | Original |
| 40 | Chronic Conditions: Kidney disease | Percentage of women ever told by health care professional that they have kidney disease (not including kidney stones, bladder infection or incontinence) | BRFSS | New |
| 41 | Chronic Conditions: Heart Disease | Percentage of women ever told by health care professional that they have high cholesterol | BRFSS | New |
| 42 | Chronic Conditions: Heart Disease | Percentage of women ever told by health care professional that they have angina or coronary heart disease | BRFSS | New |
| 43 | Chronic Conditions: Hypertension | Percentage of women who have ever been told by a health care provider that they had hypertension including hypertension during pregnancy | BRFSS | Original |
| 44 | Chronic Conditions: Hypertension | Percentage of women ever told by a health care professional that they had hypertension (excluding only during pregnancy and borderline/pre-hypertension) † | BRFSS | New |
| 45 | Chronic Conditions: Hypertension | Percentage of women ever told by a health care professional that they had pre-hypertension or borderline hypertension | BRFSS | New |
| 46 | Chronic Conditions: Hypertension | Percentage of women having a live birth who reported that they had hypertension during the 3 months before their most recent pregnancy | PRAMS | Original |
| 47 | Chronic Conditions: Asthma | Percentage of women who currently have asthma | BRFSS | Original |
| 48 | Infections: Sexually Transmitted Infections | Rates of chlamydia (cases per 100,000 women aged 18–44 years) | NNDSS | New |
| 49 | Infections: Sexually Transmitted Infections | Rates of gonorrhea (cases per 100,000 women aged 18–44 years) | NNDSS | New |
| 50 | Infections: Sexually Transmitted Infections | Rates of syphilis (cases per 100,000 women aged 18–44 years) | NNDSS | New |
BRFSS: Behavioral Risk Factor Surveillance System; NVSS: National Vital Statistics System; PRAMS: Pregnancy Risk Assessment Monitoring System; IUD: intrauterine device; BMI: body mass index; NNDSS: National Notifiable Diseases Surveillance System.
Included in the condensed set of preconception health indicators
Stakeholder Feedback and Response (Steps 8–9)
After the Tier 1 list was identified, stakeholder feedback was solicited a second time. State MCH epidemiologists were invited to an in-person meeting that was held as a breakout session at the 2016 CityMatCH Leadership and MCH Epidemiology Conference. CityMatCH is another leading convener of state maternal and child health leaders and the MCH Epidemiology Conference brings together the very professionals who are charged with monitoring PCH and MCH in their locales. AMCHP organized and facilitated the meeting, which was open to all participants at the conference. Additionally, AMCHP sent invitations in advance to previously identified stakeholders. At the meeting, AMCHP presented the Tier 1 list of indicators and described the evaluation process. AMCHP facilitated the interactive session, soliciting any concerns about specific indicators included in the list, and identifying critical content missing from the list. Additionally, AMCHP solicited feedback about the barriers to using the condensed set of PCH indicators. Following the conference, the PCHHC Initiative’s Surveillance and Research workgroup considered stakeholders’ feedback on specific indicators that were included or missing from the Tier 1 list, and in December 2016 the new proposed indicators were shared a final time for review and discussion at the national meeting of the PCHHC initiative.
Results
Included Indicators
We identified several new indicators from the most recently available core PRAMS and BRFSS surveys, and we also created numerous new indicators by deconstructing composite indicators.8 After applying the exclusion criteria, 50 indicators were available for evaluation and prioritization (Table 3).
Initial Stakeholder Input
An online assessment was completed by 14 states, and AMCHP shared summary data with us (Figure 2). The most frequently selected categories of use were grant applications, needs assessment, and program planning while the least frequently selected categories were program evaluation, resource allocation, and advocacy. Among the PCH indicators evaluated by stakeholders via the online assessment, BRFSS indicators for current smoking and asthma were respectively most and least likely to be currently used. Many stakeholders also reported using the indicators for previous preterm birth, short interpregnancy interval, mistimed pregnancy, and sexually transmitted infections (STI’s). Since STI’s were being evaluated separately rather than as a combined measure, the webinar polling feature was used to rank the three STI’s in order of importance. Chlamydia was the overwhelmingly favored indicator compared to syphilis and gonorrhea. Over thirty individuals from 14 states participated in the two webinars, where additional stakeholder input was obtained. According to webinar participants, the following PCH content areas were high priority topics in their states: tobacco use, postpartum use of effective contraception, including long acting reversible methods, obesity, pregnancy intention, mental health, management of chronic conditions, and interpregnancy interval.
Figure 2.
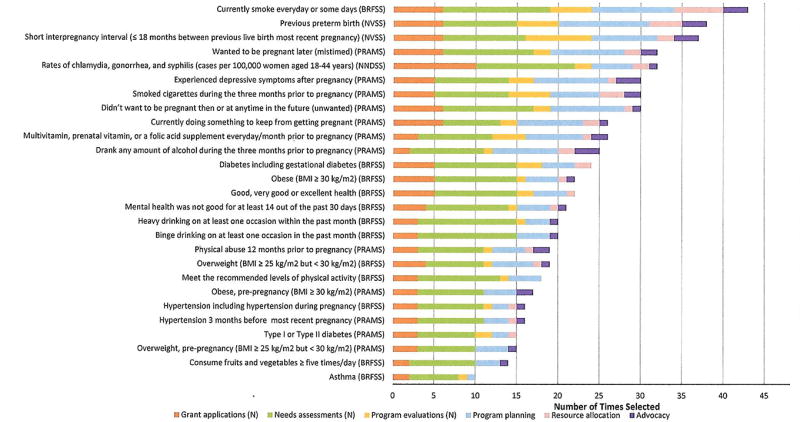
Stakeholder Input about the Usefulness of Originally Recommended Preconception Health Indicators that Were Evaluated
Note. BRFSS: Behavioral Risk Factor Surveillance System; NVSS: National Vital Statistics System; PRAMS: Pregnancy Risk Assessment Monitoring System; NNDSS=National Notifiable Diseases Surveillance System; BMI: body mass index.
Evaluation and Prioritization Process
Evaluation summaries of Tier 1 PCH indicators are available (Supplemental Table 1). We prioritized 20% (n=10) of the evaluated indicators to Tier 1, 34% to Tier 2 (n=17), and 46% to Tier 3 (n=23). Table 4 describes the Tier 1 PCH indicators, including data source, availability, and descriptions of each numerator and denominator. Of the ten Tier 1 indicators, six were original core PCH indicators8 and four were new. However, two of the four “new” indicators were derived from a composite original core PCH indicator but categorized differently. For example, instead of the original core indicator with multiple categories for underweight, normal weight, overweight or obese, the proposed indicator for normal weight is a single binary estimate of this concept. Four of the ten Tier 1 indicators use PRAMS data, and six use BRFSS data.
Table 4.
Description of Tier 1 Preconception Health Indicator
| Content Area | Indicator | Data source | Availability 1 |
Numerator | Denominator |
|---|---|---|---|---|---|
| Heavy Alcohol Consumption | Percentage of women who had 8 or more drinks in an average week during the three months prior to pregnancy | PRAMS | Core item annually | Respondents aged 18–44 years who reported that they had 8 or more alcoholic drinks in an average week during the 3 months before they got pregnant with their most recent live born infant | Respondents aged 18–44 years who reported the number of alcoholic drinks they had in an average week, including none, during the 3 months before they got pregnant with their most recent live born infant as well as those who reported that they did not have any alcoholic drinks in the past 2 years (excluding unknowns and refusals). |
| Depression | Percentage of women ever told by health care professional that they have a depressive disorder | BRFSS | Core item annually | Female respondents aged 18–44 years who reported they were ever told by a health care professional that they have a depressive disorder | Female respondents aged 18–44 years (excluding don’t know/not sure, refused, and missing data) |
| Diabetes | Percentage of women ever told by a health care professional that they had diabetes (excluding only during pregnancy and borderline/pre-diabetes) | BRFSS | Core item annually | Female respondents aged 18–44 years who reported ever being told by a health care provider that they have diabetes. Women who reported gestational diabetes, pre-diabetes, or borderline diabetes would not be included in the numerator | Female respondents aged 18–44 years (excluding don’t know/not sure, refused, and missing data) |
| Folic Acid Intake | Percentage of women having a live birth who took a multivitamin, prenatal vitamin, or a folic acid supplement every day of the month prior to pregnancy | PRAMS | Core item annually | Respondents aged 18–44 years who reported taking a multivitamin, prenatal vitamin, or folic acid vitamin every day of the month before they got pregnant with their most recent live born infant. | Respondents aged 18–44 years (excluding missing, unknowns, and refusals). |
| Hypertension | Percentage of women ever told by a health care professional that they had hypertension (excluding only during pregnancy and borderline/pre-hypertension) | BRFSS | Core item rotating odd years | Female respondents aged 18–44 years who reported ever being told by a doctor, nurse, or other health professional that they have high blood pressure, excluding women with high blood pressure but only during pregnancy and women with borderline high blood pressure or pre-hypertension. | Female respondents aged 18–44 (excluding don’t know/not sure, refused, and missing data) |
| Normal Weight | Percentage of women who are normal weight (BMI 18.5–24.9 kg/m2) | BRFSS | Core item annually | Normal: Women aged 18–44 years who have a body mass index (BMI) 18.5–24.9 kg/m2. BMI is calculated from self-reported weight and height on the BRFSS survey. | Women aged 18–44 years for whom BMI can be calculated using their self-reported weight and height. |
| Physical Activity | Percentage of women who participate in enough moderate and/or vigorous physical activity in a usual week to meet the recommended levels of physical activity | BRFSS | Core item rotating odd years | Women aged 18–44 years who reported doing enough moderate and/or vigorous physical activity in a usual week to meet the recommended levels of physical activity | Women aged 18–44 years who reported doing enough moderate and/or vigorous physical activity in a usual week to meet the recommended levels of physical activity and those who reported not doing enough moderate or vigorous physical activity in a usual week to meet the recommended levels of physical activity (excluding unknowns and refusals). |
| Current Smoking | Percentage of women who currently smoke every day or some days | BRFSS | Core item annually | Women aged 18–44 years who reported that they smoked ≥ 100 cigarettes in their lifetime and currently smoke every day or some days. | Women aged 18–44 years who reported that they currently smoke either every day, some days, or not at all, or reported that they had not smoked ≥ 100 cigarettes in their lifetime (excluding unknowns and refusals). |
| Unwanted Pregnancy | Percentage of women having a live birth who reported that just before their most recent pregnancy, they didn’t want to be pregnant then or at any time in the future (unwanted) | PRAMS | Core item annually | Respondents aged 18–44 years who reported that just before they got pregnant with their most recent live born infant, they didn’t want to be pregnant then or at any time in the future | Respondents aged 18–44 years who reported that just before they got pregnant with their most recent live born infant, they wanted to be pregnant sooner or then, later, didn’t want to be pregnant then or at any time in the future, or were unsure what they wanted (excluding those with missing data) |
| Postpartum Use of a Most or Moderately Effective Method of Contraception | Percentage of women having a live birth who reported that they or their husband or partner were currently using a more effective contraceptive method to keep from getting pregnant. (i.e., sterilization, implant, IUD, hormonal method [injectable, pill, patch, ring]) | PRAMS | Core item annually | Respondents aged 18–44 years who reported that they or their husbands or partners were currently using a more effective contraceptive method (sterilization, implant, intrauterine device, injectable, pill, patch, or ring) to keep from getting pregnant. | Respondents aged 18–44 years who reported that they or their husbands or partners were currently using or were not currently using a most or moderately effective contraceptive method (sterilization, implant, intrauterine device, injectable, pill, patch, or ring) to keep from getting pregnant. |
PRAMS availability based on Phase 8 (2016–2018); BRFSS availability based on 2015–2016
Note. PRAMS: Pregnancy Risk Assessment Monitoring System; BRFSS: Behavioral Risk Factor Surveillance System; IUD: intrauterine device.
Of the three leading core indicators that did not make Tier 1 (figure 2), the simplicity criteria (40%) lowered the weighted scores and rank of short interpregnancy interval and previous preterm birth. A lower score on the prevalence criteria also affected the ranking of short interpregnancy interval. Low scores on these same criteria counter-balanced positive stakeholder feedback on the chlamydia indicator. Additionally, the SME expressed concerns about the validity of the chlamydia estimates.2
Stakeholder Feedback and Response
Fifty-seven individuals participated in the face-to-face, stakeholders’ meeting. Overall, the stakeholders’ reactions to the undertaking were positive as illustrated by these quotes:
“We appreciated the long, original set as a capacity building tool for the state, but the long set was hard to move to action.”
“The whole set was overwhelming – the smaller set will generate more support.”
A proposed short list of indicators was shared at the stakeholder meeting. When asked if particular indicators on the short list were less important than others, stakeholders mentioned postpartum depression. Stakeholders proposed the BRFSS indicator on depression (i.e., ever told by a health care professional that they have a depressive disorder) as a preferred measure of PCH over the PRAMS postpartum depression because depression is prevalent among women of reproductive age and the BRFSS indicator assesses lifetime diagnoses of depressive disorders rather than postpartum depressive symptoms. Stakeholder input was solicited about the definitions of the indicators on hypertension and diabetes (i.e., inclusion/exclusion of having the conditions only during pregnancy). A clear preference was not expressed. Stakeholders’ concerns about missing content from the Tier 1 list of indicators was best illustrated by the following quote: “The short list gives a trade-off in efficiency for productivity.” Stakeholders expressed interest in having indicators for occupational risks, oral health, sexually-transmitted infections, substance use (e.g., marijuana and prescription drugs), adverse childhood experiences (ACEs), chronic or trauma-informed violence exposure, cumulative toxic stress, and use of e-cigarettes and hookahs.
Stakeholders identified delays in data availability, lack of simple tools for estimating and analyzing data, and the absence of some content areas from the Tier 1 list (e.g., social/emotional support and infection), as barriers to using the Tier 1 list of indicators. As an example, stakeholders asserted that not having certain content represented in the Tier 1 list (e.g., ACEs and interpersonal violence) poses challenges for working with advocates in those areas. Additionally, stakeholders commented that the growing number of indicator lists are creating confusion about when to use each list.
The stakeholders also offered ideas about tools that would facilitate use of the condensed set of indicators. There was interest in having data-to-action examples for the condensed set of indicators, like those described in CDC’s “From Data to Action” book.15 Stakeholders also expressed interest in seeing state rankings by indicator and suggested that having a data brief template would help to promote consistency in reporting across all locales.
The PCHHC Initiative’s Surveillance and Research workgroup re-convened to consider the stakeholder feedback. Deliberations concluded with re-affirmation of the Tier 1 list as proposed at the stakeholder meeting. However, in line with stakeholders’ suggestions, we replaced the postpartum depression indicator with the BRFSS depression indicator. For consistency with framing and rational used to select the depression indicator, we retained the BRFSS hypertension and diabetes indicators as originally framed (i.e., excluding only during pregnancy). The final Tier 1 list includes indicators for heavy alcohol consumption, depression, diabetes, folic acid intake, hypertension, normal weight, recommended physical activity, current smoking, unwanted pregnancy, and postpartum use of effective contraception (Table 3).
Discussion
We describe a systematic process used to evaluate, prioritize, and select ten priority PCH indicators that MCH programs can use for surveillance. These ten indicators represent a refinement of the original list of 45 indicators,8 and highlight prioritized measures for monitoring PCH status among women of reproductive age. While this set reflects only half of the domains described in the original core set of indicators, it fills an expressed need from the field, is based on stakeholder feedback, and has the potential to improve surveillance of PCH. We encourage epidemiologists and researchers to examine and monitor the Tier 1 PCH indicators stratified by demographic characteristics, measures of social determinants of health, and any other measures that inform understanding about groups that may be experiencing gaps in services or outcomes, such as health care coverage and utilization. By analyzing how sub-populations of women differ on these indicators, disparities can be identified and actions to improve health can be implemented, as recommended by the Reconvened Select Panel on Preconception Health and Health Care.9 The prioritization of these indicators reflects the process undertaken by the PCHHC Initiative’s Surveillance and Research workgroup. We hope that states will use these PCH indicators to monitor PCH in their jurisdictions, but that does not preclude them from also using other measurable indicators that represent important local priorities.
Many indicators did not make the condensed set, some of which states reported as useful. For example, three of the indicators that stakeholders rated as most frequently used were not included in Tier 1. The reason that this occurred is that stakeholder input was just one of the criteria that were considered. Weighted scores, SME feedback, and the face validity of the collective set of Tier 1 indicators were also factored into deliberations.
While a condensed set is easier to produce and interpret, it does not speak to all important priorities. It will also be important to monitor emerging behavioral and environmental risks for PCH, including those that did not make the final Tier 1 set. For example, use of e-cigarettes, marijuana, hookahs, opioids, and prescription drugs may become high priorities in the future, but currently, state-level population based data on these topics are not readily available in all jurisdictions. The recent epidemic of Zika virus infections demonstrates how quickly an emerging infection can become a threat to PCH and necessitate the need for surveillance. Accordingly, the Tier1 set of PCH indicators should periodically be revisited to ensure responsiveness to emergent issues and newly available data. For example, intimate partner and sexual violence are relevant to preconception health but at the time of this review, we did not have access to ongoing, annual surveillance data on these types of violence across all states. Future changes to the core PRAMS and BRFSS surveys may also necessitate revisiting this list.
The identification of a condensed set of population-based PCH indicators can have short-, mid-, and long-term consequences. Short term impacts could include increased awareness and use of the indicators. Specifically, state and federal public health decision makers, program planners, researchers, and other key stakeholders could use these indicators to evaluate current programs and to assess the need for program enhancements, new initiatives, and new policies. The condensed set enables state-to-state and state-to-nation comparisons, and supports public health needs assessments, program planning, and advocacy efforts. For example, it is possible to cross-walk the condensed set of PCH indicators with categorical program goals and goals of partners’ agencies to highlight opportunities for collaboration and synergy.
Mid-term impacts could include improved knowledge about the status of PCH and health program needs within specific locales. Improved use of PCH surveillance data also has the potential to inform policy and resource allocation and may stimulate new collaborations as states identify health and social needs that extend beyond the scope of their own network’s capacity for responding to such needs. In the long range, changes in programs, policies, and new collaborations have the potential to improve the availability of and women’s access to resources that facilitate behaviors that can improve pregnancy and health outcomes, and improve women’s quality of health long-term.
Limitations
This evaluation had several limitations. First, the evaluation criteria did not include modifiability, risk, and severity of impact. Although we did not directly evaluate these criteria, our indicators generally reflect existing evidence-based guidelines (e.g., U.S. Preventive Services Task Force or The Community Guide),16,17 which do consider these criteria in their recommendations. Additionally, the workgroup assessed consistency with HP 2020 Objectives18 and CDC winnable battles,14 both of which are based on scientific evidence of modifiability, risk, and impact. Second, the importance of the simplicity criteria is arguable since individual states should have access to their own data, and therefore would not need to use public query systems (which is how simplicity was scored). However, the online query systems enable states to compare prevalence estimates for their jurisdictions with those from other areas. Third, data quality did not meaningfully contribute to the prioritization process. We considered using sensitivity and specificity to assess data quality, but a literature search showed that few PRAMS and BRFSS questions had published validations. Also, assessing data completeness as a proxy of data quality ultimately was not useful in the prioritization process because information about data completeness was unavailable for several of the indicators. Moreover, for the 43 indicators with information about data completeness, missing data was uniformly <10%. Finally, while PRAMS provides a rich source of PCH data, there are several limitations; not all states and territories currently participate in PRAMS, and PRAMS data are only released to entities outside the state/site if a minimum threshold response rate is met (currently set at 60%).
Conclusion
The reproductive years offer a critical window for interventions that improve women’s current health, that reduce later development of chronic conditions, and that promote delivery of a healthy infant for those who become pregnant. Having a condensed set of PCH indicators can improve understanding of the health status and needs of reproductive-aged women. National PCHHC leaders believe that having a condensed set of PCH indicators may help to elevate the importance of PCH and prompt action at a more accelerated course. In accordance with stakeholders’ suggestions for promoting use of the indicators, next steps include initiating adaptations to online query systems to enable easy access to estimates of the condensed set of ten PCH indicators, publishing a surveillance summary of the Tier 1 PCH indicators, and exploring possibilities for PRAMS expansion to all interested states and territories. We hope that MCH directors and epidemiologists working in states will consider using the condensed set of indicators for surveillance, using the data to activate and engage partners, and sharing their data to action success stories.
Supplementary Material
Acknowledgments
Association of Maternal and Child Health Programs staff: Stacy Collins, Ki’Yonna Jones, Christina Ratleff; Centers for Disease Control and Prevention staff who supported stakeholder input efforts: Isabel Morgan and Hope Thompson; CDC subject matter experts and others consulted: Gloria Beckles, Heidi Blank, Molly Cogswell, Kathryn Curtis, Lucy England, Janet Fulton, David A. Goodman, Shin Kim, Jean Ko, Latetia Moore, Brian Morrow, Erika C. Odom, Christine Olson, Rodney J. Presley, Kirsten Rambo, Kimberly E. Smith, Van Tong, Elizabeth Torrone, and Machell Town; State/Territory MCH staff who participated in the online assessment, webinars, and stakeholder meeting; and the National Preconception Health and Health Care Initiative’s leadership team.
Footnotes
Clinical care related to the indicator was considered to be evidence of the public health importance of the indicator (e.g., the U.S. Preventive Services Task Force recommends all adults be screened for alcohol misuse – thus, the heavy alcohol consumption indicator was assessed to be included in professional recommendations).
Trends in reported cases of chlamydia are influenced by changes in incidence, diagnostic tests, screening rates, insurance and reporting practices.
Disclaimer: The findings and conclusions in this report are those of the authors and do not necessarily represent the official position of the Centers for Disease Control and Prevention
Author Disclosure Statement: No competing financial interests exist.
References
- 1.Healthy People 2020. Office of Disease Prevention and Health Promotion. [Accessed May 31, 2016]; at www.healthypeople.gov.
- 2.American College of Obstetricians and Gynecologists. ACOG Committee Opinion number 313, September 2005. The importance of preconception care in the continuum of women's health care. Obstet Gynecol. 2005;106:665–6. doi: 10.1097/00006250-200509000-00052. [DOI] [PubMed] [Google Scholar]
- 3.American Diabetes Association. Preconception care of women with diabetes. Diabetes care. 2004;27:S76–8. doi: 10.2337/diacare.27.2007.s76. [DOI] [PubMed] [Google Scholar]
- 4.Gavin L, Moskosky S, Carter M, et al. Providing quality family planning services: Recommendations of CDC and the U.S. Office of Population Affairs. MMWR Recomm Rep. 2014;63:1–54. [PubMed] [Google Scholar]
- 5.Jack BW, Atrash H, Coonrod DV, Moos MK, O'Donnell J, Johnson K. The clinical content of preconception care: an overview and preparation of this supplement. Am J Obstet Gynecol. 2008;199:S266–79. doi: 10.1016/j.ajog.2008.07.067. [DOI] [PubMed] [Google Scholar]
- 6.Johnson K, Posner SF, Biermann J, et al. Recommendations to improve preconception health and health care — United States: a report of the CDC/ATSDR preconception care work group and the select panel on preconception care. MMWR Recomm Rep. 2006;55 [PubMed] [Google Scholar]
- 7.Floyd RL, Johnson KA, Owens JR, Verbiest S, Moore CA, Boyle C. A national action plan for promoting preconception health and health care in the United States (2012–2014) Journal of Women's Health. 2013;22:797–802. doi: 10.1089/jwh.2013.4505. [DOI] [PMC free article] [PubMed] [Google Scholar]
- 8.Broussard DL, Sappenfield WB, Fussman C, Kroelinger CD, Grigorescu V. Core state preconception health indicators: a voluntary, multi-state selection process. Matern Child Health J. 2011;15:158–68. doi: 10.1007/s10995-010-0575-x. [DOI] [PubMed] [Google Scholar]
- 9.Summary of findings from the reconvened select panel on preconception health and health care. [Accessed June 1, 2016];2015 at http://beforeandbeyond.org/wp-content/uploads/2014/03/002192_Preconception-Health-Report-Booklet_5th.pdf.
- 10.Frayne DJ, Verbiest S, Chelmow D, et al. Health Care System Measures to Advance Preconception Wellness: Consensus Recommendations of the Clinical Workgroup of the National Preconception Health and Health Care Initiative. Obstet Gynecol. 2016;127:863–72. doi: 10.1097/AOG.0000000000001379. [DOI] [PubMed] [Google Scholar]
- 11.Committee for the Study of the Future of Public Health, Division of Health Care Services, Institute of Medicine. The Future of Public Health. Washington, DC: National Academy of Sciences; 1988. [Google Scholar]
- 12.Holt JB, Huston SL, Heidari K, et al. Indicators for chronic disease surveillance - United States, 2013. MMWR Recomm Rep. 2015;64:1–246. [PubMed] [Google Scholar]
- 13.Callahan T, Stampfel C, Cornell A, et al. From theory to measurement: recommended state MCH life course indicators. Matern Child Health J. 2015;19:2336–47. doi: 10.1007/s10995-015-1767-1. [DOI] [PMC free article] [PubMed] [Google Scholar]
- 14.Centers for Disease Control and Prevention. Contraceptive use among postpartum women - 12 states and New York City, 2004–2006. MMWR. 2009;58:821–6. [PubMed] [Google Scholar]
- 15.Wilcox LS, Marks JS Centers for Disease C, Prevention. From data to action : CDC's public health surveillance for women, infants, and children. Atlanta, Ga: U.S. Dept. of Health & Human Services, Public Health Service, Centers for Disease Control and Prevention; 1993. [Google Scholar]
- 16.Published Recommendations. [Accessed December, 2016]; at https://www.uspreventiveservicestaskforce.org/BrowseRec/Index/browse-recommendations.
- 17.The Guide to Community Preventive Services (The Community Guide) [Accessed December, 2016]; at https://www.thecommunityguide.org/myguide.
- 18.US Department of Health and Human Services. Healthy People 2020. doi: 10.3109/15360288.2015.1037530. [DOI] [PubMed] [Google Scholar]
Associated Data
This section collects any data citations, data availability statements, or supplementary materials included in this article.