Abstract
High temperature (HT) decreases seed-set percentage in sorghum [Sorghum bicolor (L.) Moench]. The relative sensitivity of pollen and particularly pistil and the mechanistic response that induces tolerance or susceptibility to HT is not well known and hence is the major objective of this research. The male sterile (ATx399) and fertile (RTx430) lines were exposed to 30/20 °C (optimum temperature; OT), 36/26 °C (HT1) and 39/29 °C (HT2) from the start of booting to seed-set in a controlled environment. Similarly, in the field, HT stress was imposed using heat tents. HT stress decreased pollen germination. Relatively high levels of reactive oxygen species, and decreased antioxidant enzyme activity and phospholipid unsaturation were observed in pollen compared to pistil under HT. The severe cell organelle damage was observed in pollen and pistil at 36/26 and 39/29 °C, respectively. The seed-set percentage was higher in HT stressed pistil pollinated with OT pollen. Direct and reciprocal crosses indicate that pollen was relatively more sensitive with larger decreases in seed-set percentage than pistil under HT stress. The negative impact was greater in pollen than pistil at relatively lower temperatures. Overall, pollen was relatively more sensitive than pistil to HT stress because it is more susceptible to oxidative damage than pistil.
Keywords: High temperature stress, phospholipids, pistil, pollen, reactive oxygen species, reciprocal crosses
INTRODUCTION
The semi-arid regions of the world are vulnerable to climate change and climate variability. Grain sorghum is one of the important food crops grown in the semi-arid regions and supports food and nutritional security. Under the current climate scenario, temperatures during crop growing season in these regions are often >35 °C (daytime maximum temperatures), which are higher than the known optimum for sorghum growth, development and grain formation (Prasad et al., 2006; Singh et al., 2014). Further, multiple climate models project that both mean temperature and occurrence of short episodes of extreme high temperatures (HT) during the crop growing season will increase in future climates (IPCC, 2014). These changes can negatively influence physiological processes affecting sorghum grain yield. For every 1 °C rise in mean temperature during the growing season, it is documented that the mean sorghum grain yield will decline by about 8 to 9 % (Chowdury and Wardlaw, 1978; Lobell and Field, 2007). Hence, incorporation of HT tolerance traits in grain sorghum can help minimize both current and future HT stress impacts on grain yield of sorghum (Singh et al., 2014).
Responses to HT stress varies with the timing, duration and severity of stress exposure (Harsant et al., 2013; Prasad and Djanaguiraman, 2014; Prasad et al., 2015; Prasad et al., 2017). Yield losses due to HT stress are primarily due to decreased seed-set percentage resulting in low grain number, and decreased grain-filling duration resulting in small grain size (Prasad et al., 2015; Prasad et al., 2017). The decreased seed-set percentage under HT stress can be a result of loss of viability of pollen and/or stigma, failed fertilization or embryo abortion. Several studies in grain sorghum have shown that pollen viability is decreased when HT stress is imposed during pre- (particularly during gametogenesis) and/or flowering stages. Previous findings have concluded that the most sensitive stages of sorghum reproductive development were 10 to 5 d before flowering and 5 d before to 5 d after flowering, with HT at these times, resulting in maximum reduction in seed-set percentage (Prasad et al., 2015; Prasad et al., 2017). In some cereal crops, –such as rice (Oryza sativa L; Endo et al., 2009) and maize (Zea mays L; Herrero and Johnson, 1980); and legumes such as chickpea (Cicer arietinum L; Devasirvatham et al., 2012; 2013; Kaushal et al., 2013) pollen is documented to be more sensitive to HT than pistil. In wheat (Triticum aestivum L; Saini et al., 1983), pearl millet (Pennisetum sp.; Gupta et al., 2015; Djanaguiraman et al., 2017), and cotton (Gossypium hirsutum L; Snider et al., 2011), pistils were found to be more sensitive to HT stress than pollen. Although decreased seed-set percentage involving many sorghum genotypes under HT stress has been documented (Djanaguiraman et al., 2014; Singh et al., 2015; Sunoj et al., 2017), information on pollen viability and pollen germination has been generated but with no information on the viability of pistil. Hence, the role of pistil and its sensitivity to HT stress exposure, as well as its degree of sensitivity compared to pollen has not been elucidated and supports the need for further investigation to fill this major knowledge gap.
The mechanisms associated with the decreased pollen viability under HT stress are relatively well understood when compared with pistil. The decreased pollen functions under HT is associated with disruption of meiosis during male gametogenesis (Endo et al., 2009), premature pollen development within the anther (Parish et al., 2012), disrupted timing of anther dehiscence (Polowick and Sawhney, 1988), abnormal exine ornamentation (Djanaguiraman et al., 2014), thick exine wall (Djanaguiraman et al., 2013a), degeneration of tapetum cells (Suzuki et al., 2001), decreased sucrose utilization due to impaired cell wall invertase activity (Jain et al., 2010), increased pollen oxidative damage (Djanaguiraman et al., 2014), and decreased levels of unsaturated phospholipids, including phosphatidic acid (Djanaguiraman et al., 2013b). In the female reproductive tissues, HT stress caused degenerated egg and synergids [tomato, Lycopersicon esculentum Mill. Iwahori, 1965], altered receptivity of the stigma [wheat, Saini and Aspinall, 1982], decreased female gametophyte expansion and division and differentiation of the egg and synergids [wheat, Saini et al., 1983], non-secretion of pollen tube attractants [wishbone flower Torenia fournieri Higashiyama et al., 1998], lesser number of pollen tubes reaching the ovary [rice, Jagadish et al., 2007], decrease in total soluble carbohydrate and ATP concentrations [cotton, Gossypium hirsutum L. Snider et al., 2011], imbalance in reactive oxygen species (ROS) content [cotton, Snider et al., 2011] and desiccated stigma, style and ovary [wheat, Prasad and Djanaguiraman, 2014].
However, relative sensitivity of male and female reproductive tissues under different HT stress treatments is not well understood either in sorghum or other cereals, except wheat. Furthermore, there is very limited information on HT stress impact on pistil morphology, anatomy, phospholipid composition and ROS production in most field crops. A better understanding of thermo-tolerance of pollen and pistil and detailed understanding of the mechanism(s) of tolerance or susceptibility under HT will help in development of HT stress tolerant sorghum genotypes. Hence, the objectives of this research were to (i) determine relative sensitivity of sorghum pollen and pistil to HT stress, and (ii) understand susceptibility mechanisms associated with pollen and pistil HT tolerance.
MATERIALS AND METHODS
This research was conducted in controlled environmental facilities in the Department of Agronomy at Kansas State University, Manhattan, KS, USA.
Growth chamber studies
Plant husbandry and growth conditions
Sorghum lines ATx399 (male sterile) and RTx430 (male fertile) were used in this research. Seeds were treated with fungicide (Captan, Hummert International, Earth City, MO, USA) as a precautionary measure against seed-borne diseases and sown at 4-cm depth in 15-L pots (pot diameter 27.5 and 26 cm at the top and bottom, respectively, and depth 22 cm) containing a commercial potting soil mix (Metro Mix 350, Hummert International, Topeka, KS, USA). After emergence, plants were thinned to two plants pot−1 and maintained until physiological maturity. A systemic insecticide, Marathon 1% G (granules) (a.i. Imidacloprid 1-[(6-Chloro-3-pyridinyl) methyl]-N-nitro-2-imidazolidinimine, Hummert International, KS, USA) was applied to each pot at 4 g pot−1. Each pot was fertilized with Osmocote (controlled release plant food, 14:14:14 %, N: P2O5: K2O, respectively; Hummert International, KS, USA) at 5 g pot−1 at sowing and at flowering. To avoid water stress, all pots were watered daily from sowing to maturity, and pots were placed in trays with standing water.
Hybridization procedure
Plants were grown under optimum temperature (OT; 30/20 °C; daytime maximum and nighttime minimum temperature) from emergence to start of the booting stage (Vanderlip and Reeves, 1972) in growth chambers (Conviron Model CMP 3244, Winnipeg, Manitoba, Canada). The daytime maximum temperature was held for 4 h (1000 h to 1400 h), and nighttime minimum temperature for 4 h (2200 to 0200 h), with a 8 h transition period between the daytime maximum and nighttime minimum temperatures and vice versa. The photoperiod was maintained at 16 h, and the photon flux density was approximately 990 μmol m−2 s−1 at the top of the plant canopy provided by cool fluorescent lamps. Relative humidity in the chambers was set at 75%. Air temperature and relative humidity were continuously monitored at 20 min intervals in all growth chambers throughout the experiment. At start of the booting stage, ten pots of RTx430 were moved to each growth chamber maintained at either OT, HT1 (36/26 °C), or HT2 (39/29 °C and remained until 7 d after full anthesis (start of seed-set stage). Six growth chambers representing three temperature regime (two per temperature regime) were used in this experiment. Each temperature regime had 40 plants (2 × 20 plants). For the pollination controls, ten pots of ATx399 were moved to another three growth chambers representing three temperature regimes (OT, 30/20; HT1, 36/26; and HT2, 39/29 °C). Before moving the plants into the growth chambers, the primary panicles were tagged in all plants. At anthesis stage, the middle portion of the panicle of each ATx399 plant was tagged and the remaining spikelets at the top and bottom were removed using scissors, and the panicle was covered with a pollination bag. On each panicle about 100 florets were marked to determine the seed-set percentage. Pollen from RTx430 of either the OT or HT1 or HT2 treated plants at anthesis were collected between 0730 h and 0800 h and pollinated on ATx399 and covered with the same bag. The manual crossing process was repeated for three successive days to ensure maximum pollination of all stigmas of tagged panicles. Crosses between a female and a male plant in each pair of temperatures (30/20 vs. 36/26, 30/20 vs. 39/29, and 36/26 vs. 39/29 °C) with four different combinations (OT female and OT male; OT female and HT male; HT female and OT male; and HT female and HT male) were performed. Direct crosses were also made between OT female and OT male (30/20 °C); HT1 female and HT1 male (36/26 °C) and HT2 female and HT2 male (39/29 °C). After imposing HT stress, all plants were returned to OT and maintained until harvest. At physiological maturity, the tagged panicles were harvested and dried at 40 °C for 7 d. Individually marked florets were checked for grain by pressing the floret between the thumb and the index finger. Both partially and fully filled tagged florets were used to determine seed-set percentage (ratio of the total number of tagged florets to the number of grains from the tagged florets).
For biochemical analysis, during anthesis, pollen and pistil from tagged panicles were collected from three different temperatures (OT, HT1 and HT2), frozen in liquid nitrogen immediately and stored at −80 °C. The activity of the enzymes: xanthine oxidase (XO), superoxide dismutase (SOD), catalase (CAT) and peroxidase (POX), and hydrogen peroxide (H2O2) content were quantified. For SOD, CAT, and POX assays, frozen pollen or pistils were homogenized in 1 mL of ice-cold 0.1 mol Tris-HCl buffer, pH 7.8 per gram fresh weight of tissue. The homogenate was centrifuged at 20,000 g at 4 °C for 10 min. The supernatant was used for measuring enzyme activity using methods described in the next section.
Pollen viability and in-vitro germination
At the time of anthesis, 5–10 florets were collected between 0730 and 0800 h from five tagged panicles. The pollen grains were squeezed from the anthers with tweezers and collected on a clean slide. Pollen viability was tested using 2% tri-phenyl tetrazolium chloride stain. A drop of tetrazolium chloride was added to the dispersed pollen. Tetrazolium chloride stains the viable pollen with reddish purple color due to the formation of insoluble red formazan. The number of pollen grains stained was recorded 30 min after staining using a light microscope at 10X magnification (Olympus BX 51, Center Valley, PA). The percentage of viable pollen was considered to be the percentage of total pollen stained to the total number per microscopic field. The in-vitro pollen germination was assessed by germinating the pollen in a medium consisting of 150 mg H3BO3, 500 mg Ca(NO3)2.4H2O, 200 mg MgSO4.7H2O, 100 mg KNO3, and 300 g sucrose dissolved in 1 L of deionized water to which 10 g of agar L−1 was added (Prasad et al., 2006). The mixture was slowly heated on a hot plate until the agar was completely dissolved. The germinating medium was poured onto a clean glass slide and incubated at 30 °C. The collected pollen grains were evenly distributed on five glass slides smeared with the pollen germinating medium and kept in the dark for 45 min. The percentage of pollen germination was estimated by counting the total number of pollen and number of germinated pollen in three random microscopic fields in each glass slide. Pollen was considered germinated if the pollen tube was longer than the diameter of the pollen grain (Prasad et al., 2006).
Reactive Oxygen Species
Xanthine oxidase (XO) enzyme activity
The pollen and pistils (100 mg) were ground separately in 1 mL of phosphate buffer pH 7.5 and centrifuged at 15000 g for 10 min at 4 °C. The supernatant was collected and analyzed for superoxide radical (O2−) production (30 min at 37 °C) using xanthine as substrate. The Amplex® Red Xanthine Oxidase Assay kit (Molecular Probes, Eugene, OR catalog number A22182) was used for the analysis and expressed as enzyme units (Hofer et al., 2008). One enzyme unit was defined as the amount of xanthine oxidase that forms 1 μmol of uric acid from hypoxanthine at 25 °C per gram of tissue on a fresh weight basis.
H2O2 content
The pollen and pistils (100 mg) were grounded separately in 1 mL of cold acetone, centrifuged at 5000 g for 10 min at 4 °C and the supernatant was used for H2O2 assay. The H2O2 content was measured using a molecular probe (Amplex® Red hydrogen peroxide/peroxidase assay kit; Invitrogen Molecular Probes, Inc., Eugene, OR, USA, catalog number A22188), which is a one-step assay that uses the Amplex® Red reagent (10-acetyl-3,7-dihydroxyphenoxazine) to detect H2O2. The Amplex® Red reagent, in combination with horseradish peroxidase (HRP), was used to detect H2O2. In the presence of peroxidase, the Amplex® Red reagent reacts with H2O2 in a 1:1 stoichiometry to produce the red-fluorescent oxidation product, resorufin, which has an absorption maximum at 560 nm. The background absorbance derived from the no-H2O2 control was subtracted for all samples, and the data were expressed as nmol g−1 on fresh weight basis (Shin et al., 2005).
Antioxidant enzyme activity
SOD enzyme activity
Total SOD activity was measured in the supernatant collected using the superoxide dismutase assay kit (Cayman Chemical, Ann Arbor, Michigan, USA, catalog number 706002). This kit utilizes a tetrazolium salt for detection of superoxide radicals generated by xanthine oxidase and hypoxanthine. The SOD activity was expressed in enzyme units. One unit of SOD is defined as the amount of enzyme needed to obtain 50% dismutation of superoxide radical (Sebastiani et al., 2007).
CAT enzyme activity
Catalase enzyme activity was measured using Amplex® Red catalase assay kit (Molecular probes, Invitrogen, Inc., Eugene, OR, USA, product number A22180), as it provides an ultrasensitive, simple assay method for measuring CAT activity. In the assay, CAT first reacts with H2O2 to produce water and oxygen [O2]. Next, the Amplex red reagent (10-acetyl-3,7-dihydroxyphenoxazine) reacts with a 1:1 stoichiometry with any unreacted H2O2 in the presence of HRP to generate the red-fluorescent oxidation product, resorufin, which has the absorption maxima at 560 nm. One enzyme unit was defined as the amount of catalase enzyme that decomposes 1.0 μmol of H2O2 min−1 at 25 °C g−1 of tissue on a fresh weight basis (Jones and Suggett, 1968).
POX enzyme activity
The peroxidase activity was measured using the Amplex® Red hydrogen peroxide/peroxidase assay kit (Molecular Probes, Invitrogen, Inc., Eugene, OR, USA), which is a one-step assay that uses the Amplex® Red reagent (10-acetyl-3,7-dihydroxyphenoxazine) to detect POX activity. The enzymatic activity of peroxidases was determined following the same procedure as for H2O2 determination, except that the Amplex Red reagent contained 2 mmol H2O2 instead of HRP. The result was expressed in enzyme units (Liu et al., 2010). One enzyme unit is defined as the amount of enzyme that forms 1.0 mg purpurogallin from pyrogallol in 20 sec at pH 6.0 and 20 °C.
Pollen and stigma morphology and anatomy
The pollen and pistil samples were collected at anthesis from the OT, HT1 and HT2 from the tagged panicles. Pollen was dusted on double-stick carbon tape affixed to a carbon stub, dipped immediately in super-cooled ethanol for 1–3 sec and stored at −80 °C until further analysis. Similarly, the ovary along with style and stigma were taken carefully from individual florets, placed on double-stick carbon tape and processed in the same way as described for pollen. The carbon stub was placed in a vacuum desiccator for ~2 min to remove excess moisture from the stub at the time of analysis. The pollen, stigma, style and ovary were viewed under a scanning electron microscope (SEM; Nova NanoSEM 430, FEI, Hillsboro, OR, USA) using a LVD detector (low vacuum detector). The SEM was operated in a vacuum, 5 kV, with a spot size of 3 and a pressure of 72.5 Pa. The images were taken at 1500X, 3000X and 12000X magnification for pollen and at 200X, 150X and 600X magnification for style and stigma, and ovary.
Pollen and pistil were collected as above and fixed immediately in 4% glutaraldehyde in 100 mM sodium cacodylate buffer, pH 7.2. Following aldehyde fixation, samples were post-fixed in 2% osmium tetroxide in the same cacodylate buffer, stained in 1% aqueous uranyl acetate for 8 h, dehydrated in acetone and embedded in Spurr’s resin. Ultrathin sections (<100 nm thick) were made using ultramicrotome, examined with a CM 100 (FEI Company, Hillsboro, OR, USA) transmission electron microscope (TEM) and pictures were taken using AMT digital image capturing system for image analysis. Images were acquired in different magnification based on the fine details of the tissue under focus.
Field studies using heat tents
To determine the impact of HT stress on pollen and pistil function under field conditions, ATx399 and RTx430 were planted at North Farm, Kansas State University, Manhattan, Kansas during June 2012 and 2013. Standard field crop management practices [75 cm spacing between rows and target plant population of 12 plants m−2; 10 g N m−2 as urea granules (46% N)] were followed. Pre-emergence herbicide application and hand weeding were done as and when needed. Fields were flood irrigated as necessary to avoid water stress throughout the crop growing season.
To impose HT stress during booting, three heat tents were placed on the field-grown ATx399 and three heat tents on RTx430 lines from the start of booting until the start of grain filling (about 7 d after full anthesis) stage. The plants from outside the heat tents served as control (ambient temperature). The procedures for tagging and determination of seed-set percentages were similar as detailed in the growth chamber experiment. Each heat tent was built on a galvanized steel frame-work with an additional frame (0.6 m) on the top that could open and close. The steel frame-work was covered with clear polyethylene film, which transmits 85% of incoming solar radiation. Each heat tent was 5.4 m wide, 7.2 m long, and 3.0 m high at the apex. There were no artificial heating systems; the heat tents are heated via natural solar radiation (greenhouse effect). Temperature increases inside the heat tents are dependent on the intensity of solar radiation and outside ambient temperatures. On a clear sunny day, the temperature inside the heat tent can be up to 10 °C warmer than the outside ambient temperature (Prasad et al., 2015). Each heat tent was equipped with a solar-powered battery to operate the actuators to open and close the additional frame on the top when temperatures were too high (the maximum was set at 45 °C) to avoid excessive heating. Each heat tent has a 15 cm clearance on all four sides to allow circulation of air within the heat tent. Air temperature and relative humidity were measured using WatchDog data loggers (1000 Series Micro Station, Spectrum Technologies, Aurora, IL, USA) at 30 min intervals. Similarly, incoming solar radiation was measured using PAR sensors (LightScout Quantum Light Sensor, Spectrum Technologies, Aurora, IL, USA).
As detailed in previous sections, data on pollen viability and germination, ROS, H2O2 content, XO, SOD, CAT and POX enzymes activity, morphology, membrane damage in pollen and pistil were recorded along with seed-set percentage. The ROS content and membrane damage of pollen and pistil were imaged using molecular probes as described by Djanaguiraman et al. (2014).
Phospholipid profiling
At the time of anthesis, 20–25 florets were collected between 0730 and 0800 h from five tagged plants outside and inside the heat tent representing ambient and HT conditions. Pollen was squeezed from the anthers with tweezers and collected on clean slides. Immediately (within 15–20 s), the pollen was transferred to 3 mL of hot isopropanol (75 °C) containing 0.01% butylated hydroxy toluene (BHT). Next, 1.5 mL of chloroform and 0.6 mL of water were added. The tubes were shaken for 1 h, followed by removal of the extract. The pollen grains were re-extracted with chloroform:methanol (2:1) with 0.01% BHT for five times with 30 min of agitation each time, until all of the remaining pollen turned white. The combined extracts were washed once with 1 mL of 1 M KCl and once with 2 mL of distilled water. The solvent was evaporated under nitrogen, and the lipid extract was dissolved in 1 mL of chloroform. Similarly, 20–25 florets were collected, dissected to collect the pistil and immediately transferred to 3 mL of hot isopropanol containing 0.01% BHT and processed in the same way as described for pollen. Internal standards were added and quantification of phospholipids was done by electrospray ionization tandem mass spectrometry (ESI-MS/MS) as previously described (Xiao et al., 2010).
Data analyses
The experimental design was a complete randomized design. Plants were selected randomly for treatments and were arranged randomly within the growth chambers. The temperatures were randomly assigned to growth chambers. In the field, the position of the tents was randomly allocated. Seed-set percentage was recorded from at least eight independent plants grown in growth chambers and anatomical, biochemical and lipid analyses were from at least five independent plants. In the field, seed-set percentage were determined from at least 25 plants and all the anatomical, biochemical and lipid analyses were from at least five independent plants. The field and controlled environment experiments were repeated again. Data were analyzed using the ProcGLM procedure of the SAS program (SAS Institute 2003). Standard error was shown as an estimate of variability, and means of various variables were separated for significance by the LSD test at a probability level of 0.05.
RESULTS
Quality control of growth chambers
Mean daytime maximum and nighttime minimum temperatures in all growth chambers were ± 0.5 °C of the target daytime and nighttime temperatures, and relative humidity was within ± 10% of the target. The quality of the temperature control and growth chamber performance was previously described (Pradhan et al., 2012; Djanaguiraman et al., 2013b). The average maximum air temperature between 1000 to 1200 h outside and inside the heat tent during 2012 and 2013 was 23 and 31 °C and 39 and 43 °C, respectively (supplementary Figure S1).
Pollen viability and in-vitro germination
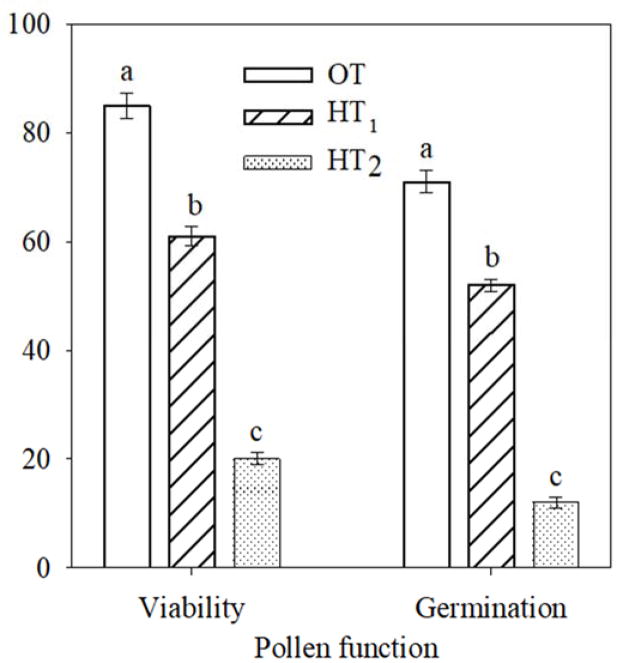
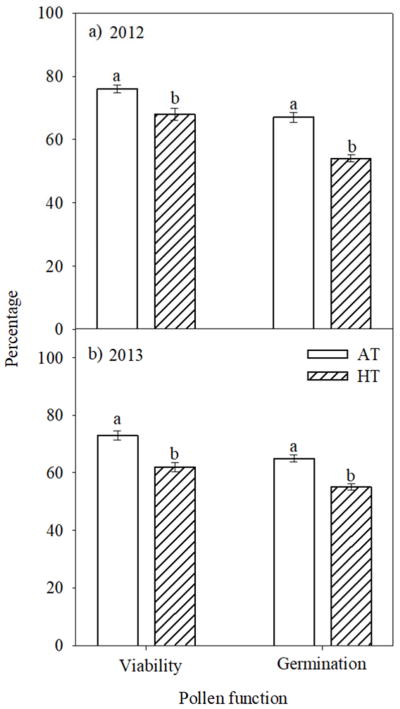
Pollen viability and in vitro germination was 85 and 71%, respectively, under OT, but exposure to HT1 significantly (P<0.001) decreased to 61 and 52%, and to HT2 to 20 and 12%, respectively (Fig. 1). Similarly, under field conditions the pollen viability and germination were significantly (P<0.001) decreased from 73 and 65% to 62 and 55%, during 2012 and 2013, respectively by HT stress (Fig. 2).
Figure 1.
Impact of temperature regimes (OT: 30/20 or HT1: 36/26 or HT2: 39/29 °C daytime maximum/nighttime minimum temperature) on pollen viability and germination in controlled environment experiment. Each data point is the average of five independent observations. Vertical bars denote ± s.e. of means. Means followed by the same letter(s) were not significantly different (P≤0.05) as determined by LSD test.
Figure 2.
Impact of HT stress imposed by heat tents (31 and 43 °C, daytime maximum between 10:00 to 12:00 h during 2012 and 2013, respectively) and relative outside ambient conditions (23 and 39 °C, daytime maximum between 10:00 to 12:00 h during 2012 and 2013, respectively) on pollen viability and pollen germination during (a) 2012 and (b) 2013. Each data point is the average of five independent observations. Vertical bars denote ± s.e. of means. Means followed by the same letter(s) were not significantly different (P≤0.05) as determined by LSD test. AT: ambient temperature (outside the heat tent) and HT: high temperature (inside the heat tent).
Sensitivity of reproductive tissues
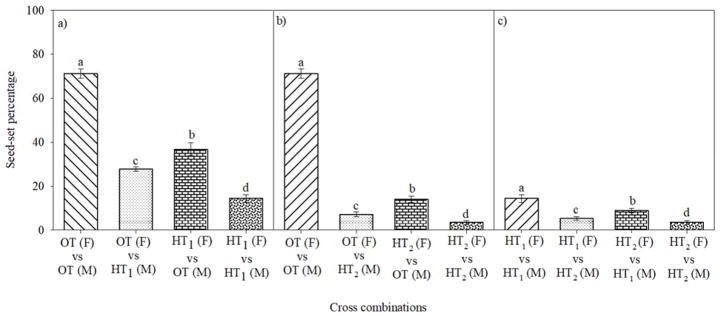
There was a significant effect of temperature (P<0.001) on seed-set percentage, as measured by direct and reciprocal crosses. Pollination of pistil under OT with pollen from OT recorded 71% seed-set percentage (Fig. 3a). Pollination of pistil under OT with pollen from HT1 or HT2 recorded 27% and 7%, seed-set percentage, respectively (Fig. 3a, b). However, pollination of pistil under HT1 and HT2 with pollen from OT recorded 36 and 14%, respectively (Fig. 3a, b). Similarly, pollination of pistil under HT1 with pollen from HT1 and HT2 recorded 14 and 5.3%, seed-set percentage, respectively (Fig. 3a, b). Pollination of pistil under HT1 or HT2 with pollen from HT1 and HT2 recorded 8.9 and 3.5%, seed-set percentage, respectively (Fig. 3c).
Figure 3.
Impact of temperature regimes (OT: 30/20 or HT1: 36/26 or HT2: 39/29 °C daytime maximum/nighttime minimum temperature) on mean seed-set percentage in various cross combinations under controlled environment conditions. Each data point is the average of at least eight independent observations. Vertical bars denote ± s.e. of means. Means followed by the same letter(s) were not significantly different (P≤0.05) as determined by LSD test. F: A line (male sterile, female line), M: R line (male fertile, male line).
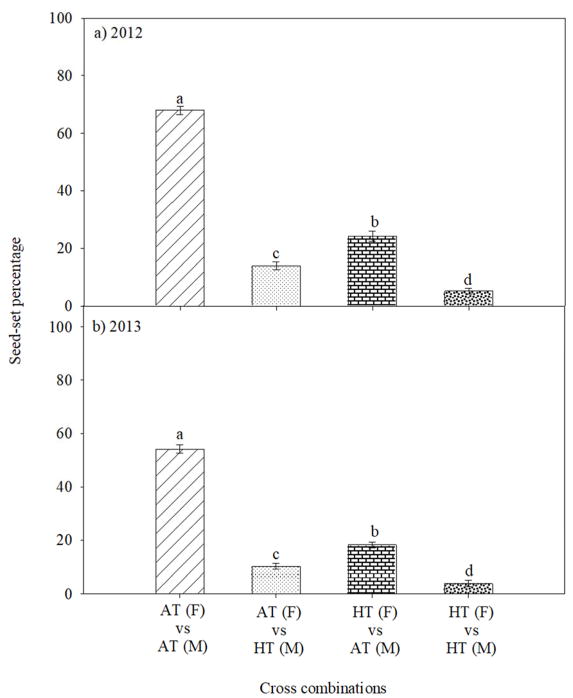
Field experiments showed that pollination of pistil under ambient temperature (AT) with pollen from AT recorded 68 and 54.2%, seed-set percentage during 2012 and 2013, respectively (Fig. 4a, b). Pollination of pistil under AT with pollen from HT recorded 14 and 10.2%, seed-set percentage during 2012 and 2013, respectively (Fig. 4a, b). However, pollination of pistil under HT with pollen from AT recorded 24.2 and 18.2%, seed-set percentage during 2012 and 2013, respectively (Fig. 4a, b). Severe decreases in seed-set percentage was recorded when HT stressed pistil was pollinated with HT stressed pollen (5.2 and 3.8%, during 2012 and 2013, respectively) (Fig. 4a, b).
Figure 4.
Impact of HT stress imposed by field based heat tents (31 and 43 °C, daytime maximum between 10:00 to 12:00 h during 2012 and 2013, respectively) and relative outside ambient conditions (23 and 39 °C, daytime maximum between 10:00 to 12:00 h during 2012 and 2013, respectively) on mean seed-set percentage in various cross combinations during (a) 2012 and (b) 2013. Each data point is the average of at least twenty-five independent observations. Vertical bars denote ± s.e. of means. Means followed by the same letter(s) were not significantly different (P≤0.05) as determined by LSD test. AT: ambient temperature (outside the heat tent) and HT: high temperature (inside the heat tent). F: A line (male sterile, female line), M: R line (male fertile, male line).
Morphological and anatomical changes
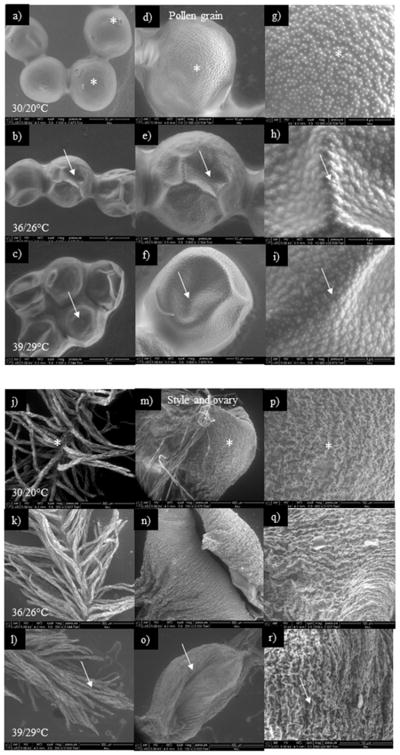
Morphological analysis of pollen using scanning electron microscope (SEM) indicates that exposure to HT1 or HT2 resulted in collapsed (Fig. 5b, c) and desiccated (Fig. 5e, f) pollen when compared to pollen from OT (Fig. 5a, d). However, the intensity of desiccation was higher at HT2 than HT1. The columellae heads in the exine wall were present and round in shape at OT (Fig. 5a); however, at HT1 or HT2 they were lost or non-uniform (Fig. 5b, c). Pollen from OT had small microechinate exine ornamentation (Fig. 5g), but the pollen from HT1 and HT2 had irregular, deeply pitted and large microechinate ornamentation (Fig. 5h, i). At HT2, the stigma and style were desiccated and flaccid (Fig. 5l) and normal at OT and HT1 (Fig. 5k, j). The ovary at HT2 was more desiccated than at HT1 (Fig. 5n, o, q, r), whereas with OT, the ovaries were turgid (Fig. 5m, p).
Figure 5.
Scanning electron microscopic images of surface of pollen grains and style and ovary at optimum temperature (OT, 30/20 °C; daytime maximum/night-time minimum temperature) and high temperatures (HT1, 36/26 °C; HT2, 39/29 °C). (a, d, g) pollen grains of OT, (b, e, h) pollen grains of HT1, (c, f, i) pollen grains of HT2, (j, m, p) style and ovary of OT, (k, n, q) style and ovary of HT1 and (l, o, r) style and ovary of HT2. Arrows in pollen grains indicate shrivelled and disturbed exine ornamentation under HT stress. Similarly, the arrows in style, and ovary indicate desiccated style, and desiccated ovary. The corresponding information in OT is indicated by *. (a) Normal oval-shaped pollen grain, aperture and columellae head in pollen grain, (d) unshrivelled and uncollapsed pollen grain, (g) less ornamentation in exine wall of pollen grain, (b, c) shrivelled and collapsed pollen grain, (e, f) collapsed aperture and columellae head, (h, i) deep pits and non-smooth surface in exine wall of pollen grain, (j, m, p) turgid and mucilaginousstyle and ovary, and (k, n, q, l, o, r) desiccated style, flaccid and dried ovary.
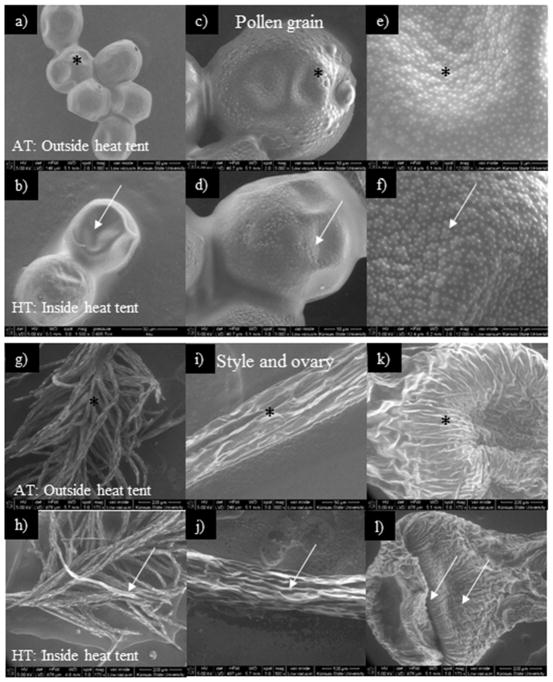
In the field, the pollen from HT stress showed loss of columellae head, more desiccation, and large microechinate ornamentation (Fig. 6b, d, f), while under AT pollen was normal (Fig. 6a, c, e). Similarly, under HT stress, desiccated stigma, style and ovary (Fig. 6h, j, l) were observed to be normal under AT (Fig. 6g, i, k).
Figure 6.
Scanning electron microscopic images of surface of pollen grains and style and ovary of heat tents (31 and 43 °C, daytime maximum between 10:00 to 12:00 h during 2012 and 2013, respectively) and relative outside ambient conditions (23 and 39 °C, daytime maximum between 10:00 to 12:00 h during 2012 and 2013, respectively). (a, c, e) pollen grains of AT (outside the heat tent), (b, d, f) pollen grains of HT stress (inside the heat tent). Arrows in pollen grains indicate shrivelled and disturbed exine ornamentation under HT stress. Similarly, the arrows in style and ovary indicate desiccated style, and ovary. The corresponding information in AT is indicated by *. (a, c, e) Normal and less shrivelled oval-shaped pollen grain, and normal aperture and columellae head in pollen grain, (b, d, f) shrivelled and collapsed pollen grain, collapsed aperture and columellae head, deep pits and non-smooth surface in exine wall of pollen grain, Similarly, (g, i, k) the style and ovary of AT and (h, j, l) pistil of HT stress, (g, i, k) turgid and undamagedstyle and ovary, (h, j, l) desiccated, flaccid and damaged style and ovary. The corresponding information in AT is indicated by *.
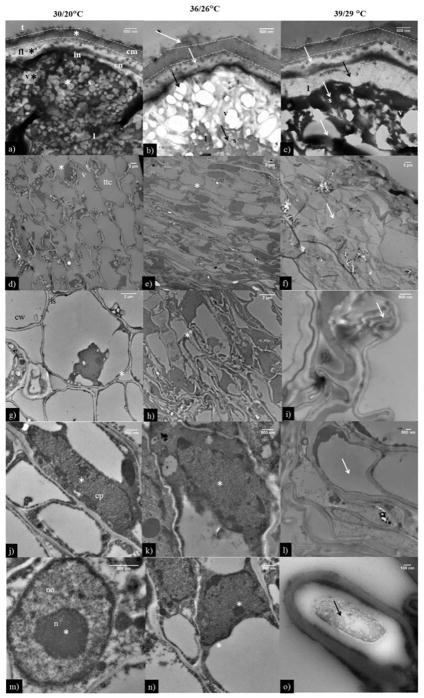
The anatomical studies using transmission electron microscope (TEM) showed that under OT the pollen had a tectum with prominent columellae and a thin foot layer, an uneven thin endexine and an evenly thin intine (Fig. 7a). However, at HT1 and HT2, the tectum layer was thick and the columellae wall was thin, compared with OT (Fig. 7b, c). The foot layer was thick at HT1 and HT2 compared with OT (Fig. 7a, b, c). Pollen at HT1 and HT2 showed an absence of endexine and the onset of vacuolation in the intine (Fig 7b, c); however, the vacuolation process had not been started at OT (Fig. 7a). Along with this, the size and number of vacuoles were small and few at OT, while at HT1 and HT2 the size was large with and in significantly higher numbers (Fig. 7a, b, c).
Figure 7.
Transmission electron microscopic images of pollen grains and pistil (stigma, style and ovary) at OT (30/20 °C; daytime maximum/night-time minimum temperature) and HT1 (36/26 °C) and HT2 (39/29 °C). (a) pollen grains of OT, (b) pollen grains of HT1, (c) pollen grains of HT2. At HT (36/26 and 39/29 °C) the arrows in pollen grains indicate thick foot layer, absence of endexine, onset of vacuolation and larger vacuoles. The corresponding information in OT is indicated by *. Similarly, the arrows in ovary indicate (f) small transmitting tissue, (i) intercellular spaces, (l) less dense cytoplasm (o) denatured nuclear material (apoptosis) and absence of nucleolus and corresponding OT and HT1 were shown as *. cm: columella; en: endexine; fl: foot layer; in: intine; t: tectum; l: lipidic droplets, s: starch granules, v: vacuoles, ttc: transmitting tissue cell, cw: cell wall, is: intercellular space, cp: cytoplasm, n: nucleus, no: nucleolus.
The ovary tissue of OT showed a large vacuole, transmitting tissue of style cell, an undamaged cell wall with a clear intercellular space, and a dense cytoplasm and nucleolus (Fig. 7d, g, j, m). At HT1, there was not much difference in the size of the transmitting tissue of the style cell size, membranes were undamaged, and cytoplasm and nucleolus were dense (Fig. 7e, h, k, n). However, at HT2, cell shape and size of transmitting tissue of style was reduced, membranes were folded, and dense cytoplasm and nucleolus were lacking (Fig. 7f, i, l, o).
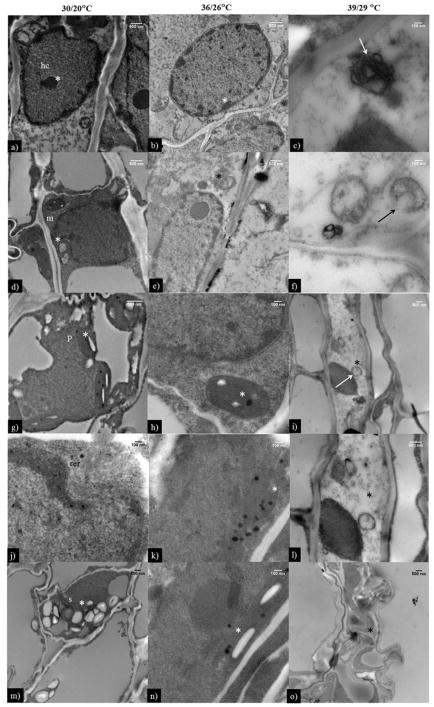
The ovary at OT and HT1 had a clear nuclear envelope and uncoiled genetic material (Fig. 8a, b); however, at HT2, the damaged nuclear envelope and coiled genetic material were observed (Fig. 8c). Similarly, the mitochondria, plastids, and rough endoplasmic reticula were undamaged and prominent at OT (Fig. 8d, g, j) and HT1 (Fig. 8e, h, k), while, at HT2, damaged mitochondria andplastid, and absence of rough endoplasmic reticulum were observed (Fig. 8f, i, l). Prominent starch granules were observed at OT and HT1 (Fig. 8m, n), and no starch granules were observed at HT2 (Fig. 8o).
Figure 8.
Transmission electron microscopic images of pistil (stigma, style and ovary) at OT (30/20 °C; daytime maximum/nighttime minimum temperature) and HT1 (36/26 °C) and (HT2 (39/29 °C). The * in ovary indicate (c) heterochromatin, (f) damaged mitochondria, (i) damaged plastid, (l) no or less rough endoplasmic reticulum, and (o) no or less starch grains at 39/29 °C and corresponding OT and HT1 were shown as *. hc: heterochromatin, m: mitochondrion, p: plastid, rer: rough endoplasmic reticulum, and s: starch grain.
Oxidative damage
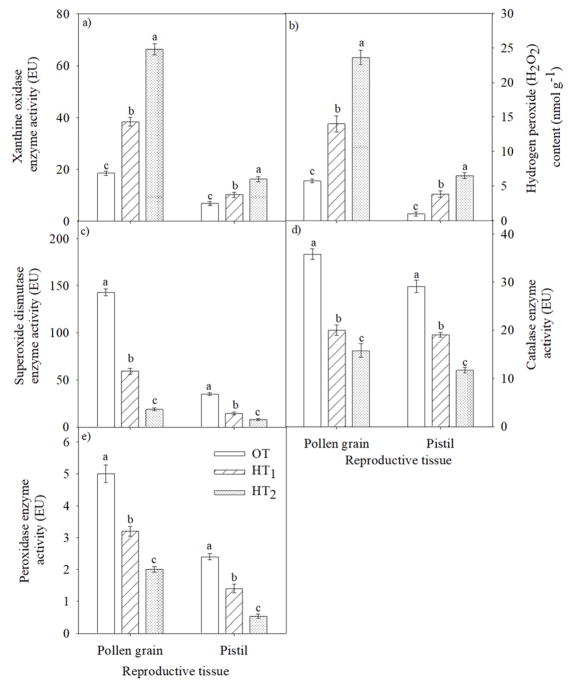
In the pollen, HT stress (36/26 and 39/29 °C) significantly (P<0.001) increased O2− content (2 and 3.5 fold, respectively) compared with OT (Fig. 9a). Similarly, in the pistil the increase in the O2− content was 1.4 and 2.3 fold at HT1 and HT2, respectively (Fig. 9a). The H2O2 content was significantly (P<0.001) increased by 3.8 and 6.5 fold at HT1 and HT2, respectively in the pollen (Fig. 9b) and 2.4 and 4.1 fold at HT1 and HT2, respectively in the pistil (Fig. 9b).
Figure 9.
Impact of temperature regimes (OT: 30/20 or HT1: 36/26 or HT2: 39/29 °C daytime maximum/nighttime minimum temperature) on (a) xanthine oxidase enzyme activity (EU), (b) hydrogen peroxide (H2O2) content (nmol g−1), (c) superoxide dismutase enzyme activity (EU), (d) catalase enzyme activity (EU) and (e) peroxidase enzyme activity in pollen and pistil (EU). Each data point is the average of five independent observations. Vertical bars denote ± s.e. of means. Means followed by the same letter(s) were not significantly different (P ≤ 0.05) as determined by LSD test.
In the pollen, the SOD enzyme activity was decreased by 58% at HT1 and 87% at HT2 relative to OT (Fig. 9c). In pistil, similar decreases (59 and 77%) were observed at HT1 and HT2, respectively (Fig. 9c). The CAT enzyme in the pollen decreased by 44 and 56%, and in pistil by 35 and 60% at HT1 and HT2, respectively, as compared with OT (Fig. 9d). Similarly, the peroxidase activity was decreased by 36 and 60% in the pollen at HT1 and HT2, respectively compared with OT. Following a similar trend, the pistil showed a decrease of 42% at HT1 and 78% at HT2, respectively, relative to OT (Fig. 9e).
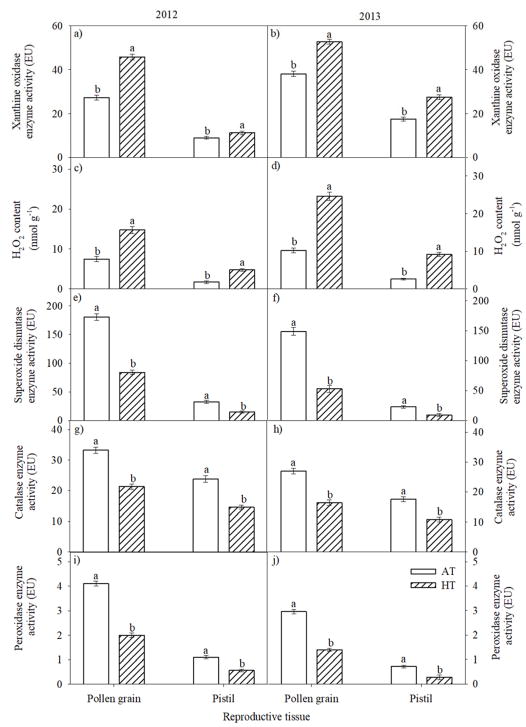
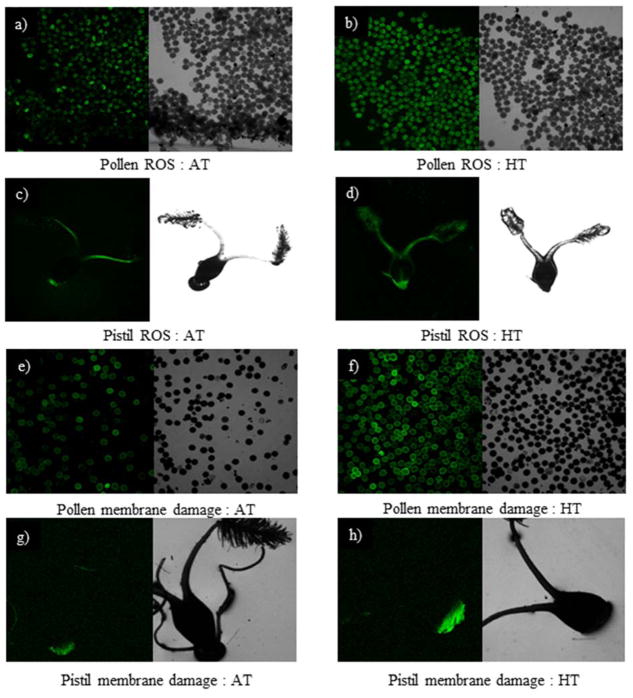
In the field condition, increase in ROS content (Fig. 10a, b, c, d) and a decrease in SOD, CAT and POX enzyme activities (Fig. 10e, f, g, h, i, j) were observed in pollen and pistil in 2012 and 2013 seasons. However, pistil had a smaller increase in ROS and a smaller decrease in SOD, CAT and POX activity than pollen. Visualization of ROS in the pollen and pistil using dichlorodihydro fluorescein (DCF) fluorescence indicated that pollen under AT had less fluorescence (Fig. 11a) than pollen under HT (Fig. 11b). Similarly, pistil of AT (Fig. 11c) showed less fluorescence than at HT (Fig. 11d). HT stress increased pollen and pistil membrane damage compared with AT as revealed by a Sytox green nuclei acid stain (Fig. 11e, f, g, h). The intensity of fluorescence emissions for pollen membrane damage was higher than pistil at HT (Fig. 11f, h).
Figure 10.
Impact of HT stress imposed by heat tents (31 and 43 °C, daytime maximum between 10:00 to 12:00 h during 2012 and 2013, respectively) and relative outside ambient conditions (23 and 39 °C, daytime maximum between 10:00 to 12:00 h during 2012 and 2013, respectively) on (a) and (b) xanthine oxidase enzyme activity (EU), (c) and (d) hydrogen peroxide (H2O2) content (nmol g−1), (e) and (f) superoxide dismutase enzyme activity (EU), (g) and (h) catalase enzyme activity (EU), and (i) and (j) peroxidase enzyme activity (EU) in pollen and pistil during 2012 and 2013, respectively. Each data point is the average of five independent observations. Vertical bars denote ± s.e. of means. Means followed by the same letter(s) were not significantly different (P≤0.05) as determined by LSD test. AT: ambient temperature (outside the heat tent) and HT: high temperature (inside the heat tent).
Figure 11.
Representative images showing the effect of temperature regime created by heat tent: (a, c, e, g) outside the heat tent (AT; 23 and 39 °C, daytime maximum between 10:00 to 12:00 h during 2012 and 2013, respectively) and (b, d, f, h) inside the heat tent (HT stress; 31 and 43 °C, daytime maximum between 10:00 to 12:00 h during 2012 and 2013, respectively). (a, b) ROS level of pollen grains in AT and HT, respectively quantified by Live green ROS detection stain, (c, d) ROS level of pistil in AT and HT, respectively, (e, f) membrane damage of pollen grains in AT and HT, respectively quantified by Sytox green nuclei acid stain and (g, h) membrane damage of pistil in AT and HT, respectively. Black unstained pollen and pistil by Live green ROS detection stain indicate an absence of ROS, and green stained pollen and pistil indicate the presence of ROS. The intensity of the green colour is proportional to ROS level. Similarly, black unstained pollen and pistil by a Sytox green nuclei acid stain indicate an absence of membrane damage and green stained pollen and pistil indicate the presence of membrane damage. The intensity of the green colour is proportional to membrane damage.
Membrane glycerolipid composition
Plastidic lipid classes monogalactosyldiacylglycerol (MGDG), digalactosyldiacylglycerol (DGDG), and PG are higher in pistils than in pollen. Significant (P<0.05) differences in the pistil, due to HT stress, were observed only in (DGDG content (Table 1). In pollen, between the temperature regimes, there were significant (P<0.05) differences in MGDG, phosphatidylethanolamine (PE), phosphatidylserine (PS), phosphatidic acid (PA), and lysophosphatidylcholine (LPC) content (P<0.05; Table 1). Pollen phospholipids found primarily outside the plastid (PC, PE, PI, PS, and PA) were rich in molecular species that contain 18:3 (linolenic acid), i.e., 34:3 (likely 16:0/18:3) and 36:6 (di18:3), whereas pistils had a more varied composition with relatively high levels of 18:2-containing phospholipids, i.e., 34:2 (16:0/18:2) and 36:4 (likely di18:2).
Table 1.
Effect of temperature regime on total amount of lipid in each head group class in pollen and pistil in sorghum (mol %). AT: ambient temperature (outside heat tent), HT: HT stress (inside heat tent).
| Lipid species | Temperature regime (° C) | |||
|---|---|---|---|---|
|
| ||||
| Pollen | Pistil | |||
|
| ||||
| AT | HT | AT | HT | |
| Monogalactosyldiacylglycerol | 2.18±0.10A | 1.55±0.03B | 19.50±1.46a | 19.93±0.93a |
| Digalactosyldiacylglycerol | 3.68±0.14A | 3.35±0.03A | 9.79±0.63a | 7.59±0.37b |
| Phosphatidylglycerol | 1.22±0.04A | 1.23±0.05A | 4.23±0.38a | 3.52±0.41a |
| Phosphatidylcholine | 50.46±1.26A | 50.00±1.02A | 42.36±1.81a | 41.90±1.11a |
| Phosphatidylethanolamine | 20.81±0.98A | 26.65±0.64B | 14.29±0.68a | 16.49±0.44a |
| Phosphatidylinositol | 9.15±0.97A | 7.50±0.27A | 4.53±0.48a | 4.81±0.61a |
| Phosphatidylserine | 0.18±0.02A | 0.30±0.02B | 0.66±0.05a | 1.02±0.15a |
| Phosphatidic acid | 8.66±1.26A | 4.71±0.13B | 3.08±0.25a | 2.78±0.40a |
| Lysophosphatidylcholine | 2.14±0.19A | 3.08±0.25B | 0.67±0.05a | 0.83±0.11a |
| Lysophosphatidylethanolamine | 1.34±0.07A | 1.56±0.10A | 0.32±0.01a | 0.38±0.04a |
| Lysophosphatidylglycerol | 0.18±0.04A | 0.07±0.01A | 0.55±0.06a | 0.74±0.08a |
Data are means ± s.e. of five observations. Pollen and pistil were analysed separately for significance. Means with different letters in each row are significantly (P < 0.05) different.
DISCUSSION
Overall, results indicate that HT stress (i) decreased pollen and pistil viability leading to decreased seed-set percentage, (ii) increased oxidative damage in pollen and pistil, (iii) altered pollen and pistil morphology and anatomy and phospholipid unsaturation level, and (iv) pollen was relatively more susceptible than pistil to HT stress.
HT stress from gametogenesis through flowering led to decreased seed-set in sorghum in both controlled environment and field experiments (Figs. 3 and 4). Similar observations were reported in other cereals including rice (Ye et al., 2015, Bahuguna et al., 2014), wheat (Triticum aestivum L., Prasad and Djanaguirman, 2014) and maize (Zea mays L., Carlson, 1990). The loss of floret fertility under HT stress during micro and megasporogenesis or fertilization is attributed to loss of pollen or ovule viability and/or stigma receptivity (Prasad et al., 2008; Nguyen et al., 2013; Djanaguiraman et al., 2014; Prasad and Djanaguiraman, 2014).
Studies have indicated that HT stress can affect male and female organs differently in different crops (Herrero, 2003; Hedhly et al., 2008). Pollen developing under HT stress had abnormal exine with deeply pitted and non-smooth surface regions (Fig. 5h, 5i, 6f). Exine originates from the tapetal cells, and the altered exine ornamentation under HT stress indicates disruption of tapetal cells and changes in exine thickness and roughness (Fig. 7b, c). The damaged tapetal cells may affect the translocation of nutrients to the developing pollen, which eventually leads to pollen sterility (Hess and Hesse, 1994; Jain et al., 2007). Anatomical evidence showed that irrespective of the temperature, ontogenetic appearance of microchannels coincides with tapetal degradation (Fig. 7a, b, c) supporting the hypothesis that these channels function in the transport of tapetally derived material to the developing pollen tube (Taylor et al., 2015). HT stress increased the intine thickness (Fig. 7b, c); the increased thickness could serve to protect the sperm cell(s) inside the pollen (Jiang et al., 2015). Pollen from OT had large numbers of starch granules and small vacuoles. However, under HT stress, the pollen was devoid of starch granules and the presence of a large vacuole indicates tapetal cell degradation. This observation is in accordance with the finding of Jain et al. (2007).
Similar to pollen, pistils have been documented to be sensitive to HT stress in different crops (Saini et al., 1983, Hedhly et al., 2005, Gupta et al., 2015; Djanaguiraman et al., 2017), but not in grain sorghum. Successful fertilization requires the maternal guidance of the pollen tube through the maternal sporophytic tissue, to the embryo sac (Higashiyama et al., 2001; Rotman et al., 2003). HT stress deformed and desiccated the sorghum style and ovary (Fig. 5l, 5o, 6h, 6j), which could be key reasons for unsuccessful fertilization. Sorghum stigma is categorized as dry type (Heslop-Harrison, 1982), the biomolecules like lipids, carbohydrates, and proteins in stigma form the adhesive matrix for dry stigma (Swanson et al., 2004) and water and lipids provide directional cues for the developing pollen tube (Wolters-Arts et al., 1998). The desiccated stigma and style under HT stress may not provide clear directional clues, leading to the disoriented growth of the pollen tube. HT stress caused damage to cell membranes, protoplasm, nucleolus, plastid, mitochondria, and endoplasmic reticulum in the ovary, which are signs of programmed cell death (PCD). Sun et al. (2004) observed ovary PCD under salt stress. Cell organelle membrane and cell organelle per se damage, measurement of the contents of O2− and H2O2 and the activities of a cohort of antioxidant enzymes (Fig. 9, 10) revealed that the PCD is exerted in a ROS dependent manner.
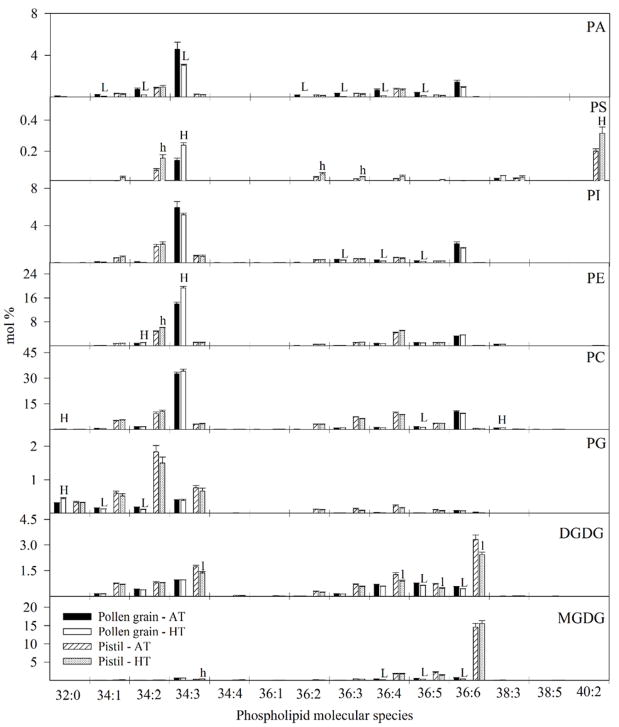
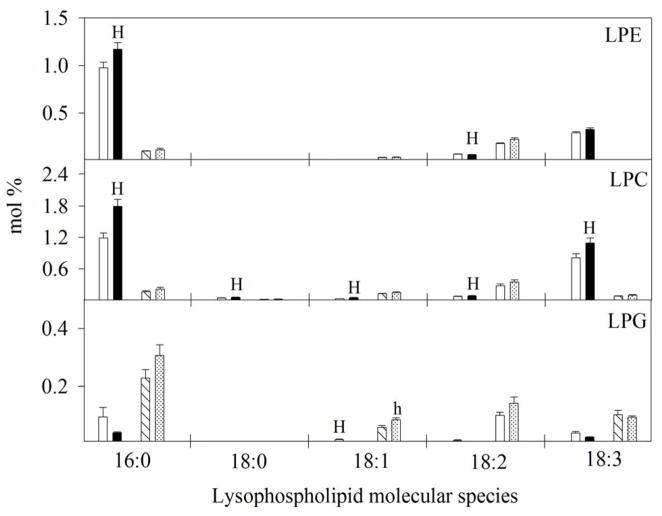
The primary effect of temperature on the cell membrane is often on the fluidity of membrane lipids followed by early accumulation of ROS for HT signalling cascades (Larkindale and Knight, 2002; Mittler et al., 2004; Naryanan et al., 2016 a & b). The current data do not reveal clear-cut changes in unsaturation that might serve to maintain lipid fluidity. Interestingly, however, the extraplastidic pollen phospholipids, such as PC, are very rich in 18:3-containing molecular species before and after HT treatment. The changes in the lipid composition of pollen and pistil caused by HT stress (Table 1; Fig. 12, 13) included significant reductions in the level a number of galactolipid (MGDG and DGDG) molecular species; galactolipids are essential for the proper functioning of plastid membranes. Both pollen and pistil also exhibited increases in some LPC and LPE molecular species under HT stress, suggesting activation of acyl hydrolases (phospholipases), with the presence of lysolipids potentially decreasing membrane integrity.
Figure 12.
Impact of temperature regimes (OT: 30/20 or HT1: 36/26 or HT2: 39/29 °C daytime maximum/nighttime minimum temperature) on phospholipid molecular species (mol %) in pollen and pistil. Each data point is the average of five independent observations. Vertical bars denote ± s.e. of means. Means followed by the same letter(s) were not significantly different (P≤0.05) as determined by LSD test. The letters ‘H’ and ‘L’ and indicate that the amount of lipid was significantly higher or lower (P≤0.05), respectively, in HT, compared with AT in pollen. Similarly, the letters ‘h’ and ‘l’ indicate that the amount of lipid was significantly higher or lower (P≤0.05), respectively, in HT, than AT in pistil. DGDG: digalactosyldiacylglycerol, MGDG: monogalactosyldiacylglycerol, PG: phosphatidylglycerol, PC: phosphatidylcholine, PE: phosphatidylethanolamine, PS: phosphatidylserine, PA: phosphatidic acid, AT: ambient temperature (outside the heat tent), and HT: high temperature (inside the heat tent).
Figure 13.
Impact of temperature regimes (OT: 30/20 or HT1: 36/26 or HT2: 39/29 °C daytime maximum/nighttime minimum temperature) on lysophospholipid molecular species (mol %) in pollen and pistil. Each data point is the average of five independent observations. Vertical bars denote ± s.e. of means. Means followed by the same letter(s) were not significantly different (P≤0.05) as determined by LSD test. The letters ‘H’ and ‘L’ and indicate whether the amount of lipid was significantly higher or lower (P≤0.05), respectively, in HT, than AT in pollen. Similarly, the letters ‘h’ and ‘l’ indicate whether the amount of lipid was significantly higher or lower (P≤0.05), respectively, in HT, than AT in the pistil. LPC: lysophosphatidylcholine, LPE: lysophosphatidylethanolamine, AT: ambient temperature (outside the heat tent) and HT: high temperature (inside the heat tent).
HT stress increased the level of ROS production and decreased the SOD, CAT, and POX enzyme activity in pollen and pistil (Figs. 9 and 10). The tapetum cells of pollen had several-fold more mitochondria that can result in higher respiration during pollen tube growth and development (Selinski and Scheibe, 2014). Under HT, an increased number of mitochondria might lead to a dramatic increase in ROS content, resulting in oxidative damage. Kumar et al. (2014) observed a dramatic increase in H2O2 content in pollen upon a short HT stress treatment (42 °C, 2 h). Similarly, Sun et al. (2005) observed that, under HT stress, the ovary undergoes abortion when levels of ROS are elevated due to decreased activity of SOD, POX, and glutathione S-transferase. It has been proposed that ROS play opposing roles. At low levels they trigger a signalling pathway that activates defence responses and, at high levels, they aggravate stress damage and PCD (Dat et al. 2000). Comparing both pollen and pistil, the increased relative sensitivity of pollen to ROS, compared to pistil, could be due to increased ROS and decreased antioxidant levels. The PCD of precocious tapetal cells under HT stress may release molecules that are deleterious to pollen maturation (Wu et al., 2000). Visualization of membrane damage and ROS accumulation in pollen and pistil under HT stress indicates that pollen had higher ROS level and membrane damage than pistil (Prasad and Djanaguiraman, 2011; Liu et al., 2016). On the basis of these data, we hypothesize that ROS detoxification enzymes in pistil under HT1 (36/26 °C) stress were sufficient to neutralize ROS and provide the directional clue to the developing pollen tube to ensure the fertilization process. In the pollen, the decreased ROS detoxification enzymes at 36/26 °C may lead to PCD. However, at HT2 (39/29 °C), pollen and pistil were both damaged.
The reciprocal (OT pistil x HT stressed pollen; and HT stressed pistil x OT pollen) crosses showed that microgametophyte fertility was affected more than megagametophyte fertility under HT stress. The susceptibility of pollen to HT stress has been previously reported in rice (Matsui et al., 2007), maize (Herrero and Johnson, 1980), and sorghum (Prasad et al., 2015). HT stress on both pollen and pistil were found to have a synergistic effect as revealed by very low seed-set percentage at the HT stressed pollen and pistil combination.
CONCLUSIONS
This research revealed that HT stress altered anatomy, decreased unsaturation index of phospholipid molecular species, decreased antioxidant enzyme activity and increased ROS content in gametes leading to lower seed-set percentage. The impact was greater in pollen than pistil at relatively lower temperatures, indicating that pollen was relatively more sensitive compared to pistil. However, the response of pollen to HT stress is genotype specific and further studies with larger numbers of genotypes are required. Additionally, better understanding of mechanisms of tolerance and the impacts of HT stress could assist in developing an efficient breeding strategy to develop HT tolerant sorghum lines and hybrids suitable for current and future climatic conditions.
Supplementary Material
Supplementary Figure S1. Data on daytime maximum/nighttime minimum temperature in growth chamber from start of booting to seed-set stage (a) 30/20 °C, (b) 36/26 °C, (c) 39/29 °C in growth chamber, (d) and (e) daytime maximum temperature outside (dotted line) the and inside (solid line) during 10 AM to 12 noon from start of booting to seed-set stage on field grown sorghum plants during 2012 and 2013, respectively in Manhattan, KS, USA.
Brief summary statement.
High temperature (HT) stress during the booting decreased both pollen and pistil functions compared with optimum temperature (OT) under controlled environments and field conditions. Non-functionality of gametes under HT stress was associated with changes in anatomy, phospholipid composition and unsaturation, increased reactive oxygen species, and decreased antioxidant enzyme activity. The various cross combinations indicate that pollen was relatively more sensitive with larger decreases in seed-set percentage than pistil under HT stress. The negative impact was greater in pollen than pistil at relatively lower temperatures.
Acknowledgments
We thank the Kansas Grain Sorghum Commission (KGSC), K-State Center for Sorghum Improvement, United States Agency for International Development, and Feed the Future Innovation Lab for Collaborative Research on Sustainable Intensification (Grant no. AID-OAA-L-14-00006) for financial support. We also thank Mary Roth at the Kansas Lipidomics Research Center in Division of Biology, Kansas State University for analyzing phospholipids in pollen and pistil. Equipment acquisition and method development at the Kansas Lipidomics Research Center were funded by the National Science Foundation (EPS 0236913, MCB 1413036, DBI 0521587, DBI 1228622), Kansas Technology Enterprise Corporation, Kansas IDeA Network of Biomedical Research Excellence (K-INBRE) of National Institutes of Health (P20GM103418), and Kansas State University. We thank Tamil Nadu Agricultural University, India, for permitting Dr. M. Djanaguiraman to conduct post-doctoral research at Kansas State University, USA. Mention of trademark or proprietary product does not constitute a guarantee or warranty of the product by Kansas State University and does not imply its approval to the exclusion of other products, which may also be suitable. Authors of this manuscript have no conflict of interest. This is contribution no. 17-267-J from the Kansas Agricultural Experiment Station.
Footnotes
AUTHOR CONTRIBUTIONS
PVVP and MD conceived, designed, carried out the experiments and drafted the manuscript. RP, SVKJ, IC and RW made substantial contributions to measurements, data interpretation and edited the manuscript.
CONFLICT OF INTEREST
The authors declare that they have no conflict of interest.
References
- Bahuguna RN, Jha J, Madan P, Shah D, Lawas ML, Khetarpal S, Jagadish SVK. Physiological and biochemical characterization of NERICA-L 44: A novel source of heat tolerance at the vegetative and reproductive stages in rice. Physiologia Plantarum. 2014 doi: 10.1111/ppl.12299. [DOI] [PubMed] [Google Scholar]
- Carlson RE. Heat stress, plant-available soil moisture, and corn yields in Iowa: a short- and long-term view. Journal of Production Agriculture. 1990;3:293–297. [Google Scholar]
- Chowdhury SI, Wardlaw IF. The effect of temperature on kernel development in cereals. Australian Journal of Agricultural Research. 1978;29:205–223. [Google Scholar]
- Dat J, Vandenabeele S, Vranova E, Montagu MV, Inze D, Breusegem FV. Dual action of the active oxygen species during plant stress responses. Cellular and Molecular Life Sciences. 2000;57:779–795. doi: 10.1007/s000180050041. [DOI] [PMC free article] [PubMed] [Google Scholar]
- Devasirvatham V, Gaur PM, Mallikarjuna N, Tokachichu RN, Trethowan RM, Tan DKY. Effect of high temperature on reproductive development of chickpea genotypes under controlled environments. Functional Plant Biology. 2012;39:1009–1018. doi: 10.1071/FP12033. [DOI] [PubMed] [Google Scholar]
- Devasirvatham V, Gaur PM, Mallikarjuna N, Raju TN, Trethowan RM, Tan DK. Reproductive biology of chickpea response to heat stress in the field is associated with the performance in controlled environments. Field Crops Research. 2013;142:9–19. [Google Scholar]
- Djanaguiraman M, Prasad PVV, Boyle DL, Schapaugh WT. Soybean pollen anatomy, viability and pod set under high temperature stress. Journal of Agronomy and Crop Science. 2013a;199:171–177. [Google Scholar]
- Djanaguiraman M, Prasad PVV, Schapaugh WT. High day- or nighttime temperature alters leaf assimilation, reproductive success, and phosphatidic acid of pollen grain in soybean [Glycine max (L.) Merr.] Crop Science. 2013b;53:1594–1604. [Google Scholar]
- Djanaguiraman M, Prasad PVV, Murugan M, Perumal M, Reddy UK. Physiological differences among sorghum (Sorghum bicolor L. Moench) genotypes under high temperature stress. Environmental and Experimental Botany. 2014;100:43–54. [Google Scholar]
- Djanaguiraman M, Perumal R, Ciampitti IA, Gupta SK, Prasad PVV. Quantifying pearl millet response to high temperature stress: thresholds, sensitive stages, genetic variability and relative sensitivity of pollen and pistil. Plant Cell and Environment. 2017 doi: 10.1111/pce.12931. [DOI] [PubMed] [Google Scholar]
- Endo M, Tsuchiya T, Hamada K, Kawamura S, Yano K, Ohshima M, Higashitani A, Watanabe M, Kawagishi-Kobayashi M. High temperatures cause male sterility in rice plants with transcriptional alterations during pollen development. Plant Cell Physiology. 2009;50:1911–1922. doi: 10.1093/pcp/pcp135. [DOI] [PubMed] [Google Scholar]
- Gupta SK, Rai KN, Singh P, Ameta VL, Gupta SK, Jayalekha AK, Mahala RS, Pareek S, Swami ML, Verma YS. Seed set variability under high temperatures during flowering period in pearl millet (Pennisetum glaucum L. (R.) Br.) Field Crop Research. 2015;171:41–53. [Google Scholar]
- Harsant J, Pavlovic L, Chiu G, Sultmanis S, Sage TL. High temperature stress and its effect on pollen development and morphological components of harvest index in the C3 model grass Brachypodium distachyon. Journal of Experimental Botany. 2013;64:2971–2983. doi: 10.1093/jxb/ert142. [DOI] [PMC free article] [PubMed] [Google Scholar]
- Hedhly A, Hormaza JI, Herrero M. The effect of temperature on pollen germination, pollen tube growth, and stigmatic receptivity in peach. Plant Biology. 2005;7:476–483. doi: 10.1055/s-2005-865850. [DOI] [PubMed] [Google Scholar]
- Hedhly A, Hormaza JI, Herrero M. Global warming and plant sexual reproduction. Trends in Plant Science. 2008;14:30–36. doi: 10.1016/j.tplants.2008.11.001. [DOI] [PubMed] [Google Scholar]
- Herrero MP, Johnson RR. High-temperature stress and pollen viability of maize. Crop Science. 1980;20:796–800. [Google Scholar]
- Herrero M. Male and female synchrony and the regulation of mating in flowering plants. Transactions of the Royal Society B: Biological Sciences. 2003;358:1019–1024. doi: 10.1098/rstb.2003.1285. [DOI] [PMC free article] [PubMed] [Google Scholar]
- Heslop-Harrison J. Pollen-stigma interaction and cross-incompatibility in the grasses. Science. 1982;215:1358–1364. doi: 10.1126/science.215.4538.1358. [DOI] [PubMed] [Google Scholar]
- Hess M, Hesse M. Ultrastructural observations on anther tapetum development of freeze-fixed Ledebouria socialis Roth (Hyacinthaceae) Planta. 1994;192:421–430. [Google Scholar]
- Higashiyama T, Kuroiwa H, Kawano S, Kuroiwa T. Guidance in-vitro of the pollen tube to the naked embryo sac of Torenia fournieri. Plant Cell. 1998;10:2019–2031. doi: 10.1105/tpc.10.12.2019. [DOI] [PMC free article] [PubMed] [Google Scholar]
- Higashiyama T, Yabe S, Sasaki N, Nishimura Y, Miyagishima S, Kuroiwa H, Kuroiwa T. Pollen tube attraction by the synergid cell. Science. 2001;293:1480–1483. doi: 10.1126/science.1062429. [DOI] [PubMed] [Google Scholar]
- Hofer T, Marzetti E, Xu J, Seo AY, Gulec S, Knutson MD, Leeuwenburgh C, Dupont-Versteegden EE. Increased iron content and RNA oxidative damage in skeletal muscle with aging and disuse atrophy. Experimental Gerontology. 2008;43:563–570. doi: 10.1016/j.exger.2008.02.007. [DOI] [PMC free article] [PubMed] [Google Scholar]
- IPCC. Climate Change 2014. In: Pachauri RK, Meyer LA, editors. Synthesis Report. Contribution of Working Groups I, II and III to the Fifth Assessment Report of the Intergovernmental Panel on Climate Change. IPCC; Geneva, Switzerland: 2014. p. 151. [Google Scholar]
- Iwahori S. High temperature injuries in tomato. IV. Development of normal flower buds and morphological abnormalities of flower buds treated with high temperature. Journal of the Japanese Society for Horticultural Science. 1965;34:33–40. [Google Scholar]
- Jagadish SVK, Craufurd PQ, Wheeler TR. High temperature stress and spikelet fertility in rice (Oryza sativa L.) Journal of Experimental Botany. 2007;58:1627–1635. doi: 10.1093/jxb/erm003. [DOI] [PubMed] [Google Scholar]
- Jain M, Prasad PVV, Boote KJ, Allen LH, Jr, Chourey PS. Effect of season-long high temperature growth conditions on sugar-to-starch metabolism in developing microspores of grain sorghum (Sorghum bicolor L. Moench) Planta. 2007;227:67–69. doi: 10.1007/s00425-007-0595-y. [DOI] [PubMed] [Google Scholar]
- Jain M, Chourey PS, Boote KJ, Allen LH., Jr Short-term high temperature growth conditions during vegetative-to-reproductive phase transition irreversibly compromise cell wall invertase-mediated sucrose catalysis and microspore meiosis in grain sorghum (Sorghum bicolor) Journal of Plant Physiology. 2010;167:578–582. doi: 10.1016/j.jplph.2009.11.007. [DOI] [PubMed] [Google Scholar]
- Jiang Y, Lahlali R, Chithra K, Saroj K, Arthur AR, Bueckert RA. Seed set, pollen morphology and pollen surface composition response to heat stress in field pea. Plant Cell & Environment. 2015;38:1365–3040. doi: 10.1111/pce.12589. [DOI] [PubMed] [Google Scholar]
- Jones P, Suggett A. The catalase-hydrogen peroxide system. Kinetics of catalatic action at high substrate concentrations. Biochemical Journal. 1968;110:617–620. doi: 10.1042/bj1100617. [DOI] [PMC free article] [PubMed] [Google Scholar]
- Kaushal N, Awasthi R, Gupta K, Gaur P, Siddique KHM, Nayyar H. Heat-stress-induced reproductive failures in chickpea (Cicer arietinum L.) are associated with impaired sucrose metabolism in leaves and anthers. Functional Plant Biology. 2013;40:1334–1349. doi: 10.1071/FP13082. [DOI] [PubMed] [Google Scholar]
- Kumar RR, Suneha G, Gadpayle KA, Singh K, Sharma SK, Singh GP, Pathak H, Rai RD. Ascorbic acid at pre-anthesis modulate the thermotolerance level of wheat (Triticum aestivum) pollen under heat stress. Journal of Plant Biochemistry and Biotechnology. 2014;23:293–306. [Google Scholar]
- Larkindale J, Knight MR. Protection against heat stress-induced oxidative damage in Arabidopsis involves calcium, abscisic acid, ethylene, and salicylic acid. Plant Physiology. 2002;128:682–695. doi: 10.1104/pp.010320. [DOI] [PMC free article] [PubMed] [Google Scholar]
- Liu YH, Offler CE, Ruan YL. Cell wall invertase promotes fruit set under heat stress by suppressing ROS-independent cell death. Plant Physiology. 2016;172:163–180. doi: 10.1104/pp.16.00959. [DOI] [PMC free article] [PubMed] [Google Scholar]
- Liu X, Williams CE, Nemacheck JA, Wang J, Subramanyam S, Zheng C, Chen MS. Reactive oxygen species are involved in plant defense against a gall midge. Plant Physiology. 2010;152:985–999. doi: 10.1104/pp.109.150656. [DOI] [PMC free article] [PubMed] [Google Scholar]
- Lobell DB, Field CB. Global scale climate-crop yield relationships and the impacts of recent warming. Environmental Research Letters. 2007;2:014002. [Google Scholar]
- Matsui T, Kobayasi K, Mayumi Y, Hasegawa T. Stability of rice pollination in the field under hot and dry conditions in the Riverina Region of New South Wales, Australia. Plant Production Science. 2007;10:57–63. [Google Scholar]
- Mittler R, Vanderauwera S, Gollery M, Van Breusegem F. Reactive oxygen gene network of plants. Trends in Plant Science. 2004;9:490–498. doi: 10.1016/j.tplants.2004.08.009. [DOI] [PubMed] [Google Scholar]
- Mou Z, Wang X, Fu Z, Dai Y, Han C, Ouyang J, Bao F, Hu Y, Li J. Silencing of phosphoethanolamine N-Methyltransferase results in temperature-sensitive male sterility and salt hypersensitivity in Arabidopsis. The Plant Cell. 2002;14:2031–2043. doi: 10.1105/tpc.001701. [DOI] [PMC free article] [PubMed] [Google Scholar]
- Narayanan S, Tamura PJ, Roth MR, Prasad PVV, Welti R. Wheat leaf lipids during heat stress. I. High day and night temperature results in major lipid alternations. Plant Cell and Environment. 2016a;39:787–803. doi: 10.1111/pce.12649. [DOI] [PMC free article] [PubMed] [Google Scholar]
- Narayanan S, Prasad PVV, Welti R. Wheat leaf lipids during heat stress. II. Lipid experiencing coordinated metabolism are detected by analysis or lipid co-occurrence. Plant Cell and Environment. 2016b;39:608–617. doi: 10.1111/pce.12648. [DOI] [PMC free article] [PubMed] [Google Scholar]
- Nguyen TC, Singh V, van Oosterom EJ, Chapman SC, Jordan DR, Hammer GL. Genetic variability in high temperature effects on seed-set in sorghum. Functional Plant Biology. 2013;40:439–448. doi: 10.1071/FP12264. [DOI] [PubMed] [Google Scholar]
- Parish RW, Phan HA, Iacuone S, Li SF. Tapetal development and abiotic stress: a centre of vulnerability. Functional Plant Biology. 2012;39:553–559. doi: 10.1071/FP12090. [DOI] [PubMed] [Google Scholar]
- Polowick PL, Sawhney VK. High temperature induced male and female sterility in canola (Brassica napus L.) Annals of Botany. 1988;62:83–86. [Google Scholar]
- Pradhan GP, Prasad PVV, Fritz AK, Kirkham MB, Gill BS. High temperature tolerance in Aegilops species and its potential transfer to wheat. Crop Science. 2012;52:292–304. [Google Scholar]
- Prasad PVV, Bheemanahalli R, Jagadish SVK. Field crops and the fear or heat stress – opportunities, challenges and future directions. Field Crops Research. 2017;200:114–121. [Google Scholar]
- Prasad PVV, Boote KJ, Allen LH., Jr Adverse high temperature effects on pollen viability, seed-set, seed yield and harvest index of grain-sorghum [Sorghum bicolor (L.) Moench] are more severe at elevated carbon dioxide due to high tissue temperature. Agricultural and Forest Meteorology. 2006;139:237–251. [Google Scholar]
- Prasad PVV, Pisipati SR, Mutava RN, Tuinstra MR. Sensitivity of grain sorghum to high temperature stress during reproductive development. Crop Science. 2008;48:1911–1917. [Google Scholar]
- Prasad PVV, Djanaguiraman M. High night temperature decreases leaf photosynthesis and pollen function in grain sorghum. Functional Plant Biology. 2011;38:993–1003. doi: 10.1071/FP11035. [DOI] [PubMed] [Google Scholar]
- Prasad PVV, Djanaguiraman M. Response of floret fertility and individual grain weight of wheat to high temperature stress: sensitive stages and thresholds for temperature and duration. Functional Plant Biology. 2014;41:1261–1269. doi: 10.1071/FP14061. [DOI] [PubMed] [Google Scholar]
- Prasad PVV, Djanaguiraman M, Perumal R, Ciampitti IA. Impact of high temperature stress on floret fertility and individual grain weight of grain sorghum: sensitive stages and thresholds for temperature and duration. Frontiers in Plant Science. 2015;6:820. doi: 10.3389/fpls.2015.00820. [DOI] [PMC free article] [PubMed] [Google Scholar]
- Rotman N, Rozier F, Boavida L, Dumas C, Berger F, Faure JE. Female control of male gamete delivery during fertilization in Arabidopsis thaliana. Current Biology. 2003;13:432–436. doi: 10.1016/s0960-9822(03)00093-9. [DOI] [PubMed] [Google Scholar]
- Saini HS, Aspinall D. Abnormal sporogenesis in wheat (Triticum aestivum L.) induced by short periods of high temperature. Annals of Botany. 1982;49:835–846. [Google Scholar]
- Saini HS, Sedgley M, Aspinall D. Effect of heat stress during floral development on pollen tube growth and ovary anatomy in Wheat (Triticum aestivum L.) Australian Journal of Plant Physiology. 1983;10:137–144. [Google Scholar]
- SAS Institute. SAS users guide. Version 9.1. SAS Institute; Cary, NC: 2003. [Google Scholar]
- Sebastiani M, Giordano C, Nediani C, Travaglini C, Borchi E, Zani M, Feccia M, Mancini M, Petrozza V, Cossarizza A, Gallo P, Taylor RW, d’Amati G. Induction of mitochondrial biogenesis is a maladaptive mechanism in mitochondrial cardiomyopathies. Journal of American College of Cardiology. 2007;50:1362–1369. doi: 10.1016/j.jacc.2007.06.035. [DOI] [PubMed] [Google Scholar]
- Selinski J, Scheibe R. Pollen tube growth: where does the energy come from? Plant Signaling & Behavior. 2014;9:e977200. doi: 10.4161/15592324.2014.977200. [DOI] [PMC free article] [PubMed] [Google Scholar]
- Shin R, Berg RH, Schachtman DP. Reactive oxygen species and root hairs in Arabidopsis root response to nitrogen, phosphorus and potassium deficiency. Plant Cell Physiology. 2005;46:1350–1357. doi: 10.1093/pcp/pci145. [DOI] [PubMed] [Google Scholar]
- Singh P, Nedumaran S, Traore PCS, Boote KJ, Rattunde HFW, Prasad PVV, Singh NP, Srinivas K, Bantilana MCS. Quantifying potential benefits of drought and heat tolerance in rainy season sorghum for adapting to climate change. Agricultural and Forest Meteorology. 2014;185:37–48. [Google Scholar]
- Singh V, Nguyen TC, van Oosterom EJ, Chapman SC, Jordan DR, Hammer GL. Sorghum genotypes differ in high temperature responses for seed set. Field Crops Research. 2015;171:32–40. [Google Scholar]
- Snider JL, Oosterhuis DM, Kawakami EM. Diurnal pollen tube growth rate is slowed by high temperature in field-grown Gossypium hirsutum pistils. Journal of Plant Physiology. 2011;168:441–448. doi: 10.1016/j.jplph.2010.08.003. [DOI] [PubMed] [Google Scholar]
- Sun K, Hunt K, Hauser BA. Ovule abortion in Arabidopsis triggered by stress. Plant Physiology. 2004;135:2358–2367. doi: 10.1104/pp.104.043091. [DOI] [PMC free article] [PubMed] [Google Scholar]
- Sun K, Cui Y, Hauser BA. Environmental stress alters genes expression and induces ovule abortion: reactive oxygen species appear as ovules commit to abort. Planta. 2005;222:632–642. doi: 10.1007/s00425-005-0010-5. [DOI] [PubMed] [Google Scholar]
- Sunoj VS, Somayananda IM, Chiluwal A, Perumal R, Prasad PVV, Jagdish SVK. Resilience of pollen and post-flowering response in diverse sorghum genotypes exposed to heat stress under field conditions. Crop Science. 2017;57:1658–1669. [Google Scholar]
- Suzuki K, Takeda H, Tsukaguchi T, Egawa Y. Ultra structural study of degeneration of tapetum in anther of snap bean (Phaseolus vulgaris L.) under heat-stress. Sexual Plant Reproduction. 2001;13:293–299. [Google Scholar]
- Swanson R, Edlund AF, Preuss D. Species specificity in pollen–pistil interactions. Annual Review of Genetics. 2004;38:793–818. doi: 10.1146/annurev.genet.38.072902.092356. [DOI] [PubMed] [Google Scholar]
- Taylor ML, Cooper RL, Schneider EL, Osborn JM. Pollen structure and development in Nymphaeales: Insights into character evolution in an ancient angiosperm lineage. American Journal of Botany. 2015;102:1685–1702. doi: 10.3732/ajb.1500249. [DOI] [PubMed] [Google Scholar]
- Vanderlip RL, Reeves HE. Growth stages of sorghum [Sorghum bicolor (L.) Moench] Agronomy Journal. 1972;64:13–16. [Google Scholar]
- Wolters-Arts M, Lush WM, Mariani C. Lipids are required for directional pollen tube growth. Nature. 1998;392:818–821. doi: 10.1038/33929. [DOI] [PubMed] [Google Scholar]
- Wu H, Cheung AY. Programmed cell death in plant reproduction. Plant Molecular Biology. 2000;44:267–281. doi: 10.1023/a:1026536324081. [DOI] [PubMed] [Google Scholar]
- Xiao S, Gao W, Chen QF, Chan SW, Zheng SX, Ma J, Wang M, Welti R, Chye ML. Overexpression of Arabidopsis acyl-CoA binding protein ACBP3 promotes starvation-induced and age-dependent leaf senescence. Plant Cell. 2010;22:1463–1482. doi: 10.1105/tpc.110.075333. [DOI] [PMC free article] [PubMed] [Google Scholar]
- Ye C, Fatima AT, Argayoso AM, Marcelino AL, Koh H, Redona ED, Jagadish SVK, Gregorio GB. Identifying and confirming quantitative trait loci associated with heat tolerance at flowering stage in different rice populations. BMC Genetics. 2015;16:41. doi: 10.1186/s12863-015-0199-7. [DOI] [PMC free article] [PubMed] [Google Scholar]
Associated Data
This section collects any data citations, data availability statements, or supplementary materials included in this article.
Supplementary Materials
Supplementary Figure S1. Data on daytime maximum/nighttime minimum temperature in growth chamber from start of booting to seed-set stage (a) 30/20 °C, (b) 36/26 °C, (c) 39/29 °C in growth chamber, (d) and (e) daytime maximum temperature outside (dotted line) the and inside (solid line) during 10 AM to 12 noon from start of booting to seed-set stage on field grown sorghum plants during 2012 and 2013, respectively in Manhattan, KS, USA.


