

Abstract
The present study was undertaken to study the effect of ammonia, urea, non-esterified fatty acid (NEFA), and β-hydroxybutyric acid (β-OHB) on oocyte development and granulosa cell (GC) growth parameter of ovine (Ovis aries). Ovine oocytes were matured in vitro in the presence of different concentration of ammonia, urea, NEFA, and β-OHB for 24 h, in vitro inseminated and evaluated for cleavage and blastocyst yield. Same concentrations of ammonia, urea, NEFA, and β-OHB were examined on growth parameters and hormone secretion activity of granulosa cells in vitro. Real-time reverse transcription polymerase chain reaction was used to evaluate the expression of steroidogenic genes (steroidogenic cytochrome P-450 (CYP11A1, CYP19A1)), cell proliferation-related genes (GDF9, FSHr), and apoptosis-related genes (BCL-2 and BAX). The maturation, cleavage, and blastocyst production rates were significantly lowered in media containing either 200 μM ammonia or 5 mM urea or high combo NEFA or 1 μM β-OHB. Exposure of granulosa cell to 400 μM ammonia or 1 μM β-OHB or very high combo or 6 mM urea significantly decreased all the parameters examined compared to lower levels of all nutritional and metabolic stressors. Elevated concentration of metabolic stressors induced GC apoptosis through the BAX/BCL-2 pathway and reduced the steroidogenic gene messenger RNA (mRNA) expression and cell proliferation gene mRNA expression. These results suggested that the decreased function of GCs may cause ovarian dysfunction and offered an improved understanding of the molecular mechanism responsible for the low fertility in metabolic stressed condition.
Electronic supplementary material
The online version of this article (10.1007/s12192-017-0846-1) contains supplementary material, which is available to authorized users.
Keywords: Metabolic stressors, Oocyte, Granulosa cells, Embryo, Hormone
Introduction
Decline in fertility was considered as a multifactorial problem which included unbalanced feeding behavior and post- and pre-parturient durations. The most possible mechanisms of reduced fertility associated with negative energy balance (NEB) in ruminants might be because of (a) low LH pulse frequency, (b) reduced circulating concentrations of insulin and IGF-, (c) reduced production of estradiol by ovarian follicles during NEB, and (d) possible deleterious effects of the metabolites like non-esterified fatty acid (NEFA) and β-hydroxybutyric acid (β-OHB), together with low circulating glucose concentrations on oocyte development (Leroy et al. 2005, 2006; Vanholder et al. 2005). Imbalanced feeding (high-protein diet with less soluble sugar) also reported to cause the changes in metabolite profiles of follicular (Nandi et al. 2015; Farman et al. 2015a) and oviductal and uterine fluids (Tripathi et al. 2016a). High-protein diet also led to high systemic concentrations of ammonia and urea and these had been associated with reduced fertility in ruminants (Sinclair et al. 2000a; Kenny et al. 2002; Nandi et al. 2015). Similarly, accumulation of NEFA derived from the adipose tissue during negative energy balance in the follicle fluid also constrained the proliferation and health of the granulosa cells (GCs) and thus jeopardized oocyte development (Vanholder et al. 2005). The early embryonic losses might result from a malfunctioned cytoplasm, which impaired further development of the fertilized oocyte. At the time of NEB, systemic concentration of palmitic, stearic, and oleic acid in circulation was high (Rukkwamsuk et al. 2000). In high-producing animals, NEB was related to changes in serum concentration of NEFA and these changes were well reflected in follicular fluid of follicles (Leroy et al. 2004b). In vitro studies had demonstrated the differences in the tolerance of the somatic cells to different fatty acids, saturated fatty acids being toxic, and unsaturated fatty acids being relatively harmless (Aardema et al. 2011). We observed that oleic, palmitic, and stearic acids were the three predominant free fatty acids in both serum and follicular fluid in our laboratory (Nandi et al. 2013). We had earlier demonstrated using an ovine model that elevated stearic acid concentrations during oocyte maturation had a negative impact on embryo quality (Farman et al. 2015b).
Cholesterol, triglycerides, total NEFA, β-OHB, ammonia, and urea above the physiological concentrations had been considered as nutritional and metabolic stressors of serum and follicular fluids (Nandi et al. 2013; Farman et al. 2015a). To the best of our knowledge, it has never been examined how the developmental competence of the oocyte and granulosa cell functions are affected by exposure to normal and elevated concentrations of ammonia, urea, NEFA, and β-OHB concentrations in vitro. We hypothesized that elevated concentrations of ammonia, urea, NEFA, and β-OHB concentrations might impair oocyte developmental fitness and granulosa cell functions. Hence, the aim of this present study was to investigate the effects of exposure to elevated concentrations of ammonia, urea, NEFA, and β-OHB concentrations on oocyte development maturation, cleavage and blastocyst yield, reactive oxygen species (ROS), and cell number in blastocysts as well as on granulosa cell functions (the metabolic activity, viability rates, ROS, cell number increment, monolayer formation score, apoptosis, global effect of metabolic stress on gene expression of GCs, estrogen, and progesterone secretion).
Materials and methods
All chemicals are from Sigma Chemicals, MO, USA, unless otherwise mentioned. The plastic wares were from Tarsons, Kolkata, India. The colorimetric kit for total ROS production estimation was purchased from Cell Biolabs Inc. (San Diego, CA, USA).
Experimental designs
The concentrations of ammonia, urea, free fatty acids, and β-OHB used in present study were based on results of in vivo (Farman et al. 2015a, b; Nandi et al. 2015) and in vitro studies (Tripathi et al. 2015; Tripathi et al. 2016b) conducted earlier in our laboratory. Two experiments were set up to characterize the developmental capacity and growth parameters of oocytes and granulosa cells exposed with normal and elevated concentration of ammonia, urea, NEFA, and β-OHB.
In the first experiment, ovine oocytes were cultured at 38.5 °C with 5% CO2 in air in the presence of ammonia (0, 100, 150, 200, 250, 300, and 400 μM), urea (0, 4, 4.25, 4.5, 5, 5.5, and 6 mM), NEFA (control: no NEFA; basal NEFA (70 μM), medium combo (140 μM), high combo (210 μM), very high combo (280 μM)), and β-OHB (0, 0.5, 0.75, and 1.0 μM) in oocyte maturation medium for 24 h. The viability and maturation rates were examined. The matured oocytes were in vitro inseminated and cleavage rates and blastocyst yield were examined.
In the second experiment, the granulosa cells were exposed with different concentrations of ammonia (0,100, 150, 200, 250, 300, and 400 μM), urea (0, 4, 4.25, 4.5, 5, 5.5, and 6 mM), NEFA (control, basal NEFA, medium combo NEFA, high combo NEFA, and very high combo NEFA), and β-OHB (0, 0.5, 0.75, and 1.0 μM). The metabolic activity (MTT oxidation, both at day 0 and day 2), viability rates (at day 2), apoptosis, cell number increment, monolayer formation score, and estrogen and progesterone secretion were examined. Both the experiments were replicated for 20 times. Our each trail for oocytes studies represented one replicate per treatment with 8 to 10 oocytes per plot and our each trail for granulosa cell studies represented one replicate per treatment with plot (treatment/replicate) and consisted of 1.0 × 10⁵ GCs per culture drop.
In vitro embryo production
We had used ovaries of adult, non-pregnant, parous ewes (Bennur breed, 2.5 to 3 years of age) in good health and with normal reproductive tracts on macroscopic examination after slaughter for this study. Ovine ovaries were brought to laboratory within 1 h of slaughter and transported immediately to the laboratory (Nandi et al. 2016). Oocytes were aspirated from surface follicles; those with more than four layers of compact cumulus cells and with a granular homogenous ooplasm were chosen for our study. The control oocyte maturation medium consisted of TCM-199 + fetal bovine serum (10%) + follicle-stimulating hormone ovine (10 μg/ml) + gentamicin (50 μg/ml). Oocytes were cultured in 35-mm Petri dishes in a CO2 incubator (38.5 °C, 5% CO2 in air, 90–95% relative humidity) for 24 h. Oocytes with an expanded cumulus cell mass to at least two diameters away from the zona pellucida and with an extruded first polar body in the perivitelline space were considered as matured and used for IVF. The viability of the cells after culture was determined by the trypan blue exclusion test. For processing of sperm to be used for IVF, semen obtained from the ram (2.5 to 3 years of age) testes by electro-ejaculation method was centrifuged with Brackett and Oliphant medium for 6 min at 300g twice. The sperm concentration was adjusted to 2 million concentrations per milliliter (2 × 10⁶/ml) before inseminating the oocytes. The processed semen was kept in 5% CO2 incubator at 38.5 °C for 5 to 10 min for swim-up. All the oocytes were in vitro inseminated. After 40 to 42 h of inseminating the oocytes, the presumptive zygotes were evaluated under a stereo zoom microscope at ×110 magnification for evidence of cleavage. Results were recorded in terms of cleavage rate (percentage of oocytes inseminated and that were cleaved to two-cell stage). The cleaved embryos were further cultured in TCM-199 + fetal bovine serum (10%) + gentamicin (50 μg/ml) in 35-mm Petri dishes in a CO2 incubator (38.5 °C, 5% CO2 in air, 90–95% relative humidity) for 7 days for the production of morulae and/or blastocysts. Blastocysts obtained after 7 days of culture were collected and subjected to a differential staining protocol for embryos (Thouas et al. 2001) for counting of cells.
Granulosa cell culture
The granulosa cell isolation and processing and evaluation of growth parameters were as described earlier (Nandi et al. 2016) with some modifications. In the earlier study, we collected follicular fluid for granulosa cell isolation from different size class follicles whereas in the present study, the follicular fluid was aspirated from all the surface follicles of ovaries. The cumulus–oocyte complexes were picked up and the remaining fluid containing granulosa cells was suspended in TCM-199 supplemented with 0.3% BSA, centrifuged at 2500 rpm for 5 min at 4 °C. The cells were then washed for two times in washing medium (TCM-199 + 0.3% BSA), then the final pellet of granulosa cells was suspended in the medium in which they were to be cultured. The control granulosa cell culture medium consisted of TCM-199 + HEPES (20 mM) + L-glutamine (3 mM) + bovine serum albumin (1%) + insulin-transferrin-selenium (1%) + gentamicin (50 mg/ml). The granulosa cells (0.8–1 × 10⁵/droplet) were cultured for 2 days harvested and counted in an automated cell counter (Invitrogen Countess™ Automated Cell Counter). The viability of the cells after culture was determined by the trypan blue exclusion test (Nandi et al. 2016). The apoptosis of the granulosa cells was evaluated by hematoxylin-eosin stain as described earlier (Jolly et al. 1997). Apoptotic cells were defined as cells with nuclei containing condensed chromatin that either was marginated into sharply delineated, densely staining masses aligned with the nuclear membrane, was shrunken into a single regularly shaped, dense, homogeneously staining mass (pyknotic appearance), or was fragmented into multiple homogeneously and densely staining masses (multiple fragments) clustered together (Jolly et al. 1997). In another experiment, the granulosa cells (0.8–1 × 10⁵/droplet) were cultured in a 100-μl droplet of culture medium. The cells were cultured for 5 days; media were refreshed once on day 2 of culture. The monolayer formation in granulosa cells was evaluated for 5 day and scored as per Nandi et al. (2016). The MTT (3-[4,5-dimethylthiazol-2-yl]-2,5-diphenyltetrazolium bromide) assays of the cells were measured as per Rooke et al. (2004). Release of estradiol and progesterone in culture media of granulosa cells on day 5 was examined by enzyme-linked immunosorbent assay using kits (Diagnostics Biochemicals Pvt. Inc., Ontario, Canada) (Nandi et al. 2015). Progesterone measurements were recorded in nanogram per milliliter and picogram per milliliter for estrogen concentrations. All measurements were carried out according to the manufacturer’s instructions. The intra- and inter-assay coefficients of variation for all analyses were below 5%.
Determination of ROS
The determination of ROS in matured oocyte and granulosa cells was as described earlier (Waiz et al. 2016). For measuring the concentration of ROS produced, oocytes (n = 20 in each treatment) and granulosa cells (1 × 10⁵ in each treatment) were sonicated over ice. H2O2 concentration within the matured oocyte and granulosa cell was measured as per the manufacturer’s protocol. The relative concentration of H2O2 produced was measured calorimetrically at 540 nm.
Gene expression studies
Based on the results of effects of metabolic stressors on GC proliferations and functions, the levels of metabolic stressors which caused the significant effect were selected for gene expression studies along with the basal/control level.
RNA isolation
Total RNA was extracted from the granulosa cells using High pure RNA isolation kit (Roche, Germany), according to the manufacturer description. The absorbance values at 260 and 280 nm were checked to assess the RNA concentration and purity for protein impurities in the samples.
Real-time reverse transcription polymerase chain reaction
Total RNA was extracted from control and metabolic stressor-treated granulosa cells as described above and the total RNA was reverse transcribed using a reverse transcription level kit (iScript cDNA synthesis kit, California, USA,) according to the manufacturer protocols. The expression levels were checked for six genes (CYP19A1, CYP17A1, BAX, BCL2, GDF9, and FSHr). The glyceraldehyde-3-phosphate dehydrogenase gene was used as the endogenous control. Primers (Table 1) were designed using NCBI and Primer Blast software (Ye et al. 2012) and are shown in Table 1. RT-PCR was performed with KAPA SYBR FAST qPCR Master Mix (2×) (Kapa Biosystems, United States Wilmington, Massachusetts). The reaction solution was prepared on ice and comprised. Each run was performed in duplicate in a 10-μl reaction that contains 5 μl qPCR master mix, 5 pM of gene-specific forward and reverse primers, 1 μl of cDNA as template, and final volume of 10 μl was made up with nuclease-free water. The PCR conditions used to amplify all genes were initial denaturation at 95 °C for 3 min with 40 cycles of denaturation at 95 °C for 3 s followed by annealing and extension at 60 °C for 30 s. All reactions were performed in triplicate. The gene expression levels in the normal and heat-treated GCs were analyzed with the 2−ΔΔCT method.
Table 1.
List of primers used
| Gene name | Primer sequence (5′–3′) | GenBank accession no. |
|---|---|---|
| BAX | F-CTTTCTTCATCGGGGATTCA R-TGGAGTGGCTCCTGATCTCT |
XM_015100640.1 |
| BCL2 | F-GTGGACAGCATCGCCCTG R-CACAAAGGCGTCCCAGCC |
XM_012103831.1 |
| CYP19A1 | F-GCTTTTGGAAGTGCTGAACC R-CTGGGACCTGGTATTGAGGA |
NM_001123000.1 |
| CYP11A1 | F-TTGCTCACTCAGTCCACACC R-TTCACCCGTTTATTGCCTTC |
NM_001093789.1 |
| GDF9 | F-CTTTGCCTGGCTCTGTTTTC R-TCCCACCTAAATGGTTCAGC |
NM_001142888.2 |
| FSHr | F-ATGGCCTTGTTCCTGGTGG R-CAAACCTCAGTTCGACCGC |
NM_001009289.1 |
| GAPDH | F-GGGTCATCATCTCTGCACCT R-GGTCATAAGTCCCTCCACGA |
NM_001190390.1 |
Statistical analysis
Linear regression analysis was used to examine the relationship between the control and treated groups. The control was considered the reference group, and the replicate was used as a variable in the analysis. Natural log transformations were performed on individual observations before statistical analysis. Linear regression applied to in nutritional and metabolic stressor concentrations versus in parameter examined produced a good fit. Data were analyzed statistically by regression analysis or by standard one-way ANOVA followed by the Tukey–Kramer honest significant difference test. The percentage values were arcsine square root transformed before analysis. The computer-assisted statistical software package (GraphPad Prism, San Diego, CA, USA) was used for analyzing the data. Significance or non-significance of differences between mean values was determined at the 5% level of significance (P < 0.05).
Results
Effect of ammonia on in vitro maturation, viability, cleavage, rate, and blastocyst yield of ovine oocyte
The effect of different concentrations of ammonia on in vitro maturation, viability, cleavage, and blastocyst formation on ovine oocytes is presented in Table 2 and Plate 1. Exposure of oocytes to 150 μM concentration of ammonia in oocyte maturation medium significantly decreased maturation and cleavage rate compared to those observed in oocytes culture in media containing 0 μM (control) or 100 μM concentration of ammonia. Though no significant change was observed between 150 and 200 μM treatment groups, when the ammonia level was increased to 250 and 300 μM, it caused significant decrease in maturation, viability, and cleavage rates compared to those observed in lower ammonia concentration treatment groups. Further increase of ammonia concentration to 400 μM decreased the maturation, viability, and cleavage rates. Blastocyst yield was significantly decreased in 200 μM group compared to lower concentration testaments. No blastocyst was produced in medium containing 400 μM ammonia. The total number of cells was significantly decreased in blastocysts derived from oocytes matured in media containing 250 μM compared to those derived from oocytes matured in media containing lower levels. We observed a significantly higher increase in the production of ROS in 200 to 400 μM ammonia treatment groups compared to control.
Table 2.
Effect of ammonia on oocyte development in vitro
| Treatments (ammonia, μM) |
Maturation rate (%) |
ROS (μM) |
Viability rate (%) |
Cleavage rate (%) |
Blastocyst yield (%) | Total no. of cells in blastocysts (mean ± SEM) |
|---|---|---|---|---|---|---|
| 0-control | 84.6 ± 0.71a | 13.2 ± 0.25a | 98.6 ± 1.81a | 56.05 ± 1.0a | 26.8 ± 0.73a | 92.3 ± 4.3a |
| 100 | 78.5 ± 0.72a | 13.9 ± 1.3a | 95.6 ± 0.59a | 52.2 ± 0.75a | 28.25 ± 0.51a | 95.6 ± 6.2a |
| 150 | 66.0 ± 0.53b | 14.2 ± 0.5a | 85.2 ± 0.49b | 40.4 ± 0.44b | 20.5 ± 0.47a | 90.4 ± 5.6a |
| 200 | 64.0 ± 0.74b | 17.2 ± 2.2b | 81.6 ± 0.54b | 41.5 ± 0.45b | 17.2 ± 0.23b | 84.3 ± 5.3a |
| 250 | 60.4 ± 0.41b | 20.1 ± 4.3b | 71.7 ± 0.61c | 31.7 ± 0.55c | 12.0 ± 0.28c | 70.1 ± 4.4b |
| 300 | 53.6 ± 0.72c | 44.9 ± 2.7c | 70.8 ± 0.44c | 29.3 ± 0.46c | 4.0 ± 0.1d | 68.6 ± 3.4b |
| 400 | 41.2 ± 0.55d | 58.5 ± 3.4d | 60.9 ± 0.64d | 10.0 ± 0.2d | 0 ± 0.0e | – |
Superscripts bearing different letters in the same column differ significantly (P ˂ 0.05)
Values are mean ± standard error of the mean based on 20 replicates per treatment with 8 to 10 oocytes per plot
ROS reactive oxygen species
Plate 1.
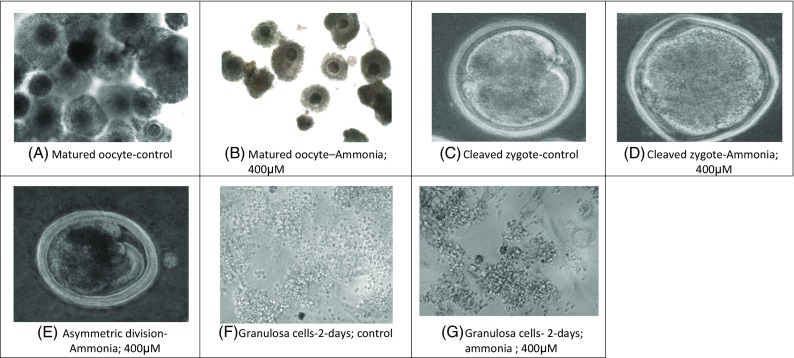
Oocyte/embryos/granulosa cells in control medium and under exposure with ammonia 400 μM
Effect of urea on in vitro maturation, viability, cleavage, rate, and blastocyst yield of ovine oocyte
The effect of different concentrations of urea on in vitro maturation, viability, cleavage, and blastocyst formation on ovine oocytes is presented in Table 3. Exposure of oocytes to the highest concentration tested (6.0 mM) of urea in oocyte maturation medium significantly decreased maturation and viability rates compared to those observed in oocytes cultured in media containing 0 (control group), 4 and 4.25, 4.5, 5.0, and 5.5 mM of urea. Cleavage rates and blastocyst yield were significantly decreased at 5.5 mM level compared to lower levels. No change of total cell numbers in blastocysts derived from oocytes matured in media containing the different levels of urea was observed. We observed a significantly higher increase in the production of ROS in 6 mM urea treatment groups compared to other lower levels and control group.
Table 3.
Effect of urea on oocyte development in vitro
| Treatments (urea, mM) |
Maturation rate (%) |
ROS (μM) |
Viability rate (%) |
Cleavage rate (%) |
Blastocyst yield (%) | Total no. of cells in blastocysts (mean ± SEM) |
|---|---|---|---|---|---|---|
| 0-control | 87.5 ± 0.44a | 12.2 ± 1.25a | 96.6 ± 0.49a | 56.5 ± 0.43a | 28.4 ± 0.49a | 94.6 ± 4.4a |
| 4 | 87.25 ± 0.47a | 16.2 ± 2.3a | 95.0 ± 0.52a | 54.6 ± 0.48a | 26.5 ± 0.51a | 93.2 ± 5.2a |
| 4.25 | 84.3 ± 0.58a | 19.6 ± 2.5a | 93.1 ± 0.65a | 53.1 ± 0.5a | 25.5 ± 0.47a | 92.5 ± 3.8a |
| 4.5 | 83.5 ± 0.47a | 22.4 ± 4.2a | 90.4 ± 0.58a | 48.0 ± 0.52a | 24.0 ± 0.43a | 82.3 ± 5.1a |
| 5 | 82.9 ± 0.50a | 25.1 ± 3.3a | 88.6 ± 0.44a | 47.8 ± 0.59a | 22.8 ± 0.40a | 80.4 ± 5.4a |
| 5.5 | 78.3 ± 0.41a | 25.9 ± 4.7a | 84.4 ± 0.45a | 41.5 ± 0.45b | 18.8 ± 0.40b | 80.4 ± 4.2a |
| 6 | 66.1 ± 0.47b | 38.8 ± 1.4b | 67.3 ± 0.41b | 33.3 ± 0.30c | 12.3 ± 0.29c | 78.6 ± 5.4a |
Superscripts bearing different letters in the same column differ significantly (P ˂ 0.05)
Values are mean ± standard error of the mean based on 20 replicates per treatment with 8 to 10 oocytes per plot
ROS reactive oxygen species
Effect of NEFA on in vitro maturation, viability, cleavage rate, and blastocyst formation of ovine oocytes
The effect of different concentration of NEFA on in vitro maturation, viability, cleavage, and blastocyst formation on ovine oocytes is presented in Table 4. Exposure of oocytes to high combo NEFA in oocyte maturation medium significantly decreased maturation, viability, cleavage, blastocyst production rates, and total number of cells in blastocyst rates compared to those observed in oocytes cultured in media containing control, basal, and medium combo NEFA. Further increase of NEFA concentration in very high combo group significantly decreased the parameter tested. We observed a significantly higher increase in the production of ROS in high combo NEFA treatment groups compared to other lower levels and control group.
Table 4.
Effect of NEFA on oocyte development in vitro
| Treatments (NEFA) |
Maturation rate (%) |
ROS (μM) |
Viability rate (%) |
Cleavage rate (%) |
Blastocyst yield (%) | Total no. of cells in blastocysts (mean ± SEM) |
|---|---|---|---|---|---|---|
| 0-control | 86.0 ± 0.41a | 11.84 ± 2.5a | 95.6 ± 0.33a | 56.1 ± 0.41a | 27.1 ± 0.37a | 96.8 ± 4.8a |
| Basal NEFA | 85.7 ± 1.1a | 12.4 ± 2.2a | 94.9 ± 0.31a | 54.2 ± 0.32a | 25.9 ± 0.23a | 90.6 ± 5.6a |
| Medium combo | 76.8 ± 0.33a | 15.1 ± 3.3a | 90.1 ± 0.30a | 50.2 ± 0.31a | 22.5 ± 0.26a | 86.3 ± 4.4a |
| High combo | 65.3 ± 0.27b | 25.9 ± 4.7b | 80.3 ± 0.58b | 45.3 ± 0.35b | 12.5 ± 0.27b | 72.4 ± 5.32b |
| Very high combo | 54.1 ± 0.34b | 32.8 ± 1.4b | 72.2 ± 0.33c | 32.0 ± 0.26c | 6.1 ± 0.14c | 60.3 ± 4.4c |
Superscripts bearing different letters in the same column differ significantly (P ˂ 0.05)
Values are mean ± standard error of the mean based on 20 replicates per treatment with 8 to 10 oocytes per plot
ROS reactive oxygen species
Effect of β-OHB on in vitro maturation, viability, cleavage rate, and blastocyst formation of ovine oocytes
The effect of different concentration of β-OHB on in vitro maturation, viability, cleavage, and blastocyst formation on ovine oocytes is presented in Table 5. Significant decrease was observed in maturation, viability and cleavage rates, and blastocyst yields when oocytes were exposed to 1.0 μM of β-OHB compared to lower doses. The total number of cells was significantly decreased in blastocysts derived from oocytes matured in 0.75 μM β-OHB compared to those matured in lower doses (0 and 0.50 μM). We observed a significantly higher increase in the production of ROS in 1-μM treatment groups compared to other lower levels and control group.
Table 5.
Effect of β-OHB on oocyte development in vitro
| Concentration (β-OHB, μM) | Maturation rate (%) | ROS (μM) | Viability rate (%) | Cleavage rate (%) | Blastocyst yield (%) | Total no. of cells in blastocysts (mean ± SEM) |
|---|---|---|---|---|---|---|
| 0-control | 88.0 ± 0.27a | 9.4 ± 2.2a | 92.1 ± 0.19a | 54.7 ± 0.46a | 24.6 ± 0.19a | 93.6 ± 4.5a |
| 0.50 | 85.2 ± 0.28a | 11.1 ± 2.3a | 92.0 ± 0.54a | 54. ± 0.66a | 24.8 ± 0.31a | 87.3 ± 5.8a |
| 0.75 | 76.9 ± 0.30a | 15.9 ± 4.7a | 87.7 ± 0.58a | 52.8 ± 0.59a | 22.6 ± 0.38a | 72.1 ± 4.6b |
| 1.0 | 60.2 ± 0.36b | 23.8 ± 3.4b | 70.8 ± 0.74b | 40.2 ± 0.26b | 16.2 ± 0.23b | 72.4 ± 6.4b |
Superscripts bearing different letters in the same column differ significantly (P ˂ 0.05)
Values are mean ± standard error of the mean based on 20 replicates per treatment with 8 to 10 oocytes per plot
ROS reactive oxygen species
Effect of different concentrations of ammonia on granulosa cell growth and hormone production
The effect of ammonia on granulosa cell growth, viability apoptosis, and hormone production is presented in Table 6. The metabolic activity (MTT oxidation), viability rates, cell number increment, monolayer formation score, and estrogen and progesterone secretion were significantly decreased in granulosa cells cultured in media containing 250 μM ammonia compared to lower level tested. The apoptosis of granulosa cell was significantly higher when cultured in media containing 150 μM ammonia. Exposure of granulosa cells with 400 μM ammonia significantly decreased all the parameters tested compared to the lower levels. We observed a significantly higher increase in the production of ROS from 250 μM and higher level (300 and 400 μM) ammonia treatment groups compared to other lower levels and control groups.
Table 6.
Effect of ammonia on granulosa cell growth; viability and hormone production in vitro
| Treatment (ammonia, μM) | Metabolic activity of GCs, absorbance units (AU)/105 cells 2-day culture | Viability of GCs (%) 2-day culture | Cell no. increment (×105) 2-day culture | Monolayer formation score 5-day culture | ROS (μM) | Apoptosis (%) 5-day culture | Estrogen (pg/ml) 5-day culture |
Progesterone (ng/ml) 5-day culture |
|---|---|---|---|---|---|---|---|---|
| 0-control | 0.142 ± 0.10a | 76.2 ± 0.52a | 1.59 ± 0.06a | 1.95 ± 0.11a | 9.85 ± 0.05a | 11.4 ± 2.1a | 55.4 ± 1.6a | 466.1 ± 13.4a |
| 100 | 0.136 ± 0.14a | 68.4 ± 0.64a | 1.20 ± 0.01a | 1.90 ± 0.14a | 10.21 ± 0.10a | 10.7 ± 1.4a | 48.2 ± 1.9a | 446.3 ± 9.6a |
| 150 | 0.121 ± 0.10a | 66.1 ± 0.68a | 1.17 ± 0.02a | 1.75 ± 0.09a | 11.21 ± 2.1a | 19.2 ± 1.6b | 47.6 ± 1.3a | 446.6 ± 8.6a |
| 200 | 0.120 ± 0.11a | 63.3 ± 0.37a | 1.0 ± 0.03a | 1.60 ± 0.1a | 11.94 ± 2.43a | 20.5 ± 1.5b | 45.5 ± 1.2a | 421.7 ± 6.3a |
| 250 | 0.104 ± 0.14b | 50.7 ± 0.48b | 0.75 ± 0.06b | 1.25 ± 0.09b | 13.58 ± 0.04b | 22.4 ± 1.7b | 35.1 ± 2.1b | 389.9 ± 11.6b |
| 300 | 0.101 ± 0.15b | 44.4 ± 1.31c | 0.70 ± 0.11b | 1.15 ± 0.08b | 17.51 ± 0.29b | 28.6 ± 1.9c | 33.6 ± 1.9b | 381.4 ± 10.6b |
| 400 | 0.72 ± 0.11c | 35.5 ± 0.75c | 0.33 ± 0.01c | 1.05 ± 0.05c | 27.43 ± 4.13c | 29.7 ± 1.7c | 20.1 ± 1.7c | 284.6 ± 14.6c |
Superscripts bearing different letters in the same column differ significantly (P ˂ 0.05)
Values are mean ± standard error of the mean based on 20 replicates per treatment with plot (treatment/replicate) and consisted of 1.0 × 10⁵ GCs per culture drop
AUs absorbance units, ROS reactive oxygen species
Effect of different concentrations of urea on granulosa cell growth
The effect of urea on granulosa cell growth, viability apoptosis, and hormone production is presented in Table 7. No significant difference was observed in the metabolic activity (MTT oxidation), viability rates, cell number increment, and monolayer formation score in granulosa cells exposed with 0, 4, 4.25, 4.5, 5.5, and 6 mM urea. The apoptosis was significantly increased and hormone production was significantly decreased in granulosa cell exposed with 6 mM urea compared with lower levels tested. We observed a significantly higher increase in the production of ROS from 5.5 mM and higher level urea treatment groups compared to other lower levels and control group.
Table 7.
Effect of urea on granulosa cell growth; viability and hormone production in vitro
| Treatment (urea mM) | Metabolic activity of GCs, absorbance units (AU)/105 cells 2-day culture | Viability of GCs (%) 2-day culture |
Cell no. increment (×105) 2-day culture | Monolayer formation score 5-day culture | ROS (μM) |
Apoptosis (%) 5-day culture |
Estrogen (pg/ml) 5-day culture |
Progesterone (ng/ml) 5-day culture |
|---|---|---|---|---|---|---|---|---|
| 0-control | 0.144 ± 0.13a | 76.7 ± 0.55a | 1.27 ± 0.01a | 1.77 ± 0.15a | 10.4 ± 3.4a | 11.3 ± 2.4a | 50.4 ± 1.4a | 449.3 ± 11.4a |
| 4 | 0.142 ± 0.7a | 75.2 ± 0.89a | 1.25 ± 0.07a | 1.72 ± 0.16a | 11.2 ± 1.5a | 14.1 ± 3.6a | 48.4 ± 1.0a | 444.6 ± 8.4a |
| 4.25 | 0.143 ± 0.14a | 76.6 ± 0.66a | 1.24 ± 0.04a | 1.64 ± 0.13a | 12.13 ± 2.8a | 14.6 ± 2.4a | 48.6 ± 2.1a | 446.4 ± 6.6a |
| 4.5 | 0.144 ± 0.18a | 74.8 ± 0.22a | 1.18 ± 0.01a | 1.62 ± 0.10a | 14.5 ± 3.05a | 15.1 ± 1.9a | 50.9 ± 1.1a | 436.3 ± 9.6a |
| 5 | 0.138 ± 0.12a | 72.0 ± 0.58a | 1.17 ± 0.01a | 1.67 ± 0.13a | 16.4 ± 0.75b | 14.8 ± 2.1a | 48.1 ± 2.6b | 440.2 ± 13.6a |
| 5.5 | 0.142 ± 0.14a | 74.3 ± 1.01a | 1.14 ± 0.01a | 1.62 ± 0.09a | 16.83 ± 2.5b | 15.6 ± 0.9b | 46.3 ± 1.6b | 428.3 ± 7.6a |
| 6 | 0.149 ± 0.16a | 72.4 ± 0.62a | 1.16 ± 0.03a | 1.63 ± 0.13a | 17.95 ± 1.53c | 17.1 ± 2.0b | 48.1 ± 1.8c | 401.3 ± 12.6b |
Superscripts bearing different letters in the same column differ significantly (P ˂ 0.05)
Values are mean ± standard error of the mean based on 20 replicates per treatment with plot (treatment/replicate) and consisted of 1.0 × 10⁵ GCs per culture drop
AUs absorbance units, ROS reactive oxygen species
Effect of different concentrations of NEFA on granulosa cell growth
The effect of NEFA on granulosa cell growth, viability apoptosis, and hormone production is presented in Table 8. Similar trends were observed as noticed in the result of effect of NEFA on oocyte growth. We observed a significantly higher increase in the production of ROS from medium and high NEFA treatment groups compared to other lower levels and control group.
Table 8.
Effect of NEFA on granulosa cell growth; viability and hormone production in vitro
| Treatment (NEFA) | Metabolic activity of GCs, absorbance units (AU)/105 cells 2-day culture | Viability of GCs (%) 2-day culture |
Cell no. increment (×105) 2-day culture |
Monolayer formation score 5-day culture |
ROS (μM) |
Apoptosis (%) 5-day culture |
Estrogen (pg/ml) 5-day culture |
Progesterone (ng/ml) 5-day culture |
|---|---|---|---|---|---|---|---|---|
| 0-control | 0.146 ± 2.1a | 74.6 ± 1.2a | 1.29 ± 0.3a | 1.70 ± 0.19a | 12.9 ± 0.4a | 15.3 ± 1.2a | 55.9 ± 2.2a | 482.6 ± 2.6a |
| Basal | 0.143 ± 1.3a | 74.3 ± 0.37a | 1.26 ± 0.6a | 1.75 ± 04a | 13.4 ± 2.1a | 14.6 ± 1.5a | 50.1 ± 1.9a | 476.1 ± 1.8a |
| Medium combo | 0.136 ± 1.6a | 72.25 ± 0.58a | 1.71 ± 0.11a | 1.75 ± 0.14a | 19.04 ± 0.8b | 14.7 ± 1.8a | 48.2 ± 3.6a | 470.1 ± 1.5a |
| High combo | 0.101 ± 2.3b | 60.1 ± 0.44b | 0.90 ± 0.04b | 1.66 ± 0.1a | 23.2 ± 0.05c | 20.4 ± 2.5b | 32.1 ± 1.4b | 400.4 ± 2.0b |
| Very high combo | 0.63 ± 0.2c | 44.5 ± 0.41c | 0.47 ± 0.03c | 1.42 ± 0.1b | 26.4 ± 1.35d | 29.6 ± 3.2c | 26.2 ± 2.3c | 389.6 ± 2.4b |
Superscripts bearing different letters in the same column differ significantly (P ˂ 0.05)
Values are mean ± standard error of the mean based on 20 replicates per treatment with plot (treatment/replicate) and consisted of 1.0 × 10⁵ GCs per culture drop
AUs absorbance units, ROS reactive oxygen species
Effect of different concentrations of β-OHB on granulosa cell growth
The effect of β-OHB on granulosa cell growth, viability apoptosis, and hormone production is presented in Table 9. The viability and cell number increment were significantly decreased in granulosa cell exposed with 0.75 μM β-OHB compared to the lower levels. Exposure of granulosa cell to 1 μM β-OHB significantly decreased all the parameters examined compared to lower levels. We observed a significantly higher increase in the production of ROS from 0.75 μM β-OHB treatment groups compared to other lower levels and control group.
Table 9.
Effect of β-OHB on granulosa cell growth, viability, and hormone production in vitro
| Treatment (β-OHB, μM) | Metabolic activity of GCs, absorbance units (AU)/105 cells 2-day culture | Viability of GCs (%) 2-day culture |
Cell no. increment (×105) 2-day culture | Monolayer formation score 5-day culture | ROS (μM) |
Apoptosis (%) 5-day culture |
Estrogen (pg/ml) 5-day culture |
Progesterone (ng/ml) 5-day culture |
|---|---|---|---|---|---|---|---|---|
| 0-control | 0.143 ± 2.2a | 74.1 ± 0.45a | 1.29 ± 0.03a | 1.75 ± 0.14a | 14.2 ± 2.8a | 14.3 ± 1.4a | 56.4 ± 0.7a | 442.6 ± 1.1a |
| 0.5 | 0.138 ± 1.3a | 71.2 ± 0.39a | 1.25 ± 0.04a | 1.70 ± 0.12a | 15.5 ± 1.9a | 11.4 ± 1.0a | 51.1 ± 2.6a | 446.3 ± 2.2a |
| 0.75 | 0.136 ± 0.9a | 60.2 ± 0.33b | 1.18 ± 0.05a | 1.75 ± 0.14a | 23.14 ± 3.2b | 15.4 ± 2.5a | 44.6 ± 3.2a | 431.6 ± 1.5a |
| 1.0 | 0.96 ± 1.2b | 40.0 ± 0.26c | 0.73 ± 0.03b | 1.35 ± 0.13b | 26.8 ± 2.5b | 20.1 ± 0.1b | 42.8 ± 2.9a | 420.4 ± 0.9a |
Superscripts bearing different letters in the same column differ significantly (P ˂ 0.05)
Values are mean ± standard error of the mean based on 20 replicates per treatment with plot (treatment/replicate) and consisted of 1.0 × 10⁵ GCs per culture drop
AUs absorbance units, ROS reactive oxygen species
Relative mRNA amounts of cell growth, steroid synthesis, and apoptosis-related genes
The effects of metabolic stressors on granulosa cell relative amounts of cell growth, steroid synthesis, and apoptosis genes are presented in Figs. 1, 2, and 3. Expression of GDF9 and FSHr mRNA was significantly lower (P < 0.05) in granulosa cell treated with 250 μM ammonia, 1 μM β-OHB, and high NEFA concentration compared to those treated with the basal level of metabolic stressors (ammonia, urea, NEFA, and β-OHB). In addition, no effect of urea was observed on GDF9 and FSHr mRNA expression. Expressions of CYP11A1 and CYP19A1 mRNA were less (P < 0.05) in granulosa cell treated with 250 μM ammonia, 6 mM urea, 1 μM β-OHB, and high NEFA concentration compared with basal level of metabolic stressors (ammonia, urea, NEFA, and β-OHB). BAX and BCL-2 were significantly increased (P < 0.05) in metabolic stressor-treated granulosa cells compared to the basal level.
Fig. 1.
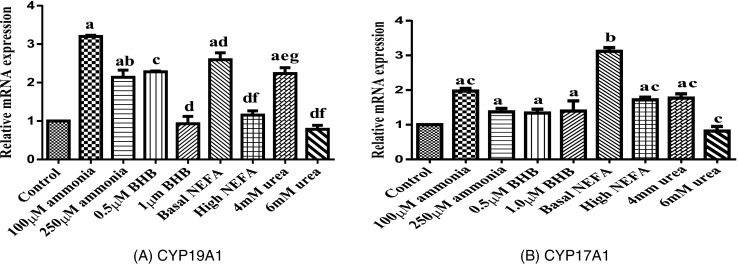
Effect of metabolic stressors on transcript abundance of genes involved in steroidogenesis (bars with different superscripts are significantly different between treatments with P < 0.05). a CYP19A1. b CYP17A1
Fig. 2.
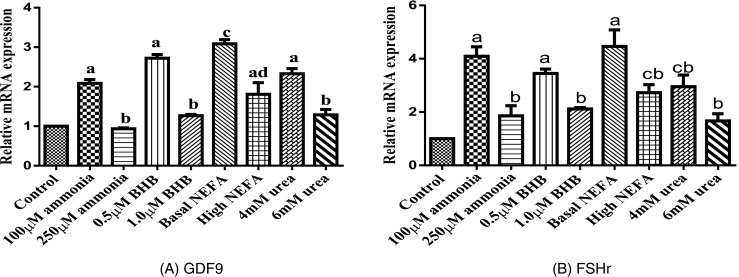
Effect of metabolic stressors on transcript abundance of genes involved in granulosa cell proliferation (bars with different superscripts are significantly different between treatments with P < 0.05). a GDF9. b FSHr
Fig. 3.

Effect of metabolic stressors on transcript abundance of genes involved in apoptosis (bars with different superscripts are significantly different between treatments with P < 0.05). a BAX. b BCL2. c BAX:BCl2
Discussion
We demonstrated in the present study that elevated metabolites impaired the oocyte development and granulosa cell growth and functions in vitro. We had earlier reported that the mean follicular fluid ammonia, urea, NEFA, and β-OHB levels were 132 vs 157 μM, 4.0 vs 6.0 mM, 78.0 vs 99.0 μM, and 0.5 vs 0.72 mM, respectively, in post parturient and high ammonia-generating diet scenario (metabolically stressed ewes), respectively (Farman et al. 2015a; Nandi et al. 2016). The ammonia level ranged from 94 to 412 μM, urea level from 3 to 8.6 mM, NEFA ranged from 68 to 256 μM, and β-OHB 0.42 to 9.4 mM in metabolic stressed ewes. (Farman et al. 2015a) We also reported that the mean basal NEFA level in ewe follicular fluid was 70.4 μM, and the oleic, palmitic acid, and stearic acids were the three predominant free fatty acids in and the average relative presences of these NEFAs were 40, 25, and 15%, respectively (Nandi et al. 2013). Thus, the levels of nutritional and metabolic stressors used in the present study were within the physiological ranges.
During NEB (metabolic stressed condition), reduced reproduction in domestic species had long been a problem and there was evidence that elevated metabolic stressor concentrations played a key role in this process because of alteration in the biochemical composition of the follicular microenvironment (Leroy et al. 2005; Valckx et al. 2014; Nandi et al. 2016). Changes in metabolite concentration in serum were reflected in follicular (Leroy et al. 2004a, b; Farman et al. 2015a) and reproductive tract fluids (Tripathi et al. 2016a) in which oocyte maturation, fertilization, and embryo development occurred. Elevated NEFA concentration in serum during NEB is considered as one of the major factors responsible for metabolic imbalances, cellular dysfunction, and allied pathologies (Van Hoeck et al. 2011). Elevated ammonia concentration was also reported to alter in vitro growth and metabolism of cumulus and finally maturation of oocyte was impaired (Rooke et al. 2004; Yuan and Krisher 2010). In present study, elevated concentration of ammonia, i.e., 150 μM, significantly decreased the maturation rate, viability rate, and cleavage rate while ROS, blastocyst yield, and total cell nos. significantly reduced in 200 and 250 μM, respectively. However in GCs, 250 μM significantly reduced growth parameters (metabolic activity, viability, cell number increment, monolayer formation, apoptosis rate) and hormone (progesterone, estrogen) secretion activity of granulosa cells while ROS was significantly higher in case of same levels. Hence, decreased oocyte maturation caused by ammonium in the present study might not only be due to direct effects on the oocyte, but also indirect effects on the nursing granulosa cells as described earlier (Yuan and Krisher 2010). We observed the increased apoptosis in granulosa cells as the ammonia concentration increased. In an earlier study in our laboratory, we observed low metabolic activity and more apoptosis rate in granulosa cells in ovaries of ewes fed with high-protein diet and with high follicular fluid ammonia concentration compared to control (Nandi et al. 2015). We had also demonstrated that ammonia effects on oocytes and granulosa cells were follicle size specific (Nandi et al. 2016). Moreover, our result (effect of ammonia on functions of GC collected from surface follicles) was comparable with that reported earlier (effect of ammonia on functions of GC collected from medium-sized follicles, Nandi et al. 2016). This was because we noticed that the medium-sized follicles contribute most of the total follicular fluid in IVF system of domestic animal models. It was reported that the main consequence of exposure of granulosa cell to elevated concentration of ammonia was low growth rate because of high demand of ATP for maintaining cell pH in association with elevated mitochondrial dehydrogenase activity (MTT) and biosynthesis of steroid led to increased activity of microsomal enzymes such as cytochrome P450 aromatase (Rooke et al. 2004). Our results also supported the fact that in vitro growth and metabolism of granulosa cells were altered by change in concentrations of ammonia within the physiological limits that were measured in follicular fluid. Our results were in agreement to an earlier report wherein it was reported that granulosa cell apoptosis reduced the steroidogenic gene messenger RNA (mRNA) expression and estrogen synthesis (Li et al. 2016).
Adverse effect of urea on oocyte maturation was reported earlier (Bystriansky et al. 2012). Low nuclear maturation and reduced fertilization and cleavage rates in oocytes that matured in the presence of 6 mM urea were reported (De Wit et al. 2001; Ocon and Hansen 2003) which was in agreement with our finding. Cleavage rate and blastocyst yield were significantly decreased in 5.5 mM urea while total cell no. in blastocyst did not get significant changes in any level tested compared with control.. However in GCs, ROS production was significantly higher in 6-mM level, apoptosis and estrogen production significantly at 5.5 mM, while progesterone at 6 mM. Other parameters (metabolic activity, viability, cell number increment, and monolayer formation) did not produce any significant changes. Most likely, mechanism for retarded maturation and reduced fertilization might be because urea could impair metaphase II probably by inhibiting polymerization of tubulin into microtubules (De Wit et al. 2001; Ocon and Hansen 2003). The harmful effect of urea on oocytes and granulosa cells might in the present study also be caused by the initiation of oxidative stress as described earlier (Zhang et al. 2004).
Elevated NEFA concentrations could also directly affect in vitro preimplantation embryo development (Leroy et al. 2010; Van Hoeck et al. 2014). High combo NEFA significantly decreased the maturation rate, viability rate and cleavage rate, blastocyst yield and total cell numbers, increased the ROS production. However in GCs, higher combo NEFA significantly reduced the growth parameters (metabolic activity, viability, cell number increment, apoptosis rate) and hormone (progesterone; estrogen) secretion activity of granulosa cells, while ROS production was significantly higher in case of medium combo NEFA level. High NEFAs at the time of oocyte maturation increased oocyte NEFA uptake and metabolism which had been coupled with inferior oocyte maturation, increased oxidative stress, and impaired developmental competence of the oocyte as well as an altered physiology and metabolism of the resultant embryo as evidenced in the present study as well as in an earlier study (Valckx et al. 2014). Similarly, we demonstrated that oocyte development competence was significantly reduced in oocyte originating from NEFA-exposed follicles (Nandi et al. 2017) which was in agreement with the finding of an earlier work (Valckx et al. 2014). It was reported that NEFA delayed the oocyte development through meiosis, lower successive fertilization, cleavage, and blastocyst yield during in vitro culture under normal conditions without causing a degeneration of oocyte (Jorritsma et al. 2004). An earlier study revealed that addition of diverse concentrations of NEFA such as stearic, palmitic, and oleic acids to the in vitro maturation medium reduced oocyte maturation rates, with negative effects on subsequent embryo development (Marei et al. 2010). These negative effects on oocyte quality were reported to be because of changes in the structure of the mitochondrial membrane and the endoplasmic reticulum (Alves et al. 2015). Farman et al. (2015b) reported that the maturation, cleavage, and morulae/blastocyst production rates were impaired in media with 20 μM stearic acid. Increment of stearic acid to 30 μM in media further reduced the maturation, cleavage, and morulae/blastocyst production. Similarly, Tripathi et al. (2015) reported that the ratio of saturated and unsaturated fatty acid in follicular fluid affects the developmental competence of the oocyte.
Ketone bodies were a vital part of ruminant intermediary metabolism and they provided a major form of energy to peripheral tissue, when the glucose concentrations were low because of increasing production in ruminants (Leroy et al. 2006). According to the finding of Leroy et al. (2006), addition of β-OHB in the maturation medium with low glucose concentration did not recover the reduced cleavage and blastocyst formation; the most possible mechanism behind this was that cumulus–oocyte cell complex was not able to utilize β-OHB as an unconventional source of energy (Leroy et al. 2006). It was also reported that supplementation of the culture medium with β-OHB did not affect the rate of oocyte maturation but did cause a concentration-dependent reduction in the frequency of fertilized oocytes that developed to the blastocyst stage (Sarentonglaga et al. 2013). In contrast, we observed that β-OHB impaired the oocyte development and granulosa cell growth and functions in the range of 0.75 to 1 μM levels in the media.
In the ovary, GCs are responsible for establishing the follicular microenvironment; any factors that impair GCs may disrupt oocytes (Li et al. 2016). So, we hypothesized that metabolic stress may induce the change of gene expression, finally leading to disordered ovarian function. Our data suggested that metabolic stressors like ammonia, urea, NEFA, and β-OHB inhibited GCs proliferation, induced GCs apoptosis, decreased E2 and P4 secretion, and reduced the steroid-related gene mRNA expression. The reduction in steroid secretion and mRNA expression of CYP11A1 and CYP19A1 might also play a role in metabolic stress-induced GCs apoptosis and ovarian injury (Yenuganti et al. 2016). We analyzed key genes involved in steroidogenesis such as CYP11A1 and CYP19A1 to determine effects of metabolic stressors on granulosa cell function. Our data showed that metabolic stressors decreased the expression of these genes. FSH activated the transcription of genes involved in the cascade of steroidogenesis, cholesterol side-chain cleavage enzyme encoded by CYP11A1, and by the 3 beta-hydroxyl steroid dehydrogenase transcribed from CYP19A1, encoding aromatase, the key enzyme of estrogen synthesis (Ke et al. 2004). The exposure of granulosa cells with metabolic stressors significantly reduced the expression of CYP11A1 and CYP19A1 which were in support with the finding of Yenuganti et al. (2016). Accordingly, the levels of progesterone and 17-beta-estradiol found in granulosa cell-conditioned media (except β-OHB) were also lowered compared with the control. Very likely, the reduced production of progesterone and particularly of 17-beta-estradiol might be due to the reduced transcription of CYP11A1 and CYP19A1. In present study, we found significant downregulation of GDF-9 and FShr in GCs treated with metabolic stressors. Downregulation of GDF-9 was linked with hampered cholesterol biosynthesis pathway. Cholesterol synthesized by granulosa cells transported to oocytes get benefit by this “outsourcing” of cholesterol biosynthesis by being protected from potentially harmful catabolic stress, which seemed to be an evolutionarily conserved strategy in most animal species. This cooperative activity in cholesterol metabolism might be essential for the healthy status of both oocytes and granulosa cells, leading to a coordinated development of follicular cells (Nakamura et al. 2015).
Deficiency of estradiol may cause granulosa cell apoptosis (Shimizu et al. 2005). Thus, we put forward that apoptosis-related genes might be expressed in metabolic stressor-treated GCs. We confirmed the expression levels of BCL-2 and BAX mRNAs in granulosa cells by qPCR. Our findings indicated that the mRNA expression levels of anti-apoptotic gene (BCL-2) and pro-apoptotic gene (BAX) were increased compared to basal levels; moreover, ratio of BAX:BCL2 mRNA was higher in higher level. The ratio between BAX:BCL2 gene transcript decided the destiny of the cells and thereby considered as a good indicator of assessing the degree of apoptosis (Gunaretnam et al. 2013). Granulosa cells were reported to be susceptible to apoptosis at the transition from G1 to S phase. Estrogen stimulated transition from G1 to S phase and protected against apoptosis only when cell cycle progression was unperturbed (Quirk et al. 2006). Experiments identifying specific cell cycle stage (G/M/S) phase to identify where the abnormalities occur with each stress agent merit further investigations.
In stressed conditions, ROS could be formed which were toxic and harmful to the development of the oocyte (Marei et al. 2012). In addition to this, ROS hampered endoplasmic reticulum function which could cause impaired cumulus expansion, increased cumulus cell apoptosis, and impaired oocyte nuclear maturation, fertilization, and blastocyst development rates (Aardema et al. 2011). Decreased development and functions of oocytes and granulosa cells in media containing metabolic stressors (elevated concentrations of ammonia, urea, NEFA, and β-OHB) in the present study could be attributed to high levels of ROS production.
FoxO (Forkhead O), a subfamily of transcription factors, including FoxO1, FoxO3, FoxO4, and FoxO6, directs various cell capacities, for example, separation, multiplication, metabolism, survival, and demise. As a key individual from this family, FoxO1 played a basic controller part in ordinary advancement of ovarian follicles. Recent studies have confirmed that FoxO1 played an imperative part in the direction of cell passing caused by oxidative anxiety (Shen et al. 2012; Zhang et al. 2016). FoxO1 directed Bim mRNA articulation by binding to its promoter in oxidative anxiety-prompted apoptosis (Tang et al. 2011). Besides, FoxO1 instigated cell apoptosis by means of adjusting Puma articulation in oxidative anxiety-initiated GCs (Liu et al. 2015). According to Weng et al. (2016), oxidative stress enhanced the expression of FoxO1 in the nucleus and promoted its translocation to the nucleus in GCs. These results suggested that oxidative stress-induced FoxO1 nuclear import, resulting in GCs apoptosis. Shen et al. (2012) reported that the FoxO1 articulation was drastically up-controlled under oxidative stressed conditions and this oxidative anxiety initiated cell apoptosis. The present study speculates the role of FoxO1 in the mechanism associated with oxidative anxiety-prompted apoptosis in GC under metabolic stress.
Maternal metabolic disorders were known to compromise the success rates of human in vitro fertilization procedures (Van hoeck et al. 2014). Also in animals, maternal metabolic status seemed to be a determinant for oocyte and embryo quality. With the increase in the rates of human obesity and type II diabetes, there is a high chance that metabolically compromised individual produced oocytes with a severely impaired competence to support normal embryo development. Our study contributes to the identification of the mechanisms and factors involved in reduced fertility due to metabolic and nutritional stress in ruminants. Additional investigation is needed to explore the mechanistic details for understanding how metabolic stressors like ammonia, NEFA, β-OHB, and urea effects on granulosa cells, oocytes, embryo growth and functions. Further research with the design of an in vivo follow-up experiment merits is under investigation.
Conclusions
In conclusion, our data showed that nutritional and metabolic stressors could negatively affect fertility through reduction in oocyte developmental competence and granulosa cell growth and secretory activities as well as the changes in the transcriptome of the metabolic stressor-treated granulosa cells. Indications of disturbance in gene networks involved in follicle development can be suggested. Our present results also showed that metabolic stress can induce apoptosis of GCs as evidenced by the activation of BAX/BCL-2 ratio and inhibited the estrogen synthesis.
Electronic supplementary material
(XLSX 47 kb)
Acknowledgements
We are grateful to the Director, NIANP, Bangalore, for providing the necessary facility to carry out the research work. We also like to thank to Mr. Gyan Prakash for his technical assistance. Financial help from the Department of Biotechnology, Government of India (Grant number BT/PR7131/AAQ/1/526/2012), is gratefully acknowledged.
Compliance with ethical standards
Conflict of interest
The authors declare that they have no conflict of interest.
Footnotes
Electronic supplementary material
The online version of this article (10.1007/s12192-017-0846-1) contains supplementary material, which is available to authorized users.
References
- Aardema H, Peter LAM, Vos FL, Bernard AJ, Roelen HM, Knijn AB, Vaandrager JB, Bart MG. Oleic acid prevents detrimental effects of saturated fatty acids on bovine oocyte developmental competence. Biol Reprod. 2011;85:62–69. doi: 10.1095/biolreprod.110.088815. [DOI] [PubMed] [Google Scholar]
- Alves JPM, Bertolini M, Bertolini LR, Silva CMG, Rondina D. Lipotoxicity: impact on oocyte quality and reproductive efficiency in mammals. Animal Reprod. 2015;12:291–297. [Google Scholar]
- Bystriansky J, Burkuš J, Juhás S, Fabian D, Juraj K. Effect of increased urea levels on mouse preimplantation embryos developed in vivo and in vitro. Bull Vete Inst Pulawy. 2012;56:211–216. [Google Scholar]
- De Wit AA, Cesar ML, Kruip TA. Effect of urea during in vitro maturation on nuclear maturation and embryo development of bovine cumulus-oocyte-complexes. J Dairy Sci. 2001;84:1800–1804. doi: 10.3168/jds.S0022-0302(01)74618-8. [DOI] [PubMed] [Google Scholar]
- Farman M, Tripathi SK, Nandi S, Girish Kumar V. Follicular fluid concentrations of metabolic stressors in normal, obese, metabolic stressed and emaciated ewes. Asian J Anim Sci. 2015;9:466–470. doi: 10.3923/ajas.2015.466.470. [DOI] [Google Scholar]
- Farman M, Nandi S, Girish KV, Tripathi SK, Gupta PSP. Effect of stearic acid on in-vitro formation of sheep oocytes. Indian J Anim Sci. 2015;85:584–587. [Google Scholar]
- Gunaretnam I, Pretheeban T, Rajamahendran R. Effects of ammonia and urea in vitro on mRNA of candidate bovine endometrial genes. Anim Reprod Sci. 2013;141:42–51. doi: 10.1016/j.anireprosci.2013.07.001. [DOI] [PubMed] [Google Scholar]
- Jolly PD, Smith PR, Heath DA, Hudson NL, Lun S, Still LA, Watts CH, McNatty KP. Morphological evidence of apoptosis and the prevalence of apoptotic versus mitotic cells in the membrana granulosa of ovarian follicles during spontaneous and induced atresia in ewes. Biol Reprod. 1997;56:837–846. doi: 10.1095/biolreprod56.4.837. [DOI] [PubMed] [Google Scholar]
- Jorritsma R, Cesar ML, Hermans JT, Kruitwagen CL, Vos PL, Kruip TA. Effects of non-esterified fatty acids on bovine granulosa cells and developmental potential of oocytes in vitro. Anim Reprod Sci. 2004;81:225–235. doi: 10.1016/j.anireprosci.2003.10.005. [DOI] [PubMed] [Google Scholar]
- Ke FC, Chuang LC, Lee MT, Chen YJ, Lin SW, Wang PS, Stocco DM, Hwang JJ. The modulatory role of transforming growth factor beta1 and androstenedione on follicle-stimulating hormone-induced gelatinase secretion and steroidogenesis in rat granulosa cells. Biol Reprod. 2004;70:1292–1298. doi: 10.1095/biolreprod.103.023531. [DOI] [PubMed] [Google Scholar]
- Kenny DA, Humpherson PG, Leese HJ, Morris DG, Tomos AD, Diskin MG, Sreenan JM. Effect of elevated systemic concentrations of ammonia and urea on the metabolite and ionic composition of oviductal fluid in cattle. Biol Reprod. 2002;66:1797–1804. doi: 10.1095/biolreprod66.6.1797. [DOI] [PubMed] [Google Scholar]
- Leroy JL, Vanholder T, Delanghe JR, Opsomer G, Van Soom A, Bols PE, de Kruif A. Metabolite and ionic composition of follicular fluid from different-sized follicles and their relationship to serum concentrations in dairy cows. Anim Reprod Sci. 2004;80:201–211. doi: 10.1016/S0378-4320(03)00173-8. [DOI] [PubMed] [Google Scholar]
- Leroy JL, Vanholder T, Delanghe JR, Opsomer G, Van Soom A, Bols PE, Dewulf J, de Kruif A. Metabolic changes in follicular fluid of the dominant follicle in high-yielding dairy cows early post partum. Theriogenology. 2004;62:1131–1143. doi: 10.1016/j.theriogenology.2003.12.017. [DOI] [PubMed] [Google Scholar]
- Leroy JL, Vanholder T, Mateusen B, Christophe A, Opsomer G, de Kruif A, Genicot G, Van Soom A. Non-esterified fatty acids in follicular fluid of dairy cows and their effect on developmental capacity of bovine oocytes in vitro. Reprod. 2005;130:485–495. doi: 10.1530/rep.1.00735. [DOI] [PubMed] [Google Scholar]
- Leroy JL, Vanholder T, Opsomer G, Van Soom A, de Kruif A. The in vitro development of bovine oocytes after maturation in glucose and beta-hydroxybutyrate concentrations associated with negative energy balance in dairy cows. Reprod Domest Anim. 2006;41:119–123. doi: 10.1111/j.1439-0531.2006.00650.x. [DOI] [PubMed] [Google Scholar]
- Leroy JL, Van Hoeck V, Clemente M, Rizos D, Gutierrez-Adan A, Van Soom A, Uytterhoeven M, Bols PE. The effect of nutritionally induced hyperlipidaemia on in vitro bovine embryo quality. Hum Reprod. 2010;25:768–778. doi: 10.1093/humrep/dep420. [DOI] [PubMed] [Google Scholar]
- Li L, Wu J, Luo M, Sun Y, Wang G. The effect of heat stress on gene expression, synthesis of steroids, and apoptosis in bovine granulosa cells. Cell Stress and Chaperones. 2016;21(3):467–475. doi: 10.1007/s12192-016-0673-9. [DOI] [PMC free article] [PubMed] [Google Scholar]
- Liu ZQ, Shen M, Wu WJ, Li BJ, Weng QN, Li M, Liu HL. Expression of PUMA in follicular granulosa cells regulated by FoxO1 activation during oxidative stress. Reprod Sci. 2015;22:696–705. doi: 10.1177/1933719114556483. [DOI] [PMC free article] [PubMed] [Google Scholar]
- Marei WF, Wathes DC, Fouladi-Nashta AA. Impact of linoleic acid on bovine oocyte maturation and embryo development. Reprod. 2010;139:979–988. doi: 10.1530/REP-09-0503. [DOI] [PubMed] [Google Scholar]
- Marei WF, Wathes DC, Fouladi-Nashta AA. Differential effects of linoleic and alpha-linolenic fatty acids on spatial and temporal mitochondrial distribution and activity in bovine oocytes. Reprod Fertil Dev. 2012;24:679–690. doi: 10.1071/RD11204. [DOI] [PubMed] [Google Scholar]
- Nakamura T, Iwase A, Bayasula B, Nagatomo Y, Kondo M, Nakahara T, Takikawa S, Goto M, Kotani T, Kiyono T, Kikkawa F (2015) CYP51A1 Induced by growth differentiation factor 9 and follicle-stimulating hormone in granulosa cells is a possible predictor for unfertilization. Reprod Sci 22:377–384. 10.1177/1933719114529375 [DOI] [PMC free article] [PubMed]
- Nandi S, Shree USP, Kumar GV. Metabolic stressors in ovine and caprine sera and ovarian follicular fluid. Appl Cell Biol. 2013;2:110–113. [Google Scholar]
- Nandi S, Mondal S, Pal DT, Gupta PSP. Effect of ammonia-generating diet on ovine serum and follicular fluid ammonia and urea levels, serum oestrogen and progesterone concentrations and granulosa cell functions. J Anim Physiol Anim Nutr. 2015;100:309–315. doi: 10.1111/jpn.12369. [DOI] [PubMed] [Google Scholar]
- Nandi S, Gupta PSP, Mondal S. Ammonia concentrations in different size classes of ovarian follicles of sheep (Ovis aries): Possible mechanisms of accumulation and its effect on oocyte and granulosa cell growth in vitro. Theriogenology. 2016;85:678–687. doi: 10.1016/j.theriogenology.2015.10.007. [DOI] [PubMed] [Google Scholar]
- Nandi S, Tripathi SK, Gupta PSP, Mondal S (2017) Effect of metabolic stressors on survival and growth of in vitro cultured ovine preantral follicles and enclosed oocytes. Theriogenology 104:80–86 [DOI] [PubMed]
- Ocon OM, Hansen PJ. Disruption of bovine oocytes and preimplantation embryos by urea and acidic pH. J Dairy Sci. 2003;86:1194–1200. doi: 10.3168/jds.S0022-0302(03)73703-5. [DOI] [PubMed] [Google Scholar]
- Quirk SM, Cowan RG, Harman RM. The susceptibility of granulosa cells to apoptosis is influenced by oestradiol and the cell cycle. J Endocrinol. 2006;189:441–453. doi: 10.1677/joe.1.06549. [DOI] [PubMed] [Google Scholar]
- Rooke JA, Ewen M, Mackie K, Staines ME, McEvoy TG, Sinclair KD. Effect of ammonium chloride on the growth and metabolism of bovine ovarian granulosa cells and the development of ovine oocytes matured in the presence of bovine granulosa cells previously exposed to ammonium chloride. Anim Reprod Sci. 2004;84:53–71. doi: 10.1016/j.anireprosci.2003.12.005. [DOI] [PubMed] [Google Scholar]
- Rukkwamsuk T, Geelen MJ, Kruip TA, Wensing T. Interrelation of fatty acid composition in adipose tissue, serum, and liver of dairy cows during the development of fatty liver postpartum. J Dairy Sci. 2000;83:52–59. doi: 10.3168/jds.S0022-0302(00)74854-5. [DOI] [PubMed] [Google Scholar]
- Sarentonglaga B, Ogata K, Taguchi Y, Kato Y, Yoshikazu Nagao Y. The developmental potential of oocytes is impaired in cattle with liver abnormalities. J Reprod Dev. 2013;59(2):168–173. doi: 10.1262/jrd.2012-163. [DOI] [PMC free article] [PubMed] [Google Scholar]
- Shen M, Lin F, Zhang J, Tang Y, Chen WK, Liu H. Involvement of the up-regulated FoxO1 expression in follicular granulosa cell apoptosis induced by oxidative stress. J Biol Chem. 2012;287:25727–25740. doi: 10.1074/jbc.M112.349902. [DOI] [PMC free article] [PubMed] [Google Scholar]
- Shimizu T, Ohshima I, Ozawa M, Takahashi S, Tajima A, Shiota M, Miyazaki H, Kanai Y. Heat stress diminishes gonadotropin receptor expression and enhances susceptibility to apoptosis of rat granulosa cells. Reproduction. 2005;129(4):463–472. doi: 10.1530/rep.1.00502. [DOI] [PubMed] [Google Scholar]
- Sinclair KD, Kuran M, Gebbie FE, Webb R, McEvoy TG. Nitrogen metabolism and fertility in cattle: II. Development of oocytes recovered from heifers offered diets differing in their rate of nitrogen release in the rumen. JAnim Sci. 2000;78:2670–2680. doi: 10.2527/2000.78102670x. [DOI] [PubMed] [Google Scholar]
- Tang H, et al. Intrinsic apoptosis in mechanically ventilated human diaphragm: linkage to a novel Fos/FoxO1/Stat3-Bim axis. FASEB J: Off Publ Fed Am Soc Exp Biol. 2011;25:2921–2936. doi: 10.1096/fj.11-183798. [DOI] [PMC free article] [PubMed] [Google Scholar]
- Thouas GA, Korfiatis NA, French AJ, Jones GM, Trounson AO. Simplified technique for differential staining of inner cell mass and trophectoderm cells of mouse and bovine blastocysts. Reprod BioMed Online. 2001;3:25–29. doi: 10.1016/S1472-6483(10)61960-8. [DOI] [PubMed] [Google Scholar]
- Tripathi SK, Nandi S, Gupta PSP, Mondal S. Influence of common saturated and unsaturated fatty acids on development of ovine oocytes in vitro. Asian J Anim Sci. 2015;9:420–426. doi: 10.3923/ajas.2015.420.426. [DOI] [Google Scholar]
- Tripathi SK, Farman M, Nandi S, Girish Kumar V, Gupta PSP. Oviductal and uterine fluid analytes as biomarkers of metabolic stress in ewes (Ovis aries) Small Rumin Res. 2016;144:225–228. doi: 10.1016/j.smallrumres.2016.09.022. [DOI] [Google Scholar]
- Tripathi SK, Farman M, Nandi S, Mondal S, Gupta PSP. In vitro culture of oocytes and granulosa cells collected from normal, obese, emaciated and metabolically stressed ewes. Anim Reprod Sci. 2016;170:83–89. doi: 10.1016/j.anireprosci.2016.04.007. [DOI] [PubMed] [Google Scholar]
- Valckx SD, Van Hoeck V, Arias-Alvarez M, Maillo V, Lopez-Cardona AP, Gutierrez-Adan A, Berth M, Cortvrindt R, Bols PE, Leroy JL. Elevated non-esterified fatty acid concentrations during in vitro murine follicle growth alter follicular physiology and reduce oocyte developmental competence. Fertil Steril. 2014;102:1769–1776 e1761. doi: 10.1016/j.fertnstert.2014.08.018. [DOI] [PubMed] [Google Scholar]
- Van Hoeck V, Sturmey RG, Bermejo-Alvarez P, Rizos D, Gutierrez-Adan A, Leese HJ, Bols PE, Leroy JL. Elevated non-esterified fatty acid concentrations during bovine oocyte maturation compromise early embryo physiology. PLoS One. 2011;6:e23183. doi: 10.1371/journal.pone.0023183. [DOI] [PMC free article] [PubMed] [Google Scholar]
- Van Hoeck V, Bols PE, Binelli M, Leroy JL. Reduced oocyte and embryo quality in response to elevated non-esterified fatty acid concentrations: a possible pathway to subfertility? Anim Reprod Sci. 2014;149:19–29. doi: 10.1016/j.anireprosci.2014.07.015. [DOI] [PubMed] [Google Scholar]
- Vanholder T, Leroy JL, Soom AV, Opsomer G, Maes D, Coryn M, de Kruif A. Effect of non-esterified fatty acids on bovine granulosa cell steroidogenesis and proliferation in vitro. Anim Reprod Sci. 2005;87:33–44. doi: 10.1016/j.anireprosci.2004.09.006. [DOI] [PubMed] [Google Scholar]
- Waiz SA, Raies-ul-Haq M, Dhanda S, Kumar A, Goud ST, Chauhan MS, Upadhyay RC. Heat stress and antioxidant enzyme activity in bubaline (Bubalus bubalis) oocytes during in vitro maturation. Int J Biometerol. 2016;60(9):1357–1366. doi: 10.1007/s00484-015-1129-0. [DOI] [PubMed] [Google Scholar]
- Weng Q, Liu Z, Li B, Liu K, Wu W, Liu H. Oxidative stress induces mouse follicular granulosa cells apoptosis via JNK/FoxO1 pathway. PLoS One. 2016;11:e0167869. doi: 10.1371/journal.pone.0167869. [DOI] [PMC free article] [PubMed] [Google Scholar]
- Ye J, Coulouris G, Zaretskaya I, Cutcutache I, Rozen S, Madden TL (2012) Primer-BLAST: a tool to design target-specific primers for polymerase chain reaction. BMC Bioinformatics 13:134. 10.1186/1471-2105-13-134 [DOI] [PMC free article] [PubMed]
- Yenuganti VR, Viergutz T, Vanselow J. Oleic acid induces specific alterations in the morphology, gene expression and steroid hormone production of cultured bovine granulosa cells. Gen Comp Endocrinol. 2016;232:134–144. doi: 10.1016/j.ygcen.2016.04.020. [DOI] [PubMed] [Google Scholar]
- Yuan Y, Krisher RL. Effect of ammonium during in vitro maturation on oocyte nuclear maturation and subsequent embryonic development in pigs. Anim Reprod Sci. 2010;117:302–307. doi: 10.1016/j.anireprosci.2009.05.012. [DOI] [PubMed] [Google Scholar]
- Zhang Z, Dmitrieva NI, Park JH, Levine RL, Burg MB. High urea and NaCl carbonylate proteins in renal cells in culture and in vivo, and high urea causes 8-oxoguanine lesions in their DNA. Proc Natl Acad Sci USA. 2004;101:9491–9496. doi: 10.1073/pnas.0402961101. [DOI] [PMC free article] [PubMed] [Google Scholar]
- Zhang JQ, et al. Critical role of FoxO1 in granulosa cell apoptosis caused by oxidative stress and protective effects of grape seed Procyanidin B2. Oxidative Med Cell Longev. 2016;2016:6147345. doi: 10.1155/2016/6147345. [DOI] [PMC free article] [PubMed] [Google Scholar]
Associated Data
This section collects any data citations, data availability statements, or supplementary materials included in this article.
Supplementary Materials
(XLSX 47 kb)