Abstract
Light-induced leaflet movement of Samanea saman depends on the regulation of membrane transporters in motor cells. Blue light (BL) stimulates leaflet opening by inducing K+ release from the flexor motor cells. To elucidate the mechanism of K+-efflux (KD)-channel regulation by light, flexor motor cell protoplasts were patch-clamped in a cell-attached configuration during varying illumination. Depolarization elicited outward currents through single open KD channels. Changes in cell membrane potential (EM) were estimated by applying voltage ramps and tracking the change of the apparent reversal potential of KD-channel current. BL shifted EM in a positive direction (i.e. depolarized the cell) by about 10 mV. Subsequent red light pulse followed by darkness shifted EM oppositely (i.e. hyperpolarized the cell). The BL-induced shifts of EM were not observed in cells pretreated with a hydrogen-pump inhibitor, suggesting a contribution by hydrogen-pump to the shift. BL also increased KD-channel activity in a voltage-independent manner as reflected in the increase of the mean net steady-state patch conductance at a depolarization of 40 mV relative to the apparent reversal potential (G@40). G@40 increased by approximately 12 pS without a change of the single-channel conductance, possibly by increasing the probability of channel opening. Subsequent red-light and darkness reversed the change in G@40. Thus, K+ efflux, a determining factor for the cell-volume decrease of flexor cells, is regulated by BL in a dual manner via membrane potential and by an independent signaling pathway.
Samanea saman, a nyctinastic leguminous plant of the Mimosa family, opens its leaves and leaflets during daytime or in light and closes them during night or in darkness (DK). The motor organ for the leaf movement is a pulvinus located at the base of the leaf and leaflets, and the movement depends on extensive ion fluxes and consequent osmotic water flux in and out of the motor cells of the pulvinus. During an opening movement, extensor motor cells take up ions and water and thus swell, and flexor cells do the opposite (Satter and Galston, 1981). During closing movement, the reverse processes occur. We use the S. saman motor organ as a model system for the study of the regulation of ion transport.
Although many different ions move across the plasma membrane of pulvinar cells during leaflet movement, K+ flux is the most dramatic (Satter et al., 1974a, 1974b; Lowen and Satter, 1989; Lee, 1990). Based on previous results from motor cells and similar varying-turgor systems, we envisage two major factors that determine the transcellular K+ flux in the pulvinar motor cells. The first factor is the membrane potential that drives the gating of the K+ channels as well as the ion movement through an open channel (Moran et al., 1988; Moran and Satter, 1989; Moran, 1990). The extent of the hyperpolarization below the K+ equilibrium potential is determined by H+-pump activity, whereas the depolarization above the K+ equilibrium potential is determined presumably by Cl− and/or Ca2+ permeabilities (Keller et al., 1989; Schroeder and Hagiwara, 1989). In the pulvinar motor cells, several types of measurements connected leaflet movements induced by light or circadian clock to changes of membrane potential (Racusen and Satter, 1975) to H+-pump activity (Lee and Satter, 1989) as well as to K+ fluxes (Lowen and Satter, 1989). The second factor is a mechanism independent from membrane potential, for example, second messengers, which may participate in the regulation of S. saman K+ channels. In support of this notion, in patch-clamp experiments with S. saman extensor cells, phosphorylation has been shown to regulate the KD channel (depolarization-activated K+-efflux channel; Moran, 1996). Also, many signal transducers including Ca2+, pH, and G protein have been shown to modulate K+-channel activities in guard cells (Assmann, 1993).
Both membrane potential-dependent and -independent factors have been shown to regulate K+ influx into extensor motor cells; using a membrane potential-sensitive dye, blue light (BL) has been shown to activate both the H+ pump and K+-influx channel, and the activation of the latter did not always accompany that of the former (Kim et al., 1992). However, regulation of K+ efflux from motor cells was not addressed in that study due to technical limitations. Therefore, we chose here to examine the mechanism of BL activation of S. saman KD channels, which was suggested to be the pathway for K+ efflux (Moran et al., 1988). To resolve this at the level of participating molecules, we used patch clamp. Since the cytosolic content of the cell is diluted or lost in the “whole-cell” and “excised-patch” configurations of the patch clamp, we preferred the “cell-attached” configuration that does not perturb the contents of the intact cell and therefore has a potential to reveal the natural responses of ion channels to physiological stimuli that may involve interactions of many cytosolic signal transduction elements. Applying this technique to S. saman flexor cells, we demonstrate here directly an effect of BL on the opening of KD channels. Moreover, we separate this BL effect into two independent routes of KD-channel activation: via membrane depolarization and through a voltage-independent pathway. To the best of our knowledge, such effects have not been demonstrated previously.
RESULTS
Depolarization-Activated K+ Channels in Motor Cells
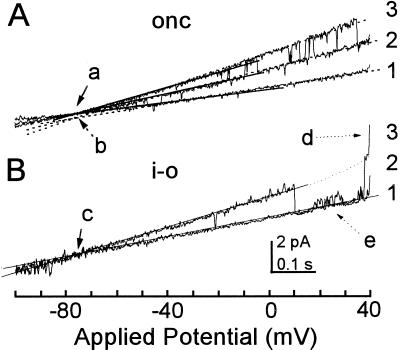
During application of voltage ramps to cell-attached patches of flexor (Fig. 1) and extensor (data not shown) cells of S. saman, we detected outward single-channel current fluctuations, signifying channel openings. The characteristics of channel opening in the extensor and flexor appeared similar. Channels opened by patch-membrane depolarization above the reversal potential, and the extent of opening increased with the extent of depolarization. These are characteristics of the KD channels, the most ubiquitous channel in S. saman motor cells (Moran et al., 1988; Moran, 1990, 1996). Single-K+-channel conductance, γK (see Eq. 1), in cell-attached patches of flexor and extensor cells was, respectively, 19.4 ± 0.5 (n = 13) and 19.6 ± 1.2 (n = 5) pS under DK, in the presence of 5 mm K+ in the bath and 25 mm K+ in the pipette. These results are consistent with previous data on KD-channel characteristics. To substantiate further this identification, we tested the selectivity of the channel in two different types of experiments. First, we examined transitions from an on-cell to an excised-patch configuration with high external K+ concentration where the membrane could act as a K+ electrode (Fig. 2), and second, we determined reversal potentials in an on-cell configuration under conditions of different K+ concentrations in the bath (Fig. 3). A depolarization-dependent channel in one and the same patch in two configurations (on-cell and excised) was pre-opened by a depolarizing holding potential and recorded on a fast-time scale to catch it in a conducting state as close as possible to the point of current reversal (Fig. 2). The channel in the excised patch in Figure 2B was a predominantly K+-selective channel with current reversing at approximately −76 mV (close to K+ equilibrium potential of −81 mV). For comparison, the Nernst potentials (bath/pipette) of Cl−, Ca2+, and H+ (ECl, ECa, and EH) were 99, 217, and 88 mV, respectively. The same channel in an on-cell configuration in Figure 2A had the same apparent reversal potential (Vrev) (−76 mV), consistent with both of (a) the K+-electrode-like behavior of the whole-cell membrane and (b) the K+ selectivity of the channels in the patch (notably, with both conditions fulfilled, the cytosolic concentration of K+ becomes irrelevant; Manor and Moran, 1994). In the conditions of our experiments, channels that “looked like KD channels” in cell-attached patches were always proven to be such channels upon excision into an inside-out configuration (Moran, 1996; N. Moran, unpublished data).
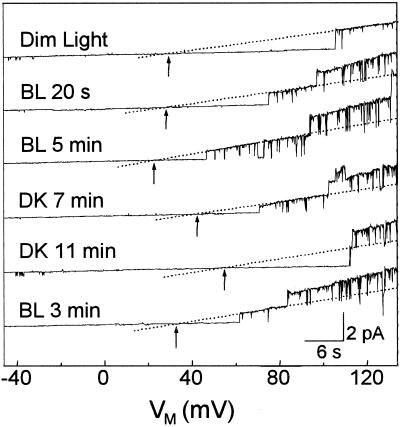
Figure 1.
Light effects on KD-channel openings in a flexor cell. Representative current traces recorded from a cell-attached patch of a flexor cell during a slow (42 s long) voltage ramp applied at indicated times during consecutive BL/DK/BL treatments. Upward deflections indicate currents flowing from the cell outward (into the pipette). Dotted lines indicate the idealized currents through single-open channels (eye-fitted). Arrows: Vrev; dim, initial dim light. Note the light-induced changes in the KD-channel activity and the shifts in Vrev values.
Figure 2.
The prevalent, depolarization-activated channel in cell-attached recording is a K+ channel. One-second-long voltage ramp (from a hyperpolarizing −100 mV to depolarizing 40 mV) was applied repetitively at 10-s intervals to a membrane patch of a flexor protoplast. To increase the chance of KD-channel opening during the ramps, a 20-mV depolarization was applied between the ramps, and the ramps were fast (i.e. the gating was not at steady state). A, Three superimposed traces of unitary currents during the voltage ramps in an on-cell (onc) configuration. Straight lines indicate the idealized (eye-fitted) currents through single open channels. Arrows indicate a reversal potential of −76 mV, determined by linear fitting of the lower or the upper parts of the traces (a or b, solid or dashed lines, respectively). Numbers at the right indicate the number of channels open simultaneously (the all-channels-closed level was observed in other records, not shown). The unitary conductance increased between levels 1 and 3 in steps of 15 pS on average. B, Two superimposed traces of currents from the same membrane patch within 3 min after excision into an inside-out (i-o) configuration. Open channel conductance (between levels 1 and 2), 17 pS; arrow c, reversal potential of −76 mV; arrow d, opening of a third channel; arrow e, a small, unidentified channel seen occasionally at higher depolarizations. Scale bars are common to A and B.
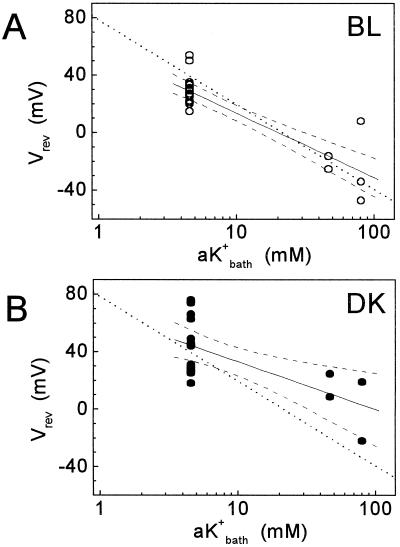
Figure 3.
The cell membrane and the channels in the patch are K+ selective. Reversal potentials under the first BL (A) and under the first DK treatment (B) are plotted versus three bath K+ activities. The dotted lines describe the equation: Vrev = −59 log10(aK+bath/aK+pip) where aK+ = K+ activity, bath and pip denote the bath and the pipette solutions, respectively, and aK+pip = 21.5 mm, corresponding to K+ concentration of 25 mm. The solid lines are linear fit to Y = a + b log10(aK+bath); R is the coefficient of correlation; n, the number of data points; P, probability that R = 0. The dashed lines are the 95% confidence limits of the fit (Microcal Software Inc., Northampton, MA). The values of the fit were: for BL, a = 58.3 ± 5.5 mV; b = −44.7 ± 5.4; R = −0.86835; P < 0.0001; n = 24; for DK, a = 66.4 ± 10 mV; b = −33.2 ± 10; R = −0.61649; P = 0.00379; n = 20. The mean values of the experimentally determined Vrev were (under BL and DK, respectively): at bath concentration of 5 mm, 28.8 ± 2.2 mV and 44.3 ± 5.1 mV; at 55 mm, −20.9 ± 4.5 mV and 16.6 ± 8.0 mV; at 105 mm, −24.3 ± 16.6 mV and −1.5 ± 20.5 mV.
Figure 3 shows the values of Vrev determined in a cell-attached configuration at three concentrations of K+ (25, 55, and 105 mm) in the bath under the first BL and under the first DK treatment, separately. If K+ conductance was the prevalent one in the whole cell membrane, we should be able to predict the slope of Vrev as a function of Kbath (because the membrane potential of the cell [EM] would change as a function of Kbath). In both BL and DK (Fig. 3), the theoretical value of the slope of −59 mV (dotted line) was only by 1 mV out of the calculated 95% error range of the values of experimental mean slopes (the slopes of the solid lines were −45 ± 5.4 [se, n = 24] mV and −33 ± 10 [se, n = 20] mV for BL and DK, respectively). This small difference could be attributed to other channels of minor conductance in the whole-cell membrane. Additionally, if the channel in the patch was the KD channel, we should be able to predict closely also the absolute values of Vrev as a function of Kbath, not only the slope. Indeed, under BL the predicted Vrev agreed generally with the experimental mean Vrev (Fig. 3A). Taken together these results firmly established the identity of the channel as the K+-selective KD channel.
Light Responses of Flexor Cells
As soon as a tight seal was achieved under dim light, the activity of several KD channels was apparent in most flexor cells. Their activity usually diminished as time passed, and after about 10 min, only a few openings remained with current fluctuation levels usually between 0 and 2, indicating the simultaneous activity of up to two channels in the patch. The single-channel conductance in the cell-attached flexor patches was 19.8 ± 0.7 pS under dim light, and it did not change by light treatments; it was 20.2 ± 0.7 pS (n = 13) under BL and 19.4 ± 0.5 pS (n = 13) under DK.
In the example of Figure 1, under dim light KD channels opened at minus pipette potential corrected for liquid-junction potential (VM) more positive than 106 mV. After 20 s of BL illumination, KD channels opened already at 75 mV and two channels opened simultaneously at 97 mV. KD-channel activity increased further during BL illumination, and three channels opened simultaneously at VM of 131 mV after 5 min of BL. After 7 min of BL illumination, cells were irradiated with red light (RL) for 3 min, followed by DK. The response to BL was reversed under DK. It took longer than 11 min until the activity decreased to the level of initial dim light. Although the time required for a clear response was different from cell to cell, the response time in the BL was usually shorter than that of its reversal in the DK. At the second BL stimulus, KD-channel activity increased again, indicating that the observed light response was indeed caused by the light treatment and was not due to random changes in channel openings.
Another prominent feature of Figure 1 was that BL shifted Vrev to more negative values (e.g. by −15 mV after 5 min in BL), whereas DK did the opposite. The shifts in Vrev could be caused either by shifts in EM or by changes in the true reversal potential across the membrane patch (Erev) (see Eq. 3). Changes in Erev, in turn, could stem from changes in the intracellular concentration of K+ and/or from changes in the selectivity of the channels in the patch. However, we consider changes in Erev unlikely, for several reasons. First, the intracellular concentration of K+ did not change much during the duration of our experiments, since (a) the single-channel conductance values (which depend on the concentrations of K+ in the cell, [N. Moran, unpublished results]) did not change significantly, and (b) had K+ efflux occurred in response to BL in flexor protoplasts as reported for flexor cells in intact pulvini (Lowen and Satter, 1989), it would have caused a positive change in Erev and hence in Vrev (see Eq. 3), which is the opposite of what we have observed. Second, (a) a positive shift of Erev would be also caused had BL changed the selectivity of the channels in the patch so that they became more permeable to Ca2+ and/or H+, and/or Cl−. This is, again, contrary to our observations. Then, (b) the channels in the patch could become more K+ selective under BL than under DK. However, in experiments performed in excised patches, under the illumination termed “DIM” in this paper, the K+ selectivity of flexor KD channels was already quite high (Fig. 2). Thus, BL could not increase K+ selectivity much more to account for as much as approximately 10 mV observed hyperpolarization (see below). Based on these considerations, we interpret the shifts of Vrev in these experiments as indicators of changes in EM.
Light-Induced Shifts of Membrane Potential in Flexor Cells
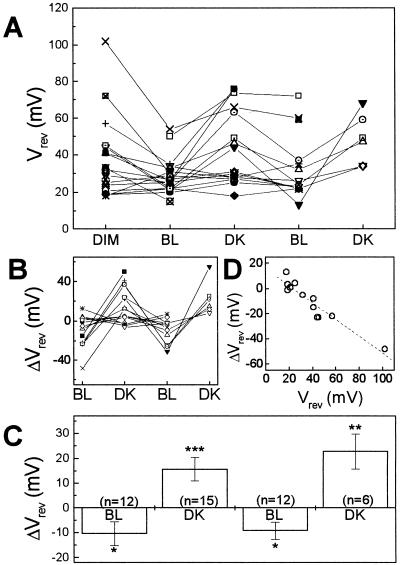
Using Vrev as if it were the membrane potential probe (see Eq. 3), we could follow EM, the membrane potential, under changing illumination. The initial value of the reversal potential, as well as the magnitude of membrane potential shift varied a lot among the cells, but the direction of the change was consistent for the same stimulus. In the dim light, the Vrev values ranged from 4 to 88 mV (n = 19; Fig. 4A). Upon BL illumination, there were cells in which Vrev moved to near zero, suggesting that cells were depolarized. Most cells, which depolarized under BL, were re-hyperpolarized upon DK treatment, and these responses were repeated upon the second BL/DK cycle. To emphasize the effects of illumination, we present the Vrev shifts (ΔVrev; see Eq. 3; Fig. 4B). The mean values of ΔVrev were, respectively, −10 ± 5, 16 ± 5, −9 ± 4, and 23 ± 7 mV (mean ± se, n = 12, 15, 12, and 6, respectively) under sequential BL, DK, BL, and DK treatments (Fig. 4C). Although these averages include values from cells with un-noticeable voltage shifts, the mean shifts were significantly different from zero (Fig. 4C).
Figure 4.
Light-induced shift of cellular membrane potential in flexor cells. A, Vrev values of KD-channel currents in single membrane patches under sequential light treatments. A negative shift of Vrev indicates membrane depolarization (Eq. 3). Different symbols denote different patches. B, Vrev shifts (individual values) at various illumination conditions. Data and symbols are as in A, but only the patches, which lasted longer than three different light conditions (including initial dim light), are included. C, Vrev shifts (mean ± se). The asterisks indicate the significance level of difference from zero; *P < 0.05; **P < 0.01; ***P < 0.005. n, The number of membrane patches. D, Correlation between the initial Vrev value and the magnitude of Vrev shift upon first BL treatment. Dashed line, Linear regression to the data. R = −0.944, P < 0.0001.
A major contributor to the membrane potential shift is probably the H+ pump. Activation of H+-pump hyperpolarizes, and its inactivation depolarizes the membrane. To determine the extent of the contribution of the H+ pump to the voltage response, cells were patch clamped in a bath containing 50 to 200 μm dicyclocarbodiimide (DCCD), an H+-pump inhibitor (Surowy and Sussman, 1986). In DCCD-treated flexor cells, Vrev remained at 30 ± 2 mV (n = 5) without changing upon BL/DK treatments. This lack of Vrev shift is consistent with an inhibition of the H+ pump. Also consistent with this interpretation is the observation that only the cells with large initial values of Vrev under dim light (i.e. originally more hyperpolarized than other cells) showed negative Vrev shifts under BL (i.e. a depolarization response), and the cells with initial Vrev values near 0 mV did not respond to light (Fig. 4D) possibly because the H+-pump activity in these cells was originally low. The cells with low pump activity may be similar to giant cells of charophytes or Plantago root cells in the K state where the proton pump is inactive and the membrane potential is determined by K+ diffusion potential (Bisson and Walker, 1982; Vogelzang and Prins, 1994). Conversely, the originally more hyper-polarized S. saman flexor cells resemble the cells in the P-state where proton pump is active and thus determines the membrane potential.
Voltage-Independent KD-Channel Regulation by Light
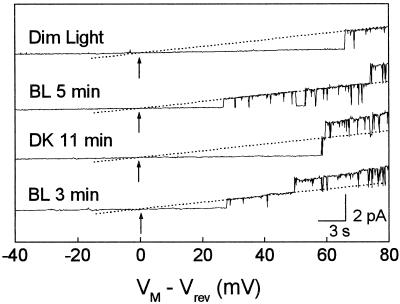
The BL-induced increase of KD-channel activity (Fig. 1) could be due either directly to the BL-induced depolarization of the cell membrane, to a voltage-independent modulation of the KD channel, or to a combination of both. Since KD-channel activation by depolarization is related to the degree of depolarization beyond the prevailing reversal potential rather than to the absolute value of the depolarization (Moran et al., 1987; Blatt, 1988; Blatt and Gradmann, 1997) to test whether light regulates the KD channels in a voltage-independent manner, we rearranged the current traces against a new voltage scale of VM − Vrev, positioning the zero-current point at 0 mV. In fact, this is synonymous with subtracting the effect of the voltage shift from each trace. At a constant distance from the reversal potential, for example, at a 40-mV more depolarized potential, the reversible activation-deactivation responses of KD channels to illumination changes were still clearly apparent (Fig. 5).
Figure 5.
Light effects on KD-channel openings in a flexor cell plotted on a new voltage scale (VM − Vrev). Current traces of Figure 1 are rearranged against VM − Vrev, so that all zero-current points coincide with 0 mV (VM, applied membrane potential; see “Materials and Methods” for definitions of voltage polarity). Arrows: Vrev; dim, initial dim light. Note the reversible changes in KD-channel activity.
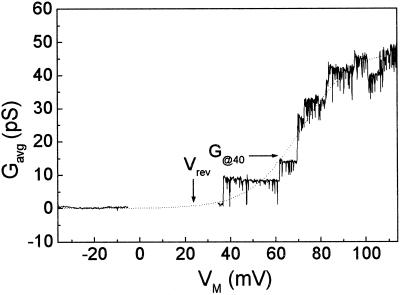
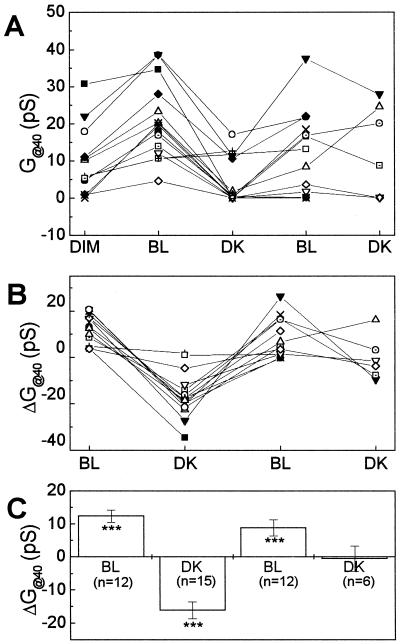
Direct comparison of KD-channel activity among the various current traces was difficult due to the small number of channels observed in a patch. Therefore, we estimated the mean idealized patch conductance through its open KD channels at each membrane potential value by fitting the calculated patch conductance (Gavg) with the Boltzmann equation (see Eq. 5) as described in “Materials and Methods.” The increase of the mean net steady-state patch conductance at a depolarization of 40 mV relative to the apparent reversal potential (G@40) was then read off the fitted curve at a depolarization of 40 mV relative to the reversal potential (Fig. 6). At the initial dim light, the G@40 values were different from cell to cell and ranged from 0 to 30 pS (Fig. 7A). BL increased conductance in most cells, and the magnitude of the response ranged from 4 to 21 pS (Fig. 7B). A subsequent DK treatment of these cells induced a decrease of G@40. At the second BL treatment, G@40 values increased again but in a smaller number of cells than at the first BL. At the second DK treatment, G@40 values did not change. There were either too few cells to demonstrate any significant change or perhaps the reproduction of second messengers between the closely spaced repetitive stimuli was not adequate. The averaged values of the changes in G@40 (ΔG@40) at the sequential BL, DK, BL, and DK treatments were, respectively, 12.4 ± 1.8, −16 ± 2.5, 8.9 ± 2.5, and −0.5 ± 3.8 pS (mean ± se, Fig. 7C). The change in G@40 induced by a stimulus (ΔG@40) values were averaged over all cells to obtain the mean changes, and they were significantly different from zero at each treatment (Fig. 7C) except at the second DK.
Figure 6.
Voltage dependence of Gavg, the mean net steady-state patch conductance in a cell-attached patch. Gavg was extracted from the average current-VM curve (“Materials and Methods”) and was plotted versus the applied membrane potential, VM. Dotted line, A Boltzmann function fit to the Gavg to VM relationship (Eq. 5). G@40, The fit value of the conductance at a membrane potential depolarized by 40 mV relative to the reversal potential.
Figure 7.
Light-induced changes of KD-channel activity in flexor cells. A, G@40 of individual membrane patches under different light conditions. Different symbols denote different patches. B, G@40 changes in individual patches upon illumination changes. Data and symbols are as in A. C, Averaged G@40 changes of Figure 7B (mean ± se). The asterisks indicate the significance level of difference from zero: *P < 0.05; **P < 0.01; ***P < 0.005. n, The number of membrane patches.
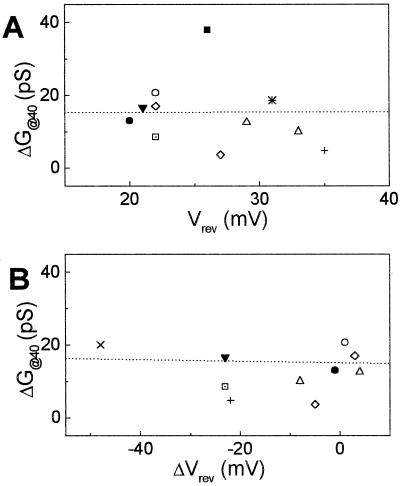
Since some channels have been reported to show different activities depending on the previous voltage treatment or prepulse (Thuleau et al., 1994) and since in our experiments the true absolute membrane potential values varied from cell to cell, the extent of KD-channel response might be correlated with the cell-membrane potential. To test this possibility (and assuming that cytosolic K+ concentration varies little among cells and hence differences among Vrev values reflect mainly differences among values of EM), the ΔG@40 values obtained at the first BL treatment were plotted against their corresponding Vrev values (Fig. 8A). ΔDG@40 was not correlated with Vrev (R correlation coefficient = −0.006, P = 0.9853), implying KD-channel response to light was independent of EM. We tested also the possible correlation between the two types of responses to the first BL treatment, the shifts in the Vrev, ΔVrev (the change in Vrev induced by a stimulus), and changes in KD-channel activity, ΔG@40; no correlation was apparent (R = −0.041, P = 0.8982, Fig. 8B), suggesting independence of the two responses.
Figure 8.
KD-channel activity versus membrane potential in flexor cells. A, Lack of correlation between the effect of BL on KD-channel activity (indicated by ΔG@40 at the first BL cycle) and the initial membrane potential (indicated by Vrev). Dotted line, Linear regression to the data. R = −0.006, P = 0.9893. B, Lack of correlation between ΔDG@40 and the light-induced shift in membrane potential (ΔVrev). Dashed line, As above; R = −0.041, P = 0.8982.
DISCUSSION
Light Regulation of H+-Pump Activity and Membrane Potential in Flexor Cells
Leaflet unfolding depends on the shrinking of flexor cells, which requires K+ efflux, which in turn requires depolarization of flexor cells. This correlation (between leaflet unfolding and depolarization of flexors) has been confirmed by direct measurements with microelectrode impalements of flexor cells in situ (figure 1 in Racusen and Satter, 1975). The change in membrane potential in response to BL (Fig. 4) is in the same direction as those measured directly by these authors in response to white light, another leaflet unfolding signal (figure 2 in Racusen and Satter, 1975; the depolarization of approximately 12 mV they observed within 20 min of stimulation is well within the 1-sd range of the depolarization we observed with BL of 10 ± 22 mV). Furthermore, our data also match their report on flexor cell hyper-polarization induced by 3-min illumination with RL followed by DK (Racusen and Satter, 1975). Depolarization/hyperpolarization of the membrane potential induced (respectively) by BL/RL+DK treatments are likely to be caused by the respective inactivation/activation of the H+ pump, since five of five DCCD-treated cells did not show any shift of the reversal potential in contrast to DCCD-untreated cells in the same illumination regime. The effect of DCCD in our experiments is similar to its effect on the Phaseolus vulgaris pulvinus: There, too, DCCD inhibited the depolarization caused by BL presumably by pre-inhibiting the H+ pump (Nishizaki, 1994). Our result is also consistent with previous reports that suggested an important role of the H+ pump in leaf movement based (a) on light-dependent changes in apoplastic pH in whole pulvini or excised pulvinar tissue (Iglesias and Satter, 1983; Lee, 1990) and (b) on sensitivity to the H+-pump inhibitors of the light-dependent membrane potential shifts in pulvinar protoplasts (Kim et al., 1992).
Light Regulation of K+ Channels
Light-regulated K+ fluxes have been demonstrated in the S. saman pulvinus (Satter et al., 1974b; Lowen and Satter, 1989), and light-dependent changes in K+-influx channel activity were shown indirectly in populations of protoplasts using a membrane potential-sensitive dye (Kim et al., 1992, 1993). In this paper we show light-dependent changes in KD-channel activity at the single-channel level using cell-attached patch-clamp technique. Ion channels of plants that have been shown to respond to light at the single-channel level include (a) Cl− channel in Arabidopsis hypocotyl protoplasts activated by BL through an unknown photoreceptor (Cho and Spalding, 1996), (b) K+ channels in the alga Mougeotia sp. activated by RL through phytochrome (Lew et al., 1992), and (c) K+-efflux channels in Arabidopsis mesophyll cells activated by white light, possibly via photosynthetically produced ATP (Spalding et al., 1992; Spalding and Goldsmith, 1993). However, we have not encountered any reports explicitly showing activation of KD channels by BL in any plant system and especially not at a single-channel level.
Even after we subtracted the effects of voltage shift, the light-induced increase of KD-channel activity was evident as an increase in G@40 (Fig. 7). Based on the definition G@40 = γK × N × fO × PO (where N is the number of channel molecules in the patch, PO is the voltage-dependent probability of opening, and fO is their voltage-independent probability to open; Ilan et al., 1996), we propose that BL increased N × fO − what might be termed the KD-channel availability (Ilan et al., 1996) for the following reasons: (a) PO at 40-mV depolarization relative to Vrev was likely to be the same in all cells (Moran et al., 1987; Blatt, 1988; Blatt and Gradmann, 1997), and (b) γK did not vary. Unfortunately, the question of which component, N or fO, changes and contributes to the increase of KD-channel availability cannot be resolved unequivocally even at the single-channel level (unless a patch is examined at saturation voltages for sufficiently and often impractically long periods of time); BL could increase either N, fO, or both. Increase in N can be brought about by the insertion of additional channel molecules into the membrane, for example, by vesicle fusion with the plasma membrane. Increase of fO may be brought about by a modification of channel molecules already existing in the membrane, for example, by covalent modifications such as phosphorylation/dephosphorylation.
The Identity of the BL Receptor That Modulates KD-Channel Activity in Flexor Motor Cells
S. saman leaflets close upon DK and open in response to BL or white light. RL pulse perceived by phytochrome accelerates the dark effect, whereas BL reverses it (Satter, 1979). Previous experiments following ion flux changes in S. saman motor organs used irradiation protocols of BL or white light, and then RL followed by DK or vice versa to maximize the contrasting effects of the two groups of stimuli (Lee and Satter, 1989; Lowen and Satter, 1989). In this work, we followed the same irradiation protocol and showed the activation of KD channel by BL and inactivation of the same channel by RL followed by DK. The photoreceptor involved in BL-induced KD-channel activation cannot be phytochrome, since RL, which also activates phytochrome, reversed the effect of BL. The photoreceptor is not likely to be chlorophyll either, since the fluence rate of BL was too low (25 μmol m−2 s−1) to activate much photosynthesis. In other plant systems, 200 to 500 μmol m−2 s−1 of RL was used to activate chlorophyll-mediated pathways modulating ion transport (Serrano et al., 1988; Spalding and Goldsmith, 1993) and the consequent cell swelling (Schwartz and Zeiger, 1984). The BL receptor for KD-channel activation in flexor motor cells is probably an unidentified blue-absorbing pigment, which was suggested to be involved in BL-induced leaflet opening (Satter et al., 1988). In BL-invoked shrinking of Arabidopsis hypocotyl protoplasts, which appears to proceed similarly to the BL-induced shrinking of S. saman flexor cells (Wang and Iino, 1998), the primary BL photoreceptor appears to be the cryptochrome CRY1 (Lin et al., 1995). Resolving the nature of the BL receptor in S. saman motor organ awaits further research.
CONCLUSIONS
The responses of the KD channel of flexor to various light treatments are consistent with those of the K+ flux from the intact flexor tissue of S. saman (Lowen and Satter, 1989). In flexor tissue, white light, an opening signal for the leaflets (and for flexor protoplast shrinking; Moran et al., 1996), elevates apoplastic K+ activity which requires the opening of the KD channels, which we observed directly after irradiation with BL, an active component of the white light in leaflet opening. In contrast, RL followed by DK, a closing signal for the leaflets, which reverses the change in apoplastic K+ activity (and causes flexor protoplast swelling; Moran et al., 1996), was also found to reverse the change in KD-channel activity. Therefore, this work provides evidence for the KD channel of flexor as an important exit pathway for K+ during leaflet closing. Moreover, using the patch-clamp technique in a cell-attached configuration we were able to resolve the voltage-independent increase of KD-channel activity in BL.
MATERIALS AND METHODS
Plant Material
Samanea saman L. (Jacq.) Merr. trees were grown in a greenhouse under 14-h light/10-h dark periods and 24°C ± 4°C/18°C ± 1°C conditions. Leaves were harvested at 1 h after sunrise, and extensor and flexor parts were excised from secondary terminal pulvini. For the experiment in Figure 2, there were 16-h light/8-h dark periods, the temperature ranges were 35°C ± 5°C/23°C ± 4°C, and the protoplasts were harvested within 3 h after sunrise. Protoplasts were prepared as described previously (Moran, 1996) except that the proteinase inhibitor, phenylmethylsulfonyl fluoride, was omitted from the digestion medium. The isolated protoplasts were kept on ice under constant low-level illumination (approximately 5 μmol m−2 s−1) until use.
Light Treatments
At the onset of each patch-clamp experiment, the room was illuminated with a dim light (<1 μmol m−2 s−1) and with a green light from cool-white fluorescent lamps wrapped with two layers of green cellophane (#871, Roscoe Labs, Portchester, NY) during the rest of the experiment. The microscope light was filtered through a green-light filter (<5% transmittance for wavelength <490 nm or >610 nm). Light treatments used a fiber optic halogen light source (Nikon, Tokyo) and Plexiglas filters: blue (53% transmittance at peak wavelength of 472 nm, one-half bandwidth of 18 nm) or red (one-half transmission at 631 nm and blocked completely at λ <600 nm). A heat-absorbing glass (>52% absorbance above 700 nm and 100% A860) was inserted into the light path of the light source. About 15 min after giga-seal formation, when the recorded currents appeared stable, the patch-clamped cells were illuminated with 25 μmol m−2 s−1 BL for up to 7 min, then with 15 μmol m−2 s−1 RL for 3 min, followed by DK for 10 to 17 min. RL was used to accelerate the responses of the cells to DK (Lee and Satter, 1989; Lowen and Satter, 1989). The whole BL/DK cycle was repeated twice for most cells.
Patch-Clamp Procedure
The patch-clamp technique has been described by Hamill et al. (1981) and its application to our system by Satter and Moran (1988) and Moran (1996). Patch-clamp pipettes were pulled from borosilicate glass capillaries (Garner Glass, Claremont, CA) and fire-polished. Their resistance in the experimental solutions was around 50 MΩ. Gentle suction was applied after the patch pipette touched the cell slightly and held until a tight seal was accomplished, which usually took less than 1 min. After tight-seal formation, a hyperpolarizing-holding potential of −40 mV was applied. Voltage stimulus was applied to the cell in the form of a slow, 40- to 60-s long linear ramp from a hyper-polarizing (usually −40 mV) to a depolarizing potential (60–120 mV). The voltage-clamp recording of currents and data analyses were carried out using an Axopatch 200A amplifier and pClamp software (Axon Instruments, Foster City, CA). The current was low-pass filtered at a frequency (−3-dB point) of 20 Hz, digitized at a frequency of 33 to 50 Hz with a TL-1 DMA interface, and stored in the computer for off-line analysis. The liquid-junction potential of −14 mV was calculated based on the differences between the pipette and the bath solutions (Neher, 1992) and added, at the onset of the analysis, to all values of the command (pipette) potential. In the experiment of Figure 2, the liquid-junction potential error (absolute value) was <1 mV.
Determination of Reversal Potential and Single-Channel Conductance
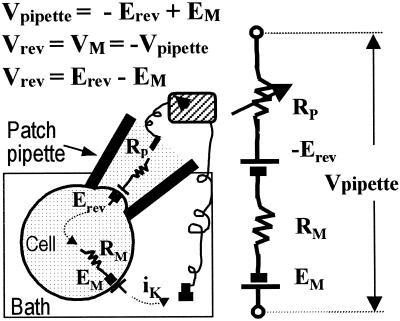
For the ease of comparison with the more frequently encountered whole-cell data, outward currents through the patch membrane are shown as positive (upward) deflections and the applied membrane potential, VM, expresses the potential added at the internal side of the membrane patch relative to the pipette (i.e. it is equal to minus the command (pipette) potential). We define Vrev as VM at which the current through an open channel is nulled (Fig. 9). EM, the true cell membrane potential, is defined as usual as the difference of potential between the cell interior relative to the bath, and Erev, the true unitary current reversal potential, is defined as the zero-current potential at the patch cytoplasmic side relative to the pipette potential.
Figure 9.
A schematics and an equivalent electrical circuit of the cell-attached recording configuration, indicating our nomenclature of the different membrane potentials. Rp and RM are the resistances of the patch membrane and the rest of the whole cell membrane, respectively. Erev and Vrev refer to values of the corresponding membrane potentials when the current through an open channel, iK, is nulled. See text for other definitions.
Unitary currents were plotted versus the linearly varying VM during the ramp. Single-channel conductance was calculated from the equation (following Hodgkin and Huxley, 1952):
 |
1 |
where γK is single KD-channel conductance, and iK is the value of the open single KD-channel current after subtraction of leak (current level in the absence of channel opening). Vrev was determined by linearly extrapolating (idealizing) the open single-channel current level to an intersection with the leak current level (Fig. 1; Moran, 1996).
KD Channel as a Probe for the Estimation of Membrane-Potential Shifts
While the channels in the membrane patch within the pipette rim experience EM (the actual whole cell membrane potential) in addition to VM (the imposed potential), EM is not recorded directly in the cell-attached configuration since the patch pipette is an extracellular electrode. Nevertheless, shifts in EM can be recorded taking advantage of KD-channel activity by using Vrev as if it were a membrane potential probe, according to Equations 2 and 3:
 |
2 |
 |
3 |
Δ denotes the shifts in the corresponding values, and Erev is assumed not to vary between treatments (see “Results”). Thus, an increase (depolarization) in Vrev signifies a decrease (hyperpolarization) of EM.
Quantification of KD-Channel Activity
We averaged three consecutive current records representing each treatment (during 3–7 min of BL or during 10–15 min of DK), obtaining IK, the mean steady-state-channel current. We then calculated the mean net steady-state conductance of the channels in the patch, Gavg, for each VM value using
 |
4 |
and fitted the resulting Gavg to VM relationship with the Boltzmann equation:
 |
5 |
where G′avg is the fit value at each VM, Gmax is the maximum G′avg, E1/2 is the half-maximum-activation voltage, and z is the effective number of gating charges. All of the parameters of Equation 5 were free running during the fit. However, because the values of Vrev varied considerably between cells, and in many cells the fit region extended only to 40 mV beyond Vrev, the parameters could not be determined unequivocally in every case. Therefore, we chose to compare the effects of treatments on the mean values of channel conductance at a depolarization of 40 mV relative to Vrev, G@40. Thus the only use we made of this fit was to average the strongly fluctuating (due to the small number of channels) conductance values to obtain G@40, the value of which was read off the fitted curve.
Statistics
The effects of light treatments on Vrev and G@40 were compared using Student's t test. Means are presented with their se, and the level of significance of difference between means is marked as follows: *P < 0.05; **P < 0.01; ***P < 0.005. In correlation tests, P indicates the level of significance of the difference between R (the coefficient of correlation) and zero.
Solutions
Bath solution contained 1 mm CaCl2, 5 mm KOH/MES (2-[N-morpholino]ethanesulfonic acid) (pH 6.0) and was adjusted to 780 mosmol with sorbitol. Pipette solution contained bath solution plus 20 mm K-Glu and was adjusted to 780 mosmol with sorbitol. In some experiments, DCCD was introduced into the bath by perfusion, after cells were attached to the bottom of the chamber. DCCD was dissolved in ethanol and diluted to a final concentration of 50 to 200 μm. The final concentration of ethanol did not exceed 0.1% (v/v). Cellulase R-10 and pectolyase Y-23 were purchased from Yakult (Tokyo) and Seishin (Tokyo), respectively. Gamborg's B-5 medium was from Gibco-BRL (Grand Island, NY), and all other chemicals were from Sigma (St. Louis). In the experiment of Figure 2, the solutions were changed in order to observe channel activities in the excised (inside-out) patch configuration. The pipette solution contained 5 mm KOH, adjusted with MES to pH 6.0, 1 mm CaCl2, adjusted with sorbitol to 790 mosmol, and the bath solution contained 125 mm KCl, 14 mm KOH, adjusted with HEPES (4-[2-hydroxyethyl]-1-piperazineethanesulfonic acid) to pH 7.5, and with sorbitol to 830 mosmol, roughly approximating the cytosol. Free [Ca2+] of approximately 200 nm in the bath was attained by 2 mm BAPTA-K4 and 1 mm CaCl2 (Moran, 1996).
ACKNOWLEDGMENTS
We devote this work to the memory of our late mentors and friends, Ruth L. Satter and Richard C. Crain with gratitude for their inspiring leadership. We would like to thank S. Kim for the maintenance of S. saman trees and H. Yi for initial setup of patch clamp in the laboratory of Y.L. We also thank J.-U. Hwang for valuable discussions, and Coola for the design of the cover illustration.
Footnotes
This work was supported by the Korea Research Foundation (grant no. BSRI–98–4435), the Basic Science Research Fund of Pohang University of Science and Technology (to Y.L.), the U.S.-Israel Binational Agricultural Research and Development Fund (grant no. IS–2469–94CR), and the German-Israeli Foundation for Scientific Research and Development (grant no. G–384.193.12/94 to N.M.).
LITERATURE CITED
- Assmann SM. Signal transduction in guard cells. Annu Rev Cell Biol. 1993;9:345–375. doi: 10.1146/annurev.cb.09.110193.002021. [DOI] [PubMed] [Google Scholar]
- Bisson MA, Walker NA. Plasamalemma and tonoplast states of the charophyte plasmalemma. In: Marm D, Marr E, Hertel R, editors. Plasamalemma and Tonoplast: Their Functions in the Plant Cell. New York: Elsevier Biomedical; 1982. pp. 35–40. [Google Scholar]
- Blatt MR. Potassium-dependent, bipolar gating of K+ channels in guard cells. J Membr Biol. 1988;102:235–246. [Google Scholar]
- Blatt MR, Gradmann D. K+-Sensitive gating of the K+ outward rectifier in Vicia guard cells. J Membr Biol. 1997;158:241–256. doi: 10.1007/s002329900261. [DOI] [PubMed] [Google Scholar]
- Cho MH, Spalding EP. An anion channel in Arabidopsis hypocotyls activated by blue light. Proc Natl Acad Sci USA. 1996;93:8134–8138. doi: 10.1073/pnas.93.15.8134. [DOI] [PMC free article] [PubMed] [Google Scholar]
- Hamill OP, Marty A, Neher E, Sakmann B, Sigworth FJ. Improved patch-clamp techniques for high-resolution current recording from cells and cell-free membrane patches. Pflüeg Arch. 1981;391:85–100. doi: 10.1007/BF00656997. [DOI] [PubMed] [Google Scholar]
- Hodgkin AL, Huxley AF. A quantitative description of membrane current and its application to conduction and excitation in nerve. J Physiol. 1952;117:500–544. doi: 10.1113/jphysiol.1952.sp004764. [DOI] [PMC free article] [PubMed] [Google Scholar]
- Iglesias A, Satter RL. H+ fluxes in excised Samanea motor tissue: I. Promotion by light. Plant Physiol. 1983;72:564–569. doi: 10.1104/pp.72.2.564. [DOI] [PMC free article] [PubMed] [Google Scholar]
- Ilan N, Schwartz A, Moran N. External protons enhances the activity of the hyperpolarization-activated K+ channel in guard cell protoplasts of Vicia faba. J Membr Biol. 1996;154:169–181. doi: 10.1007/s002329900142. [DOI] [PubMed] [Google Scholar]
- Keller BU, Hedrich R, Raschke K. Voltage-dependent anion channels in the plasma membrane of guard cells. Nature. 1989;341:450–453. doi: 10.1002/j.1460-2075.1990.tb07608.x. [DOI] [PMC free article] [PubMed] [Google Scholar]
- Kim HY, Cot GG, Crain RC. Effects of light on the membrane potential of protoplasts from Samanea saman pulvini. Plant Physiol. 1992;99:1532–1539. doi: 10.1104/pp.99.4.1532. [DOI] [PMC free article] [PubMed] [Google Scholar]
- Kim HY, Cot GG, Crain RC. Potassium channels in Samanea saman protoplasts controlled by phytochrome and the biological clock. Science. 1993;260:960–962. doi: 10.1126/science.260.5110.960. [DOI] [PubMed] [Google Scholar]
- Lee Y. Ion movements that control pulvinar curvature in nyctinastic legumes. In: Satter RL, Gorton HL, Vogelmann TC, editors. The Pulvinus: Motor Organ for Leaf Movement. Rockville, MD: American Society of Plant Physiologists; 1990. pp. 130–141. [Google Scholar]
- Lee Y, Satter RL. Effects of white, blue, red light and darkness on pH of the apoplast in the Samanea pulvinus. Planta. 1989;178:31–40. doi: 10.1007/BF00392524. [DOI] [PubMed] [Google Scholar]
- Lew RR, Kransnoshtein F, Serlin BS, Schauf CL. Phytochrome activation of K+ channels and chloroplast rotation in Mougeotia. Plant Physiol. 1992;98:1511–1514. doi: 10.1104/pp.98.4.1511. [DOI] [PMC free article] [PubMed] [Google Scholar]
- Lin C, Ahmad M, Gordon D, Cashmore AR. Expression of an Arabidopsis cryptochrome gene in transgenic tobacco results in hypersensitivity to blue, UV-A, and green light. Proc Natl Acad Sci USA. 1995;92:8423–8427. doi: 10.1073/pnas.92.18.8423. [DOI] [PMC free article] [PubMed] [Google Scholar]
- Lowen CZ, Satter RL. Light-promoted changes in apoplastic K+ activity in the Samanea saman pulvinus, monitored with liquid membrane microelectrodes. Planta. 1989;179:421–427. doi: 10.1007/BF00397580. [DOI] [PubMed] [Google Scholar]
- Manor D, Moran N. Modulation of small conductance calcium-activated potassium channels in C6 glioma cells. J Membr Biol. 1994;140:69–79. doi: 10.1007/BF00234487. [DOI] [PubMed] [Google Scholar]
- Moran N. The role of ion channels in osmotic volume changes in Samanea motor cells analyzed by patch-clamp methods. In: Satter RL, Gorton HL, Vogelmann TC, editors. The Pulvinus: Motor Organ for Leaf Movement. Rockville, MD: American Society of Plant Physiologists; 1990. pp. 142–159. [Google Scholar]
- Moran N. Membrane-delimited phosphorylation enables the activation of the outward-rectifying K channels in motor cell protoplasts of Samanea saman. Plant Physiol. 1996;111:1281–1292. doi: 10.1104/pp.111.4.1281. [DOI] [PMC free article] [PubMed] [Google Scholar]
- Moran N, Ehrenstein G, Iwasa K, Mischke C, Bare C, Satter RL. Potassium channels in motor cells of Samanea saman. Plant Physiol. 1988;88:643–648. doi: 10.1104/pp.88.3.643. [DOI] [PMC free article] [PubMed] [Google Scholar]
- Moran N, Iwasa K, Ehrenstein G, Mischke C, Bare C, Satter RL. Effects of external K+ on K+ channels in Samanea protoplasts (abstract no. 678) Plant Physiol. 1987;83:S–112. [Google Scholar]
- Moran N, Satter RL. Depolarization-activated inward currents in motor cells of Samanea saman (abstract no. 269) Plant Physiol. 1989;89:S–269. [Google Scholar]
- Moran N, Yueh YG, Crain RC. Signal transduction and cell volume regulation in plant leaflet movements. News Physiol Sci. 1996;11:108–114. [Google Scholar]
- Neher E. Correction for liquid junction potentials in patch clamp experiments. In: Rudy B, Iberson LE, editors. Methods in Enzymology. Vol. 207. San Diego: Academic Press; 1992. pp. 123–131. [DOI] [PubMed] [Google Scholar]
- Nishizaki Y. Vanadate and dicyclohexylcarbodiimide inhibit the blue light-induced depolarization of the membrane in pulvinar motor cells of Phaseolus. Plant Cell Physiol. 1994;35:841–844. [Google Scholar]
- Racusen R, Satter RL. Rhythmic and phytochrome-regulated changes in transmembrane potential in Samanea pulvini. Nature. 1975;255:408–410. doi: 10.1038/255408a0. [DOI] [PubMed] [Google Scholar]
- Satter RL. Leaflet movements and tendril curling. In: Haupt W, Feinleib ME, editors. Encyclopedia of Plant Physiology. Vol. 7. New York: Springer-Verlag; 1979. pp. 442–484. [Google Scholar]
- Satter RL, Galston AW. Mechanisms of control of leaf movements. Annu Rev Plant Physiol. 1981;32:83–110. [Google Scholar]
- Satter RL, Geballe GT, Applewhite PB, Galston AW. Potassium flux and leaf movement in Samanea saman: I. Rhythmic movement. J Gen Physiol. 1974a;64:413–430. doi: 10.1085/jgp.64.4.413. [DOI] [PMC free article] [PubMed] [Google Scholar]
- Satter RL, Geballe GT, Galston AW. Potassium flux and leaf movement in Samanea saman: II. Phytochrome controlled movement. J Gen Physiol. 1974b;64:431–442. doi: 10.1085/jgp.64.4.431. [DOI] [PMC free article] [PubMed] [Google Scholar]
- Satter RL, Moran N. Ionic channels in plant cell membranes. Physiol Plant. 1988;72:816–820. [Google Scholar]
- Schroeder JI, Hagiwara S. Cytosolic calcium regulates ion channels in the plasma membrane of Vicia faba guard cells. Nature. 1989;338:427–430. [Google Scholar]
- Schwartz A, Zeiger E. Metabolic energy for stomatal opening: roles of photophosphorylation and oxidative phosphorylation. Planta. 1984;161:129–136. doi: 10.1007/BF00395472. [DOI] [PubMed] [Google Scholar]
- Serrano EE, Zeiger E, Hagiwara S. Red light stimulates an electrogenic proton pump in Vicia guard cell protoplasts. Proc Natl Acad Sci USA. 1988;85:436–440. doi: 10.1073/pnas.85.2.436. [DOI] [PMC free article] [PubMed] [Google Scholar]
- Spalding EP, Goldsmith MHM. Activation of K+ channels in the plasma-membrane of Arabidopsis by ATP produced photosynthetically. Plant Cell. 1993;5:477–484. doi: 10.1105/tpc.5.4.477. [DOI] [PMC free article] [PubMed] [Google Scholar]
- Spalding EP, Slayman CL, Goldsmith MHM, Gradmann D, Bertl A. Ion channels in Arabidopsis plasma membrane. Plant Physiol. 1992;99:96–102. doi: 10.1104/pp.99.1.96. [DOI] [PMC free article] [PubMed] [Google Scholar]
- Surowy TK, Sussman MR. Immunological cross-reactivity and inhibitor sensitivities of the plasma membrane H+-ATPase from plants and fungi. Biochim Biophys Acta. 1986;848:24–34. [Google Scholar]
- Thuleau P, Moreau M, Schroeder JI, Ranjeva R. Recruitment of plasma membrane voltage-dependent calcium-permeable channels in carrot cells. EMBO J. 1994;13:5843–5847. doi: 10.1002/j.1460-2075.1994.tb06928.x. [DOI] [PMC free article] [PubMed] [Google Scholar]
- Vogelzang SA, Prins HBA. Patch clamp analysis of the dominant plasma membrane K+ channel in root cell protoplasts of Plantago media L: its significance for the P and K state. J Membr Biol. 1994;141:113–122. doi: 10.1007/BF00238245. [DOI] [PubMed] [Google Scholar]
- Wang X, Iino M. Interaction of cryptochrome 1, phytochrome, and ion fluxes in blue-light-induced shrinking of Arabidopsis hypocotyl protoplasts. Plant Physiol. 1998;117:1265–1279. doi: 10.1104/pp.117.4.1265. [DOI] [PMC free article] [PubMed] [Google Scholar]


