

Abstract
Background
Euphorbia lathyris L., a Traditional Chinese medicine (TCM), is commonly used for the treatment of hydropsy, ascites, constipation, amenorrhea, and scabies. Semen Euphorbiae Pulveratum, which is another type of Euphorbia lathyris that is commonly used in TCM practice and is obtained by removing the oil from the seed that is called paozhi, has been known to ease diarrhea. Whereas, the mechanisms of reducing intestinal toxicity have not been clearly investigated yet.
Methods
In this study, the isobaric tags for relative and absolute quantitation (iTRAQ) in combination with the liquid chromatography-tandem mass spectrometry (LC-MS/MS) proteomic method was applied to investigate the effects of Euphorbia lathyris L. on the protein expression involved in intestinal metabolism, in order to illustrate the potential attenuated mechanism of Euphorbia lathyris L. processing. Differentially expressed proteins (DEPs) in the intestine after treated with Semen Euphorbiae (SE), Semen Euphorbiae Pulveratum (SEP) and Euphorbiae Factor 1 (EFL1) were identified. The bioinformatics analysis including GO analysis, pathway analysis, and network analysis were done to analyze the key metabolic pathways underlying the attenuation mechanism through protein network in diarrhea. Western blot were performed to validate selected protein and the related pathways.
Results
A number of differentially expressed proteins that may be associated with intestinal inflammation were identified. They mainly constituted by part of the cell. The expression sites of them located within cells and organelles. G protein and Eph/Ephrin signal pathway were controlled jointly by SEP and SE. After processing, the extraction of SEP were mainly reflected in the process of cytoskeleton, glycolysis and gluconeogenesis.
Conclusions
These findings suggest that SE induced an inflammatory response, and activated the Interleukin signaling pathway, such as the Ang/Tie 2 and JAK2/ STAT signaling pathways, which may eventually contribute to injury result from intestinal inflammatory, while SEP could alleviate this injury by down-regulating STAT1 and activating Ang-4 that might reduce the inflammatory response. Our results demonstrated the importance of Ang-4 and STAT1 expression, which are the target proteins in the attenuated of SE after processing based on proteomic investigation. Thus iTRAQ might be a novel candidate method to study scientific connotation of hypothesis that the attenuated of SE after processing expressed lower toxicity from cellular levels.
Keywords: Euphorbia lathyris, Proteomics, iTRAQ, Bio-pathway
Background
Euphorbia lathyris L. is an effective but toxic traditional Chinese medicine (TCM) derived from the family of euphorbiaceae. It can expel water retention with drastic purgative effects, namely, breaking up the static blood and eliminating masses and is often used for the treatment of hydropsy, ascites, anuresis and constipation, amenorrhea, scabies [1, 2]. It shows several side effects such as irritation and inflammation intense on the skin, mouth and gastrointestinal tract irritation, carcinogenic, and so on. The gastrointestinal mucosa irritation mainly manifested as serious diarrhea. Traditionally, Semen Euphorbiae Pulveratum (SEP), which is another type of Euphorbia lathyris L., is commonly used in TCM practice and is obtained by removing the oil from the seed which is called paozhi. After processing, the toxicity and the capacity of diarrhea was decreased obviously [3]. Interestingly, considerable research efforts have been devoted to the studies on the effect of SEP and SE on diarrhea. Whereas, the intestine protein changes related to intestinal toxicity and the main mechanisms of reducing toxicity by processing of SE remain poorly understood.
With the improvement of two-dimensional polyacrylamide gel electrophoresis (2D-PAGE) and mass spectrometry [4], considerable research efforts have been devoted to the application of proteomics to find possible involved signals in toxic injure induced by some toxins or to determine the modes of action and mechanisms involved in drug- or chemical-induced toxicity [5, 6]. The isobaric tags for relative and absolute quantitation (iTRAQ) technique is one of the most widely used, innovative and common quantitative proteomics approaches that measure the qualitative and quantitative changes in protein content of a cell or tissue in response to treatment or disease and determine protein-protein and protein-ligand interactions [7]. It can simultaneously analyze 4–8 different specimens, thus increasing throughput while reducing experimental error [8, 9]. iTRAQ labeling coupled with LC-MS/MS is sensitive, automated, and multidimensional and can detect large molecules (> 20 kDa) [10]. ITRAQ is suitable for exploratory studies of the processing mechanisms.
In our study, we applied iTRAQ approach to processing for Euphorbia lathyris-induced intestinal toxicity and to identify candidate biomarkers for main mechanisms underlying processing of SE. Bioinformatics analysis including GO analysis, pathway analysis, and network analysis were done to find possible differential pathways. Additionally, the investigation suggested that Euphorbiae factor 1(EFL1), isolated from Euphorbia lathyris, is the main and active diterpenoids which might mediate diarrhea [11]. We also demonstrated EFL1 group to further compare the DEPs induced by SE and SEP. Finally, western blot analysis was applied further to identify candidate biomarkers, and to confirm and validate significance of the proteomic findings. These results provided a first insight into scientific connotation of hypothesis that the attenuated of SE after processing expressed lower toxicity from cellular levels in mice model and described an efficient method for mechanisms of toxic TCM processing.
Methods
Samples
Experimental animals
KM mice (SPF grade, 18–22 g) were purchased from Sibeifu Co., Ltd. (Beijing, China). All experiments were approved by the Animal Care Committee. Mice were kept at room temperature (23 ± 1 °C) and 55 ± 5% humidity. All experiments were conducted in accordance with the Guiding Principles for the Care and Use of Laboratory Animal, as adopted by the Committee on Animal Research at Beijing University of Chinese Medicine.
Extracts preparations of semen euphorbiae and semen euphorbiae Pulveratum
Pieces of Euphorbiae Semen (batch number, 1203070692; origin, Jiangxi province, China) were purchased from Anhui Bozhou HuQiao Chinese Herbal Pieces plant. Petroleum ether extract of Semen Euphorbiae, petroleum ether extract of Semen Euphorbiae Pulveratum was provided by Shandong University of Traditional Chinese Medicine. The extraction and isolation methods of Semen Euphorbiae had been published in these articles [12, 13]. Euphorbiae factor 1 was isolated from the petroleum ether extracts of semen Euphorbia by our team [13, 14].
Proteomics extraction procedures
Protein preparation
After 12 h of fasting, KM mice were randomly divided into 4 groups (n = 10 for each group): the group 1 was served as a control, and received only blank 1% sodium carboxymethyl cellulose solution; meanwhile group 2 was the extracts of SE and group 3 was the extraction of SEP, in which the mice were orally administered at the dose of 1.5 ml/20 g and 1.0 ml/20 g, respectively, with the same amount of crude drug. In order to validate the results induced by SE and SEP, group 4 was administered 20 mg/20 g Euphorbiae factor 1(EFL1) to further verify the protein networks. Mice then received standard diet and water ad libitum. 6 h later, mice were sacrificed, from which the colon were obtained and frozen in liquid nitrogen immediately until they were used for analysis.
Protein isolation
The colon tissue samples were ground into powder in liquid nitrogen, extracted with Lysis buffer (7 M urea (Bio-Rad, 161–0731), 2 M Thiourea (Sigma-Aldrich, T7875), 4% CHAPS (Bio-Rad, 161–0460)) containing complete protease inhibitor Cocktai (Roche, 04693116001). The cell was lysed by sonication at 200 W for 60s and then extracted 30 min at room temperature, centrifuged at 4 °C, 15000 g for 20 min. Before the protein processing, each 5 individual protein samples were mixed equally into 1 specimen. As a result of the strategy, each group contained 2 sample pools, and these sample pools were enrolled to be conducted in subsequent experiments.
Bradford analysis
Total protein concentration of the samples was determined using a Bradford Assay [15]. Standards of BSA were prepared and all samples and standards were analyzed in duplicate. Protein concentrations and standards of BSA were determined at 595 nm on an Multiskan MK3 UV–vis spectrophotometer (Thermo, U.S.) with 10 μL sample reacted with 300 μL Thermo Scientific Pierce Coomassie Plus Bradford Assay (Part No. 23238) 20 min.
Protein reduction, alkylation, and digestion
Filter-aided sample preparation (FASP) method was used to digest protein based on Jacek R Wis’niewski et al. [16]. The 200 μg calculated protein samples were added to centrifuge tube and 25 mM DTT was added and the samples were incubated at 60 °C for 1 h. Samples were incubated for 10 min in the dark after adding 50 mM IAA at room temperature and then centrifuged at 12,000 rpm for 20 min using Ultrafiltration centrifugal tube(NWCO:10 K). 100 μL Dissolution Buffer(iTRAQ ® Kit Dissolution Buffer, AB Sciex, USA, PN:4381664) was added to the filter and centrifuged at 12,000 rpm for 20 min. This step was repeated three times.50 μL trypsin, totally 4 μg, was added and samples were incubated at 37 °C overnight. After trypsin digestion, samples were centrifuged at 12,000 rpm for 20 min, the digested peptides were collected at the bottom of the tube and mixed with 50 μL Dissolution Buffer. Finally 100 μL samples were obtained.
iTRAQ labeling
Each iTRAQ reagent tube (tags-113-121) had 150 μl isopropanol added and vortexed thoroughly, then centrifuged. 50 μl samples (equal to 100 μg digested peptides) were transferred to new tubs and processed according to the manufacturer’s protocol for 8-plex iTRAQ reagent (AB Sciex, PN:4390812) by incubation at RT for 2 h with gentle shaking. The labeled peptide mixtures were then pooled and dried by vacuum centrifugation. Samples were labeled respectively with different isobaric tags as follow: EFL1 samples labeled 113 and 114, control samples labeled 115 and 116, and extraction of SE samples labeled 117 and 118, extraction of SEP samples labeled 119 and 121. The peptides were labeled with the isobaric tags, incubated at room temperature for 2 h. The labeled peptide mixtures were then pooled and dried by vacuum centrifugation.
iTRAQ-labeled peptide fractionation and proteomic analysis by LC-MS/MS
The iTRAQ-labeled peptide mixtures were re-suspended in buffer A (2% ACN, pH 10) and centrifuged at 14,000 g for 20 min. High pH reversed-phase chromatography was performed to separate the trypsin digestion peptide. The supernatant was loaded onto a 4.6 × 250 mm Durashell-C18 containing 5-μm particles. The peptides were eluted at a flow rate of 0.7 mL/min with a 51-min gradient:0-10 min,5.0% B (Mobile phaseA:2%ACN,98%ddH2O,pH 10;Mobile phaseB:98%ACN,2%ddH2O,pH 10);10–13.4 min,5%-8.%B;13.4–31.7 min,8.5%–20.5%B;31.7-41 min,20.5%–31.0%B; 41-46 min,31%–90%B;46-47 min,90.0–95.0%B;47-48 min, 95%–5%B;48-51 min,5%B. The eluted peptides were obtained 40 fractions and finally pooled into 10 fractions through Peak shape.
Then the fraction was re-suspended in 20 μL buffer A (2% ACN, 0.1% FA)and centrifuged at 12,000 rpm for 10 min and 10 μL supernatant was loaded onto a 12 cm × 75 μm EASY-Spray column (C18,3 μm). The samples were loaded at 300 nL/min with mobile phase A: 100% dd H2O/0.1% Formic acid; mobile phase B: 100% ACN/0.1%FA. The gradient as follows:0-13 min,5–8%B;13-90 min,8030%B;90-100 min,30–50%B;100-105 min,50–95%B;105-115 min,95%B;115-116 min,95–5%B;116-126 min,5%B.
The peptides were subjected to Nano-electrospray ionization followed by mass spectrometry (MS/MS) using a Q-Exactive mass spectrometer (Thermo Scientific) coupled with an online micro flow HPLC system. Key parameter settings for the Thermo Q-Exactive mass spectrometer were as follows:
spray voltage floating (ISVF) 2.3KV, Capillary Temperature:320 °C, Ion source: EASY-Spray source, declustering potential (DP) 100 V.
Full MS:Resolution:70000FWHM;Full Scan AGC target:3e6;Full Scan Max.IT:20 ms;Scan range:300-1800 m/z;
dd-MS2:Resolution:17500 FWHM;AGC target:1e5;Maximum IT:120 ms;Intensity threshold:8.30E + 03;Fragmentation Methods:HCD;NCE:32%;Top N:20.
Bioinformatics analysis
Annotations of identified proteins were done with GO for biological processes, molecular functions and cellular component. The analysis were carried out using the Database for Annotation Visualization and Integrated Discovery. Tagged samples were normalized by comparing median protein ratios for the reference channel. Protein quantitative ratios were calculated from the median of all peptide ratios. The proteins with a relative expression of > 1.32 or < 0.68, and with a P-value < 0.05 selected as statistically significance to ensure up- and downregulation authenticity. The selection parameter was based on the overrepresented GO terms with gene enrichment analysis of p < 0.05. The protein lists were further analyzed by UniProt database (http://www.uniprot.org/uniprot/?query=taxonomy:10090) which gave all canonical pathways, interactions, and network construction with significant enrichment of the input proteins based on data from the UniProt Database, Biocarta, etc. [17]
Western blot analysis
Western blot analysis were performed to confirm the presence of differentially expressed proteins. Colons from mouse were washed with ice-cold saline and triturated under Liquid Nitrogen. 200 mg powder were lysed in 1.5 ml RIPA buffer and incubated on ice for 60 min, sonicated for 60s, followed by centrifugation at 12,000×g for 15 min at 4 °C. The total protein concentration was measured using the BCA protein assay kit (Applygen Technologies Inc. Beijing, China). The supernatant lysates were diluted in 5× SDS sample buffer and boiled for 5–10 min.
Proteins from individual samples were separated on SDS-PAGE gels and transferred electrophoretically onto PVDF membranes (Millipore, Billerica, MA, USA). The membranes were blocked for 2 h at room temperature with 3% non-fat dried milk in Tris-buffered saline (TBST, 20 mM Tris-HCl, 137 mM NaCl, and 0.1% Tween 20, pH 7.6). Then, the membranes were incubated overnight at 4 °C in a primary antibody against Anti-STAT1 antibody(Abcam, USA), Rabbit Anti-Angiopoietin 4(Beijing Biosynthesis Biotechnology Co., Ltd.,China), Rabbit and Mouse Anti-β-actin(ZS-Bio. Co., Ltd. Beijing, China). The membranes were then washed with TTBS three times and incubated with horseradish peroxidase-conjugated secondary antibodies (ZS-Bio. Co., Ltd. Beijing, China), Peroxidase-Conjugated Goat anti-Mouse IgG (H + L) (ZB-2305) and Peroxidase-Conjugated Goat anti-Rabbit IgG (H + L) (ZB-2301).Proteins were detected using an enhanced chemiluminescence (ECL) method (Super ECL plus Detection Reagent, Applygen Technologies Inc.P1010). Protein bands were imaged using a ChemiScope 3300 Mini bio-imaging system (Clinx Science Instruments Co., Ltd. (CSI), Shanghai, China). Bands were normalized with β- actin as an internal control. Protein expressions were quantified by chemi analysis and Ang4 and STAT1 were normalized to the beta-actin of each sample. These experiments were each conducted five times.
Results and discussion
Protein profiling
MS raw data files were converted into MGF files using Proteome Discoverer 1.4 (PD 1.4, Thermo), and the MGF data files were searched by using the Mascot search engine (Matrix Science, London, UK; version 2.3.02) to identify proteins. Each confident protein identification involves at least one unique peptide. For protein quantification, it was required that a protein contained at least two unique spectra. The quantitative protein ratios were weighted and normalized by the median ratio in Mascot. As shown in Fig. 1, a total of 393,357 MS/MS spectra which are the secondary mass spectrums were identified by iTRAQ-coupled 2D LC-MS/MS analysis in mice intestine tissues. Among them, 123,136 peptide spectrum-match (PSM) were found. In addition, the LC-MS/MS analysis employed here resulted in identification of 50,007 total peptides with 6727 identified protein groups.
Fig. 1.
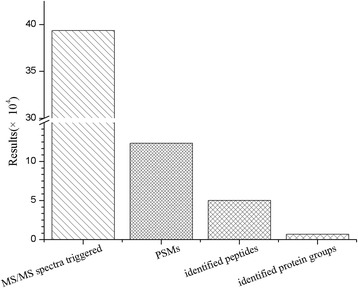
Basic information statistics of proteome by iTRAQ. MS/MS spectra are the secondary mass spectrums, and PSMs are the secondary mass spectrums after quality control. Protein is identified by Proteome Discoverer 1.4 software
Identification of differentially expressed proteins using iTRAQ labeling and LC-MS/MS
Through analysis with software, data were processed using the Proteome Discoverer Software 4.0 utilizing the Mascot (Matrix Science,London, U.K.; version 2.3.0) Algorithm. In this algorithm, Parameters set for the searching were iTRAQ eight plex peptide-labeled, trypsin digestion with only two maximum miss cleavage, carboxymate for cysteine residue and oxidation for methionine. The tolerances were specified as ±15 ppm for peptides and ± 20 mmu for MS/MS fragments. The mice protein database was downloaded from UniProt. The false discovery rate (FDR) was controlled at the 1% level. Distributional normality and homogeneity of variance were tested for numerical data. Values were given as mean ± SD. To reduce probability of false peptide identification, only peptides with a fold change cut-off ratio of > 1.32 or < 0.68 and ones with p-values smaller than 0.05 in the analysis (where P-value < 0.05 indicates > 95% confidence of a change in protein concentration irrespective of the magnitude of the change) was selected to designate differentially expressed proteins. The similar experimental design was described in previous study [18–20]. Among them, proteins that displayed significantly altered expression levels comparing with the control group were considered as up-regulated or down-regulated differentially expressed proteins (DEPs), respectively. With this filter, we identified 103 DEPs in EFL1 group, including 82 up-regulated proteins and 21 down-regulated proteins. Besides, regarding to 70 DEPs from SE-treated group compared to control group, 47 proteins were up-regulated, and 23 proteins were down-regulated. Moreover, there were 96 up-regulated proteins and 26 down-regulated proteins, totaling 122 proteins in the SEP-treated groups were identified relative to control. Further analysis indicated that the three test groups shared 7 DEPs in the colon tissues of mice after intersection, of which, 5 proteins were down-regulated and 2 proteins up-regulated (Table 1). Meanwhile, there were 295 differentially expressed proteins in the colon tissues of mice in union of DEPs of SE and SEP, EFL1, of which, 70 proteins were down-regulated and 225 proteins up-regulated (Table 2). These proteins were subjected to gene-ontology enrichment.
Table 1.
Related information of differentially expressed protein (DEPs) by iTRAQ analysis after intersection
| Acc no. (NCBI) | Prot names | Gene names | Control | SE | SEP | EFL1 |
|---|---|---|---|---|---|---|
| Down-regulated proteins | ||||||
| Q3TMQ6 | Angiogenin-4 | Ang4 | 1 | 0.5795 | 0.6082 | 0.549 |
| Q62010 | Oviduct-specific glycoprotein | Ovgp1 | 1 | 0.4252 | 0.5825 | 0.451 |
| Q80ZA0 | Intelectin-1b (Intelectin-2) | Itln1b | 1 | 0.4847 | 0.6715 | 0.498 |
| Q8R1M8 | Mucosal pentraxin | Mptx1 | 1 | 0.5352 | 0.5652 | 0.559 |
| V9GXU2 | C2 domain-containing protein 3 | C2cd3 | 1 | 0.5372 | 0.636 | 0.463 |
| Up-regulated proteins | ||||||
| F6R782 | IQ domain-containing protein E | Iqce | 1 | 3.496 | 4.4437 | 4.691 |
| Q9D1X0 | Nucleolar protein 3 (Apoptosis repressor with CARD) | Nol3 Arc | 1 | 1.3665 | 1.5167 | 1.345 |
Acc no Accession number, Prot name Protein name, SE Semen Euphorbiae, SEP Semen Euphorbiae Pulveratum, EFL1 Euphorbiae Factor 1
Table 2.
Summary table showing significantly up-regulated or down-regulated proteins identified by iTRAQ Analysis after combine together
| Acc no.(NCBI) | Pro names | Gene names | Control | SE | EFL1 | SEP |
|---|---|---|---|---|---|---|
| Up-regulated | ||||||
| Q62010 | Oviduct-specific glycoprotein | Ovgp1 Chit5 Ogp | 1 | 0.4252 | 0.451 | 0.5825 |
| A2BDX4 | Potassium voltage-gated channel subfamily G member 1 | Kcng1 | 1 | 0.4347 | 0.856 | 0.6645 |
| P97816 | Protein S100-G | S100 g Calb3 S100d | 1 | 0.4485 | 0.599 | 0.653 |
| Q8BV14 | Ankyrin repeat domain-containing protein 55 | Ankrd55 | 1 | 0.4652 | 0.636 | / |
| Q80ZA0 | Intelectin-1b (Intelectin-2) | Itln1b Itln2 Itlnb | 1 | 0.4847 | 0.498 | 0.6715 |
| Q8R1M8 | Mucosal pentraxin | Mptx1 Mptx | 1 | 0.5352 | 0.559 | 0.5652 |
| V9GXU2 | C2 domain-containing protein 3 | C2cd3 | 1 | 0.5372 | 0.463 | 0.636 |
| P07146 | Anionic trypsin-2 | Prss2 Try2 | 1 | 0.5465 | 0.776 | 0.5967 |
| D6RFD6 | Protein RFT1 homolog | Rft1 | 1 | 0.5687 | 0.771 | 4.6342 |
| Q8VCV1 | Alpha/beta hydrolase domain-containing protein 17C | Abhd17c | 1 | 0.5707 | 1.271 | 0.7095 |
| Q3TMQ6 | Angiogenin-4 | Ang4 | 1 | 0.5795 | 0.549 | 0.6082 |
| Q08189 | Protein-glutamine gamma-glutamyltransferase E | Tgm3 Tgase3 | 1 | 0.6085 | 0.728 | 0.528 |
| Q8CIM3 | D-2-hydroxyglutarate dehydrogenase, mitochondrial | D2hgdh | 1 | 0.61 | 0.704 | 1.0195 |
| Q9D7Z6 | Calcium-activated chloride channel regulator 1 | Clca1 | 1 | 0.649 | 0.709 | 0.637 |
| O88273 | Gremlin-2 (Protein related to DAN and cerberus) | Prdc | 1 | 0.6542 | 0.906 | 1.7397 |
| D6RFQ5 | p53 and DNA damage-regulated protein 1 | Pdrg1 | 1 | 0.6585 | 0.683 | 0.6567 |
| Q8BYF6 | Sodium-coupled monocarboxylate transporter 1 | Slc5a8 Smct Smct1 | 1 | 0.6667 | 0.972 | 0.767 |
| H3BLD0 | ATP synthase mitochondrial F1 complex assembly factor 1 | Atpaf1 | 1 | 0.6687 | 0.841 | 0.9637 |
| Q8BXQ3 | Leucine-rich repeat and transmembrane domain-containing protein 1 | Lrtm1 | 1 | 0.6702 | 0.982 | 0.573 |
| A0A075B5L8 | Protein Igkv4–79 | Igkv4–79 | 1 | 0.6722 | 0.688 | 0.8432 |
| Q3V341 | Protein kinase C zeta type | Prkcz | 1 | 0.6775 | 0.606 | 1.052 |
| O88310 | Intelectin-1a | Itln1 | 1 | 0.6782 | 0.696 | 0.7225 |
| Q9D2X6 | Colon SVA-like protein | Sval1 mcsp mCG_17084 | 1 | 0.6782 | 0.912 | 0.5127 |
| Q64339 | Ubiquitin-like protein ISG15 | Isg15 G1p2 Ucrp | 1 | 0.6887 | 0.922 | 0.6737 |
| Q810Q5 | Normal mucosa of esophagus-specific gene 1 protein | Nmes1 | 1 | 0.693 | 0.832 | 0.5877 |
| P21550 | Beta-enolase | Eno3 Eno-3 | 1 | 0.6965 | 0.876 | 0.6672 |
| P56392 | Cytochrome c oxidase subunit 7A1, mitochondrial | Cox7a1 | 1 | 0.7257 | 0.755 | 0.655 |
| P30275 | Creatine kinase U-type, mitochondrial | Ckmt1 | 1 | 0.7492 | 0.851 | 0.6657 |
| Q6T707 | Protein Scd4 (Stearoyl-CoA desaturase-4) | Scd4 | 1 | 0.768 | 1.808 | 1.1152 |
| Q9NYQ2 | Hydroxyacid oxidase 2 (HAOX2) | Hao2 Hao3 Haox2 | 1 | 0.771 | 0.721 | 0.658 |
| P09036 | Serine protease inhibitor Kazal-type 3 | Spink3 | 1 | 0.7765 | 0.987 | 0.595 |
| P98086 | Complement C1q subcomponent subunit A | C1qa | 1 | 0.785 | 0.406 | 0.8317 |
| F8VPP8 | Protein Zc3h7b | Zc3h7b | 1 | 0.7887 | 0.677 | 0.787 |
| Q5RI75–2 | Ras and EF-hand domain-containing protein homolog | Rasef | 1 | 0.7892 | 0.651 | 0.6965 |
| A2AGQ3 | MAP kinase-activating death domain protein | Madd | 1 | 0.7932 | 1.327 | 1.398 |
| E9QNL5 | Sulfotransferase | Sult1a1 | 1 | 0.796 | 0.659 | 0.7287 |
| P00329 | Alcohol dehydrogenase 1 | Adh1 Adh-1 | 1 | 0.7992 | 1.036 | 0.5625 |
| Q3UZZ6 | Sulfotransferase 1 family member D1 | Sult1d1 St1d1 | 1 | 0.81 | 0.632 | 0.7565 |
| B2RT41 | Protein Zfc3h1 | Zfc3h1 Ccdc131 | 1 | 0.831 | 0.921 | 0.6362 |
| P57774 | Pro-neuropeptide Y [Cleaved into: Neuropeptide Y | Npy | 1 | 0.835 | 1.436 | 1.1532 |
| Q3UW68 | Calpain-13 (Calcium-activated neutral proteinase 13) | Capn13 Gm943 | 1 | 0.838 | 0.987 | 0.669 |
| P13634 | Carbonic anhydrase 1 | Ca1 Car1 | 1 | 0.8425 | 0.622 | 0.818 |
| Q9WUG6 | Insulin-like peptide INSL5 (Insulin-like peptide 5) | Insl5 Rif Rif2 Zins3 | 1 | 0.861 | 1.429 | 0.6775 |
| F7BQ76 | MPN domain-containing protein (Fragment) | Mpnd | 1 | 0.8617 | 0.603 | 1.577 |
| P56393 | Cytochrome c oxidase subunit 7B, mitochondrial | Cox7b | 1 | 0.8755 | 1.075 | 0.6255 |
| Q80WK2 | Organic solute transporter subunit beta | Slc51b Ostb | 1 | 0.881 | 1.373 | 1.177 |
| A2A6K0 | Troponin I, fast skeletal muscle | Tnni2 | 1 | 0.886 | 0.374 | 0.965 |
| Q7TPR4 | Alpha-actinin-1 (Alpha-actinin cytoskeletal isoform) | Actn1 | 1 | 0.888 | 0.857 | 0.6745 |
| G3X940 | Histone acetyltransferase | Kat6a Myst3 | 1 | 0.8887 | 1.618 | 1.1427 |
| P01796 | Ig heavy chain V-III region A4 | 0 | 1 | 0.8935 | 1.481 | 1.0095 |
| G3UVW7 | Protein Zfp40 (Zinc finger protein 40) | Zfp40 mCG_13522 | 1 | 0.9052 | 1.53 | 1.0887 |
| Q9EPS2 | Peptide YY | Pyy | 1 | 0.9135 | 1.349 | 0.974 |
| G3XA21 | MCG134445, isoform CRA_a (Protein Mroh1) | Mroh1 Heatr7a | 1 | 0.922 | 1.114 | 1.3435 |
| Q9Z179 | SHC SH2 domain-binding protein 1 | Shcbp1 Pal | 1 | 0.9295 | 1.107 | 1.4725 |
| I6L974 | TBC1 domain family member 17 | Tbc1d17 | 1 | 0.9315 | 1.155 | 1.3645 |
| P01631 | Ig kappa chain V-II region 26–10 | 0 | 1 | 0.9387 | 1.75 | 0.821 |
| P01878 | Ig alpha chain C region | 0 | 1 | 0.942 | 1.332 | 0.8282 |
| P57776–2 | Elongation factor 1-delta (EF-1-delta) | Eef1d | 1 | 0.9477 | 0.898 | 0.6252 |
| D3Z6J0 | HemK methyltransferase family member 2, isoform CRA_b | N6amt1 Hemk2 mCG_130002 | 1 | 0.9562 | 1.524 | 1.4077 |
| Q9WUH1 | Transmembrane protein 115 (Protein PL6 homolog) | Tmem115 Pl6 | 1 | 0.962 | 1.161 | 1.4085 |
| Q8R1U2 | Cell growth regulator with EF hand domain protein 1 | Cgref1 Cgr11 | 1 | 0.9635 | 0.931 | 1.4472 |
| A0A087WNJ2 | Deleted. | 0 | 1 | 0.974 | 0.641 | 0.7125 |
| E0CYM0 | Protein 1700019G17Rik | 1700019G17Rik | 1 | 0.9752 | 1.376 | 1.0687 |
| D3Z7B5 | Protein C330027C09Rik | C330027C09Rik | 1 | 0.978 | 1.336 | 1.1042 |
| D3Z652 | Testis-expressed sequence 35 protein | Tex35 | 1 | 0.9797 | 0.993 | 1.3665 |
| F8VQE9 | ANK repeat and PH domain-containing protein 3 | Agap3 | 1 | 0.9855 | 1.026 | 1.6535 |
| O88665 | Bromodomain-containing protein 7 | Brd7 Bp75 | 1 | 0.9895 | 0.928 | 1.5765 |
| E9Q933 | Transmembrane protein 11, mitochondrial | Tmem11 | 1 | 0.9942 | 1.5 | 1.1595 |
| down-regulated | ||||||
| 6NXH9 | Keratin, type II cytoskeletal 73 | Krt73 Kb36 | 1 | 14.265 | 1.559 | 1.4102 |
| F6R782 | IQ domain-containing protein E | Iqce | 1 | 3.496 | 4.691 | 4.4437 |
| A0A075B6A3 | Protein Igha | Igha | 1 | 2.7217 | 1.208 | 1.9125 |
| P00687 | Alpha-amylase 1 | Amy1 | 1 | 2.5575 | 4.341 | 3.1215 |
| Q8C804 | Spindle and centriole-associated protein 1 | Spice1 Ccdc52 | 1 | 2.3742 | 1.928 | 1.8472 |
| O88273 | Formin-2 | Fmn2 | 1 | 2.2107 | 2.234 | 3.8712 |
| D3Z1G3 | Multiple coagulation factor deficiency protein 2 homolog | Mcfd2 | 1 | 2.2085 | 1.694 | 1.931 |
| A2AHB7 | Potassium channel subfamily T member 1 | Kcnt1 | 1 | 2.181 | 1.35 | 5.51 |
| G3UZX8 | Probable JmjC domain-containing histone demethylation protein 2C | Jmjd1c | 1 | 2.1745 | 1.124 | 3.0692 |
| P35991 | Tyrosine-protein kinase BTK | Btk Bpk | 1 | 2.1057 | 1.302 | 1.5725 |
| P70213 | Friend virus susceptibility protein 1 | Fv1 | 1 | 1.847 | 1.207 | 1.5947 |
| A0A075B664 | Protein Iglv2 | Iglv2 | 1 | 1.8257 | 3.016 | 1.2922 |
| E9Q9F6–2 | Cation channel sperm-associated protein subunit delta | Catsperd Tmem146 | 1 | 1.7907 | 1.132 | 0.6605 |
| P57791 | CAAX prenyl protease 2 | Rce1 Face2 Rce1a | 1 | 1.6772 | 1.103 | 1.4677 |
| Q9QZU9 | Ubiquitin/ISG15-conjugating enzyme E2 L6 | Ube2l6 Ubce8 | 1 | 1.648 | 3.026 | 2.0062 |
| A2AF82 | Activator of 90 kDa heat shock protein ATPase homolog 2 | Ahsa2 | 1 | 1.6057 | 1.363 | 1.5 |
| F8VQM0 | Alkaline phosphatase | Akp3 | 1 | 1.6022 | 1.282 | 2.631 |
| P11034 | Mast cell protease 1 | Mcpt1 | 1 | 1.602 | 1.704 | 1.5607 |
| Q6ZWN5 | 40S ribosomal protein S9 | Rps9 | 1 | 1.5622 | 1.053 | 1.3207 |
| Q9DBB8 | Trans-1,2-dihydrobenzene-1,2-diol dehydrogenase | Dhdh | 1 | 1.5585 | 1.268 | 1.6725 |
| Q6NZQ2 | DEAD/H (Asp-Glu-Ala-Asp/His) box polypeptide 31 | Ddx31 | 1 | 1.5305 | 1.169 | 1.3397 |
| G5E8C3 | G protein-coupled receptor, family C, group 5, member A | Gprc5a mCG_22262 | 1 | 1.5077 | 1.168 | 1.4337 |
| Q91WP6 | Serine protease inhibitor A3N | Serpina3n Spi2 | 1 | 1.502 | 0.995 | 1.2225 |
| A2A3U8 | LON peptidase N-terminal domain and RING finger protein 3 | Lonrf3 | 1 | 1.5017 | 1.274 | 1.9312 |
| P07759 | Serine protease inhibitor A3K | Spi2 | 1 | 1.4825 | 0.804 | 1.2742 |
| Q9DCG2–2 | CD302 antigen | Cd302 Clec13a | 1 | 1.469 | 1.116 | 1.786 |
| P27005 | Protein S100-A8 (Calgranulin-A) | S100a8 Caga Mrp8 | 1 | 1.4637 | 1.522 | 1.154 |
| P04227 | H-2 class II histocompatibility antigen, A-Q alpha chain | H2-Aa | 1 | 1.4617 | 1.382 | 0.916 |
| Q8C6B9 | Active regulator of SIRT1 | Rps19bp1 Aros | 1 | 1.4555 | 1.094 | 1.78 |
| P70412 | CUB and zona pellucida-like domain-containing protein 1 | Cuzd1 Itmap1 | 1 | 1.4365 | 1.325 | 1.5315 |
| Q9D083–3 | Kinetochore protein Spc24 | Spc24 Spbc24 | 1 | 1.4297 | 1.978 | 2.0805 |
| P62984 | Ubiquitin-60S ribosomal protein L40 | Uba52 Ubcep2 | 1 | 1.4247 | 1.336 | 1.143 |
| P12804 | Fibroleukin | Fgl2 Fiblp | 1 | 1.4215 | 1.407 | 1.7527 |
| J3QPY0 | Protein 1600014C10Rik | 1600014C10Rik | 1 | 1.4165 | 1.485 | 1.8247 |
| B1AXR3 | Perilipin-2 | Plin2 | 1 | 1.414 | 0.975 | 1.3562 |
| Q9ESG9 | Membrane-associated tyrosine- and threonine-specific cdc2-inhibitory kinase | Pkmyt1 Myt1 | 1 | 1.4137 | 1.332 | 1.9545 |
| P07758 | Alpha-1-antitrypsin 1–1 (AAT) | Serpina1a Dom1 Spi1–1 | 1 | 1.4085 | 0.908 | 1.1527 |
| Q8C7E9 | Cleavage stimulation factor subunit 2 tau variant | Cstf2t Kiaa0689 | 1 | 1.401 | 1.082 | 1.014 |
| F6ZQQ3 | 26S proteasome non-ATPase regulatory subunit 13 | Psmd13 | 1 | 1.3935 | 1.417 | 2.6332 |
| Q91XL1 | Leucine-rich HEV glycoprotein (Protein Lrg1) | Lrg1 Lrg lrhg | 1 | 1.3932 | 0.949 | 1.327 |
| Q03145 | Ephrin type-A receptor 2 | Epha2 Eck Myk2 | 1 | 1.3932 | 1.186 | 1.522 |
| Q9QXA1 | Cysteine and histidine-rich protein 1 | Cyhr1 Chrp | 1 | 1.3902 | 1.191 | 1.0515 |
| Q8BHZ4 | Zinc finger protein 592 (Zfp-592) | Znf592 Kiaa0211 | 1 | 1.3865 | 1.338 | 1.3052 |
| P07724 | Serum albumin | Alb Alb-1 Alb1 | 1 | 1.3842 | 0.816 | 1.2217 |
| V9GX06 | Protein Gm11214 | Gm11214 | 1 | 1.3835 | 1.098 | 1.3607 |
| P29699 | Alpha-2-HS-glycoprotein (Countertrypin) | Ahsg Fetua | 1 | 1.382 | 0.774 | 1.1715 |
| P14148 | 60S ribosomal protein L7 | Rpl7 | 1 | 1.3705 | 0.953 | 1.1725 |
| P42232 | Signal transducer and activator of transcription 5B | Stat5b | 1 | 1.3705 | 1.627 | 1.311 |
| P35980 | 60S ribosomal protein L18 | Rpl18 | 1 | 1.3695 | 0.963 | 1.176 |
| Q9D1X0 | Nucleolar protein 3 (Apoptosis repressor with CARD) | Nol3 Arc | 1 | 1.3665 | 1.345 | 1.5167 |
| G3X8Z1 | Calcium-activated chloride channel regulator 4A | mCG_119588 | 1 | 1.366 | 1.008 | 1.3725 |
| P01741 | Ig heavy chain V region (Anti-arsonate antibody) | 0 | 1 | 1.3647 | 3.709 | 1.06 |
| A0A087WQ94 | Protein Tns1 | Tns1 | 1 | 1.3562 | 1.117 | 0.9982 |
| A2AAC0 | Chymotrypsin-C | Ctrc | 1 | 1.354 | 1.062 | 1.3185 |
| E9Q8K5 | Titin | Ttn | 1 | 1.3532 | 0.744 | 1.6037 |
| Q3U3Q1–2 | Serine/threonine-protein kinase ULK3 | Ulk3 | 1 | 1.353 | 1.188 | 1.574 |
| Q91YU8 | Suppressor of SWI4 1 homolog | Ppan Ssf1 | 1 | 1.3522 | 1.167 | 1.1937 |
| Q6LC96 | RXR alpha 2 (RXR alpha 3) | Rxra RXR alpha | 1 | 1.329 | 0.984 | 1.2152 |
| Q3UPV6 | Voltage-gated potassium channel subunit beta-2 | Kcnab2 | 1 | 1.328 | 1.568 | 1.183 |
| P62301 | 40S ribosomal protein S13 | Rps13 | 1 | 1.3275 | 1.093 | 1.1617 |
| P22599 | Alpha-1-antitrypsin 1–2 (AAT) (Alpha-1 protease inhibitor 2) | Serpina1b Aat2 | 1 | 1.326 | 0.849 | 1.1235 |
| Q9EP52 | Twisted gastrulation protein homolog 1 | Twsg1 Tsg | 1 | 1.3242 | 1.197 | 0.9917 |
| E9PV04 | Protein Gm8994 | Gm8994 Gm5576 | 1 | 1.3237 | 1.14 | 1.2215 |
| P15119 | Mast cell protease 2 | Mcpt2 | 1 | 1.322 | 1.36 | 1.0482 |
| Q3ZAR9 | Nr2c2 protein (Nuclear receptor subfamily 2 group C member 2) | Nr2c2 | 1 | 1.3202 | 1.395 | 1.158 |
| Q8BSI6 | R3H and coiled-coil domain-containing protein 1 | R3hcc1 | 1 | 1.319 | 1.279 | 1.569 |
| Q32M21–2 | Gasdermin-A2 | Gsdma2 Gsdm2 | 1 | 1.3125 | 1.482 | 1.233 |
| Q80TL0 | Protein phosphatase 1E | Ppm1e Camkn | 1 | 1.3082 | 0.645 | 1.1805 |
| F6RUC3 | Ribonucleoside-diphosphate reductase subunit M2 (Fragment) | Rrm2 | 1 | 1.3075 | 1.238 | 1.4467 |
| A2ALH2 | Putative tRNA | Ftsj1 | 1 | 1.296 | 1.3 | 1.5377 |
| Q8BGS0–2 | Protein MAK16 homolog (Protein RBM13) | Mak16 Rbm13 | 1 | 1.2927 | 1.195 | 1.334 |
| Q8BHY2 | Nucleolar complex protein 4 homolog (NOC4 protein homolog) | Noc4l | 1 | 1.2877 | 1.455 | 1.5922 |
| Q99J23 | GH3 domain-containing protein | Ghdc D11lgp1e | 1 | 1.287 | 1.231 | 1.3732 |
| O35640 | Annexin A8 | Anxa8 Anx8 | 1 | 1.277 | 1.55 | 1.1167 |
| Q60590 | Alpha-1-acid glycoprotein 1 | Orm1 Agp1 Orm-1 | 1 | 1.263 | 1.116 | 1.4175 |
| P35461 | Lymphocyte antigen 6G (Ly-6G) | Ly6g | 1 | 1.2495 | 0.915 | 1.331 |
| P42225 | Signal transducer and activator of transcription 1 | Stat1 | 1 | 1.2437 | 1.533 | 0.9722 |
| Q8VEJ4 | Notchless protein homolog 1 | Nle1 | 1 | 1.2432 | 1.251 | 1.3997 |
| F6S522 | Claspin | Clspn | 1 | 1.2415 | 1.134 | 7.6765 |
| Q8BHN5 | RNA-binding protein 45 | Rbm45 Drb1 Drbp1 | 1 | 1.2387 | 1.232 | 1.4235 |
| P31725 | Protein S100-A9 | S100a9 | 1 | 1.2345 | 1.351 | 1.028 |
| F8WJ43 | Merlin | Nf2 | 1 | 1.234 | 1.168 | 1.441 |
| Q8C3X8 | Lipase maturation factor 2 | Lmf2 Tmem112b Tmem153 | 1 | 1.2307 | 0.928 | 1.5145 |
| E9Q8D0 | Protein Dnajc21 | Dnajc21 | 1 | 1.227 | 1.476 | 1.1372 |
| Q9QXA1–2 | Cysteine and histidine-rich protein 1 | Cyhr1 Chrp | 1 | 1.2205 | 1.374 | 1.054 |
| Q3UW98 | Chloride channel calcium activated 7 | Clca4b AI747448 | 1 | 1.2187 | 1.401 | 1.0597 |
| A0A075B5M8 | Protein Igkv12–38 | Igkv12–38 | 1 | 1.218 | 1.337 | 1.2272 |
| Q4QRL3 | Coiled-coil domain-containing protein 88B | Ccdc88b Ccdc88 | 1 | 1.2172 | 1.485 | 1.392 |
| Q3TBT3–3 | Stimulator of interferon genes protein (mSTING) | Tmem173 Eris Mita | 1 | 1.2167 | 1.441 | 1.1297 |
| P08905 | Lysozyme C-2 (EC 3.2.1.17) (1,4-beta-N-acetylmuramidase C) (Lysozyme C type M) | Lyz2 Lyz Lyzs | 1 | 1.2162 | 1.353 | 1.0305 |
| Q9DCS1 | Transmembrane protein 176A (Gene signature 188) (Kidney-expressed gene 2 protein) | Tmem176a Gs188 Keg2 | 1 | 1.2157 | 1.248 | 1.5587 |
| P84228 | Histone H3.2 | Hist1h3b | 1 | 1.214 | 0.511 | 1.0842 |
| D3Z408 | High affinity cGMP-specific 3′,5′-cyclic phosphodiesterase 9A | Pde9a | 1 | 1.2137 | 1.307 | 1.3392 |
| E9Q4G7 | Casein kinase I isoform alpha | Csnk1a1 | 1 | 1.2105 | 1.47 | 1.643 |
| P05533 | Lymphocyte antigen 6A-2/6E-1 (Ly-6A.2/Ly-6E.1) (Stem cell antigen 1) (SCA-1) (T-cell-activating protein) (TAP) | Ly6a Ly6 | 1 | 1.2085 | 1.378 | 1.1695 |
| P01844 | Ig lambda-2 chain C region | Iglc2 | 1 | 1.2072 | 2.441 | 1.087 |
| G3X8S8 | MCG14499 (tRNA-splicing endonuclease subunit Sen15) | Tsen15 mCG_14499 | 1 | 1.2065 | 1.143 | 1.4907 |
| F6QQ13 | Selenocysteine insertion sequence-binding protein 2-like (Fragment) | Secisbp2l | 1 | 1.2035 | 1.149 | 1.3285 |
| P58501 | PAX3- and PAX7-binding protein 1 (PAX3/7BP) (GC-rich sequence DNA-binding factor 1) | Paxbp1 Gcfc Gcfc1 | 1 | 1.2035 | 1.488 | 1.2637 |
| Q9JLM9 | Growth factor receptor-bound protein 14 (GRB14 adapter protein) | Grb14 | 1 | 1.1975 | 0.601 | 1.1215 |
| P59328–2 | WD repeat and HMG-box DNA-binding protein 1 (Acidic nucleoplasmic DNA-binding protein 1) (And-1) | Wdhd1 And1 | 1 | 1.1922 | 1.221 | 1.4022 |
| A2A5Z6–2 | E3 ubiquitin-protein ligase SMURF2 (EC 6.3.2.-) (SMAD ubiquitination regulatory factor 2) (SMAD-specific E3 ubiquitin-protein ligase 2) | Smurf2 | 1 | 1.1902 | 1.098 | 1.3955 |
| Q8CIA9 | Hippocampus abundant transcript-like protein 1 | Hiatl1 | 1 | 1.1852 | 1.098 | 1.3277 |
| H3BKB9 | Protein zwilch homolog (Fragment) | Zwilch | 1 | 1.1817 | 1.114 | 1.3972 |
| Q5SUA5 | Unconventional myosin-Ig | Myo1g | 1 | 1.1747 | 1.196 | 1.3717 |
| P03991 | H-2 class I histocompatibility antigen, K-W28 alpha chain | H2-K1 H2-K | 1 | 1.1682 | 1.554 | 0.966 |
| Q61542 | StAR-related lipid transfer protein 3 (Protein ES 64) (Protein MLN 64) (START domain-containing protein 3) (StARD3) | Stard3 Es64 Mln64 | 1 | 1.1672 | 1.663 | 1.496 |
| A8C756 | Thyroid adenoma-associated protein homolog | Thada Kiaa1767 | 1 | 1.165 | 1.299 | 1.382 |
| Q80ZI6 | E3 ubiquitin-protein ligase LRSAM1 (EC 6.3.2.-) (Leucine-rich repeat and sterile alpha motif-containing protein 1) (Tsg101-associated ligase) | Lrsam1 | 1 | 1.1627 | 1.094 | 1.59 |
| F6RR81 | Protein cordon-bleu (Fragment) | Cobl | 1 | 1.1585 | 1.355 | 1.1932 |
| Q8R2S8 | CD177 antigen (CD antigen CD177) | Cd177 | 1 | 1.158 | 1.426 | 1.0102 |
| A2ALA0 | Surfeit locus protein 6 | Surf6 | 1 | 1.1567 | 1.218 | 1.3962 |
| Q5SUW0 | Growth factor receptor-bound protein 10 (Fragment) | Grb10 | 1 | 1.1552 | 1.019 | 1.3747 |
| Q9CQS2 | H/ACA ribonucleoprotein complex subunit 3 (Nucleolar protein 10) (Nucleolar protein family A member 3) (snoRNP protein NOP10) | Nop10 Nola3 | 1 | 1.1455 | 1.37 | 1.1737 |
| D3YUW8 | Pogo transposable element with ZNF domain | Pogz | 1 | 1.1365 | 1.373 | 1.3605 |
| Q62293 | Interferon-gamma-inducible GTPase Ifggb5 protein | Tgtp | 1 | 1.1357 | 1.958 | 1.0067 |
| Q8BX57–3 | PX domain-containing protein kinase-like protein (Modulator of Na,K-ATPase) (MONaKA) | Pxk | 1 | 1.1355 | 0.867 | 1.3607 |
| E0CYU9 | Sjoegren syndrome/scleroderma autoantigen 1 homolog | Sssca1 | 1 | 1.135 | 1.705 | 1.5802 |
| Q9R0X0–3 | Mediator of RNA polymerase II transcription subunit 20 (Mediator complex subunit 20) (TRF-proximal protein homolog) | Med20 Trfp | 1 | 1.1335 | 1.088 | 1.3255 |
| P18527 | Ig heavy chain V region 914 | 0 | 1 | 1.133 | 1.071 | 0.618 |
| A2A6A1 | G patch domain-containing protein 8 | Gpatch8 Gpatc8 Kiaa0553 | 1 | 1.1295 | 1.861 | 1.0447 |
| O35242 | Protein FAN (Factor associated with neutral sphingomyelinase activation) (Factor associated with N-SMase activation) | Nsmaf Fan | 1 | 1.1275 | 1.116 | 1.417 |
| P04184 | Thymidine kinase, cytosolic (EC 2.7.1.21) | Tk1 Tk-1 | 1 | 1.1222 | 1.288 | 1.638 |
| Q80VC9–2 | Calmodulin-regulated spectrin-associated protein 3 (Protein Nezha) | Camsap3 Kiaa1543 | 1 | 1.1107 | 1.308 | 1.492 |
| S4R2K0 | Protein Pdf | 1 | 1.1082 | 1.644 | 1.4732 | |
| Q8BZR9 | Uncharacterized protein C17orf85 homolog | 0 | 1 | 1.108 | 1.132 | 1.6712 |
| Q8K4Q0–5 | Regulatory-associated protein of mTOR (Raptor) (p150 target of rapamycin (TOR)-scaffold protein) | Rptor Raptor | 1 | 1.105 | 1.153 | 1.4442 |
| Q6P9L6 | Kinesin-like protein KIF15 (Kinesin-like protein 2) (Kinesin-like protein 7) | Kif15 Klp2 Knsl7 | 1 | 1.1012 | 1.367 | 1.3967 |
| Q9CR76 | Transmembrane protein 186 | Tmem186 | 1 | 1.0997 | 0.655 | 1.0117 |
| Q924Z6–2 | Exportin-6 (Exp6) (Ran-binding protein 20) | Xpo6 Ranbp20 | 1 | 1.0997 | 1.209 | 1.5217 |
| Q8BZT5 | Leucine-rich repeat-containing protein 19 | Lrrc19 | 1 | 1.0952 | 1.379 | 1.2207 |
| P11247 | Myeloperoxidase (MPO) (EC 1.11.2.2) [Cleaved into: Myeloperoxidase light chain; Myeloperoxidase heavy chain] | Mpo | 1 | 1.0945 | 1.195 | 1.415 |
| A8DUK4 | Beta-globin (Protein Hbb-bs) (Protein Hbb-bt) | Hbbt1 Hbb-bs Hbb-bt Hbbt2 | 1 | 1.0942 | 2.14 | 0.8445 |
| P01630 | Ig kappa chain V-II region 7S34.1 | 0 | 1 | 1.094 | 1.405 | 1.2252 |
| Q8CGN5 | Perilipin-1 (Lipid droplet-associated protein) (Perilipin A) | Plin1 Peri Plin | 1 | 1.0895 | 0.885 | 1.3687 |
| Q9CQT2 | RNA-binding protein 7 (RNA-binding motif protein 7) | Rbm7 | 1 | 1.0877 | 1.142 | 1.333 |
| F7BJK1 | Protein Pcdh1 (Fragment) | Pcdh1 | 1 | 1.0875 | 0.927 | 1.8367 |
| Q80TA6–2 | Myotubularin-related protein 12 | Mtmr12 Kiaa1682 | 1 | 1.0835 | 1.091 | 1.5237 |
| P54754 | Ephrin type-B receptor 3 (EC 2.7.10.1) (Developmental kinase 5) (mDK-5) (Tyrosine-protein kinase receptor SEK-4) | Ephb3 Etk2 Mdk5 Sek4 | 1 | 1.082 | 1.341 | 1.1597 |
| D3Z769 | Protein lin-37 homolog (Fragment) | Lin37 | 1 | 1.0795 | 1.116 | 1.5232 |
| A0A075B5X9 | Ig heavy chain V region B1–8/186–2 (Fragment) | Ighv1–72 | 1 | 1.0795 | 1.415 | 1.2 |
| F6TLB0 | DNA-directed RNA polymerase, mitochondrial (Fragment) | Polrmt | 1 | 1.077 | 1.111 | 1.3495 |
| A0A087WRI5 | Adenylate kinase isoenzyme 6 | Ak6 | 1 | 1.075 | 1.346 | 1.1457 |
| Q8BK35 | MCG2065, isoform CRA_c (PreS1 binding protein) (Protein Gltscr2) | Gltscr2 mCG_2065 | 1 | 1.074 | 0.953 | 1.557 |
| Q9CQT0 | tRNA(His) guanylyltransferase (EC 2.7.7.79) (tRNA-histidine guanylyltransferase) | Thg1l mCG_22296 | 1 | 1.0722 | 1.14 | 1.4462 |
| A0A075B677 | Protein Igkv4–53 | Igkv4–53 | 1 | 1.0705 | 1.361 | 0.986 |
| G3UWZ0 | Bromodomain adjacent to zinc finger domain protein 1A | Baz1a | 1 | 1.0702 | 1.564 | 1.3232 |
| F6R2G3 | Mucin-4 (Fragment) | Muc4 | 1 | 1.0695 | 1.286 | 1.3432 |
| Q6GU68 | Immunoglobulin superfamily containing leucine-rich repeat protein | Islr | 1 | 1.068 | 1.154 | 1.3577 |
| E9PWH6 | HEAT repeat-containing protein 3 | Heatr3 | 1 | 1.0605 | 1.102 | 1.4625 |
| Q8BLH7 | HIRA-interacting protein 3 | Hirip3 | 1 | 1.0587 | 1.496 | 1.4912 |
| Q62264 | Thyroid hormone-inducible hepatic protein (Spot 14 protein) (S14) (SPOT14) | Thrsp S14 | 1 | 1.0582 | 0.943 | 1.4015 |
| Q99M73 | Keratin, type II cuticular Hb4 (65 kDa type II keratin) (Keratin-84) (K84) (Type II hair keratin Hb4) (Type-II keratin Kb24) | Krt84 Krt2–16 Krthb4 | 1 | 1.0557 | 1.17 | 1.3252 |
| Q9D856 | Zinc transporter ZIP5 (Solute carrier family 39 member 5) (Zrt- and Irt-like protein 5) (ZIP-5) | Slc39a5 Zip5 | 1 | 1.0555 | 1.484 | 1.4005 |
| F7BJB9 | Protein Morc3 | Morc3 | 1 | 1.0525 | 1.375 | 1.2087 |
| B7ZWM8 | Leucine-rich repeat and calponin homology domain-containing protein 3 (Lrch3 protein) | Lrch3 | 1 | 1.0505 | 1.128 | 1.3452 |
| D3Z6K8 | Ras-specific guanine nucleotide-releasing factor 2 | Rasgrf2 | 1 | 1.0482 | 1.047 | 1.3875 |
| Q5FWI3 | Transmembrane protein 2 | Tmem2 Kiaa1412 | 1 | 1.0462 | 1.163 | 1.4667 |
| G3UZL2 | RCC1 and BTB domain-containing protein 1 (Fragment) | Rcbtb1 | 1 | 1.0417 | 1.433 | 1.2967 |
| Q61666–4 | Protein HIRA (TUP1-like enhancer of split protein 1) | Hira Tuple1 | 1 | 1.0405 | 1.127 | 1.3862 |
| P53569 | CCAAT/enhancer-binding protein zeta (CCAAT-box-binding transcription factor) (CBF) (CCAAT-binding factor) | Cebpz Cbf2 Cebpa-rs1 | 1 | 1.0367 | 1.325 | 1.7395 |
| Q9JJF3 | Bifunctional lysine-specific demethylase and histidyl-hydroxylase NO66 (EC 1.14.11.-) (EC 1.14.11.27) (Histone lysine demethylase NO66) | No66 Mapjd MNCb-7109 | 1 | 1.0337 | 1.68 | 1.1642 |
| Q9DAA6 | Exosome complex component CSL4 (Exosome component 1) | Exosc1 Csl4 | 1 | 1.033 | 1.326 | 1.2455 |
| A0A087WQR9 | NEDD8-conjugating enzyme UBE2F (Fragment) | Ube2f | 1 | 1.0292 | 1.352 | 1.2977 |
| Q9Z0E6 | Interferon-induced guanylate-binding protein 2 (GTP-binding protein 2) (GBP-2) (mGBP-2) (mGBP2) (Guanine nucleotide-binding protein 2) | Gbp2 | 1 | 1.0292 | 1.432 | 0.9467 |
| B7ZMP1–2 | Probable Xaa-Pro aminopeptidase 3 (X-Pro aminopeptidase 3) (EC 3.4.11.9) (Aminopeptidase P3) (APP3) | Xpnpep3 | 1 | 1.0285 | 0.927 | 1.4122 |
| D3YWR2 | B-cell linker protein | Blnk | 1 | 1.0237 | 1.595 | 1.1195 |
| H7BX32 | Nuclear envelope pore membrane protein POM 121 | Pom121 | 1 | 1.0165 | 1.187 | 1.3717 |
| Q99N87 | 28S ribosomal protein S5, mitochondrial (MRP-S5) (S5mt) | Mrps5 | 1 | 1.0147 | 1.41 | 0.9545 |
| Q8CBC4 | Consortin | Cnst | 1 | 1.0092 | 1.33 | 1.19 |
| A2AER8 | Polyglutamine-binding protein 1 | Pqbp1 | 1 | 1.0077 | 1.477 | 0.9262 |
| A8Y5N4 | 17-beta-hydroxysteroid dehydrogenase 13 | Hsd17b13 | 1 | 1.006 | 0.603 | 0.7325 |
| Q9D8I1 | Marginal zone B- and B1-cell-specific protein | Mzb1 Pacap | 1 | 1.006 | 1.348 | 0.9347 |
| P26618 | Platelet-derived growth factor receptor alpha | Pdgfra | 1 | 1.0032 | 1.152 | 1.4392 |
| P55088–2 | Aquaporin-4 (AQP-4) | Aqp4 | 1 | 1.0005 | 1.327 | 0.8442 |
Acc no Accession number, Prot name Protein name, SE Semen Euphorbiae, SEP Semen Euphorbiae Pulveratum, EFL1 Euphorbiae Factor 1
GO ontology analysis
To elucidate the biological significance of these differentially modified proteins, we performed GO analysis and categorized these proteins according to their molecular function and biological process using the GO database. 295 union proteins were selected and separated into 3 categories: biological processes (Fig. 2a), cellular component association (Fig. 2b), and molecular function (Fig. 2c).
Fig. 2.
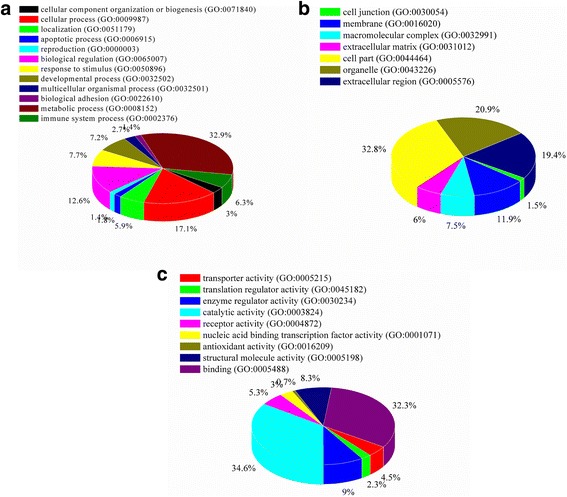
Bioinformatics analysis of the differentially expressed proteins (ratio ≥ 1.32 or ≤ 0.68 fold). a Biological process (b) Cellular component; (c). Molecular function
In the biological process category, the results suggested that most of the DEPs participate in metabolic processes (32.9%), cellular processes (17.10%), biological regulation (12.6%), and response to stimulus (7.70%). In the cellular component analysis, most of the potential biomarkers are concentrated in the cell part (32.80%), organelle (20.90%), extracellular region (19.40%), membrane (11.90%) or macromolecular complex. In the molecular function analysis, the differentially expressed proteins were found to play a role in catalytic activity (34.60%), binding (32.30%), enzymatic activity (9.00%) and structural molecule activity (8.30%),suggesting that their related functions were important in the colon of mice.
On the basis of our findings, it could be concluded that the identified DEPs causing by SE, SEP and EFL1 were mainly associated with the cellular part. The expression sites of them located within cells and organelles. G protein and Eph/Ephrin signal pathway were controlled jointly by SE and SEP. After processing, the extracts of SEP were mainly reflected in the process of cytoskeleton, glycolysis and gluconeogenesis.
Pathway enrichment analysis and interaction network analysis
MetaCore™ (version 6.18) is an integrated software suite for functional analysis of experimental data. Differential pathways among SE, SEP, EFL1 and control were conducted according to the P Value (P < 0.05). All the differential pathways were shown in Tables 3, 4 and 5.
Table 3.
Pathway Enrichment analysis of differentially expressed proteins relative to SE compared with control group
| NO | Maps | pValue |
|---|---|---|
| 1 | Immune response_Oncostatin M signaling via JAK-Stat in mouse cells | 0.000195 |
| 2 | Immune response_Oncostatin M signaling via JAK-Stat in human cells | 0.000242 |
| 3 | Development_Thrombopoetin signaling via JAK-STAT pathway | 0.000294 |
| 4 | Immune response_IL-15 signaling via JAK-STAT cascade | 0.000322 |
| 5 | Development_Transcription factors in segregation of hepatocytic lineage | 0.000552 |
| 6 | Immune response_IL-7 signaling in T lymphocytes | 0.000887 |
| 7 | Immune response_IL-7 signaling in B lymphocytes | 0.001136 |
| 8 | Cell adhesion_Ephrin signaling | 0.001244 |
| 9 | Neurophysiological process_Receptor-mediated axon growth repulsion | 0.001244 |
| 10 | Immune response_IL-5 signaling | 0.001300 |
| 11 | Signal transduction_PTMs in IL-12 signaling pathway | 0.001415 |
| 12 | G-protein signaling_Rap1B regulation pathway | 0.013047 |
| 13 | Protein folding_Membrane trafficking and signal transduction of G-alpha (i) heterotrimeric G-protein | 0.022438 |
| 14 | Immune response_IL-12 signaling pathway | 0.027103 |
| 15 | Development_Glucocorticoid receptor signaling | 0.028266 |
Table 4.
Pathway Enrichment analysis of differentially expressed proteins relative to SEP compared with control group
| NO | Maps | pValue |
|---|---|---|
| 1 | Cytoskeleton remodeling_Role of PDGFs in cell migration | 0.002188 |
| 2 | Glycolysis and gluconeogenesis p.3 / Human version | 0.002188 |
| 3 | Glycolysis and gluconeogenesis p.3 | 0.002188 |
| 4 | Development_PDGF signaling via STATs and NF-kB | 0.003877 |
| 5 | Normal and pathological TGF-beta-mediated regulation of cell proliferation | 0.004119 |
| 6 | Cell adhesion_Ephrin signaling | 0.007559 |
| 7 | Neurophysiological process_Receptor-mediated axon growth repulsion | 0.007559 |
| 8 | Development_PDGF signaling via MAPK cascades | 0.008224 |
| 9 | Some pathways of EMT in cancer cells | 0.009631 |
| 10 | Aberrant B-Raf signaling in melanoma progression | 0.011137 |
| 11 | Transport_Macropinocytosis regulation by growth factors | 0.014439 |
| 12 | Glycolysis and gluconeogenesis (short map) | 0.015773 |
| 13 | G-protein signaling_Rap1B regulation pathway | 0.031748 |
| 14 | Cell adhesion_Chemokines and adhesion | 0.034254 |
| 15 | Cytoskeleton remodeling_Cytoskeleton remodeling | 0.035519 |
Table 5.
Pathway Enrichment analysis of differentially expressed proteins relative to EFL1 compared with control
| NO. | Maps | pValue |
|---|---|---|
| 1 | Development_Angiopoietin - Tie2 signaling | 0.000027 |
| 2 | Immune response_IL-7 signaling in T lymphocytes | 0.000035 |
| 3 | Immune response_IL-7 signaling in B lymphocytes | 0.000051 |
| 4 | Immune response_Antiviral actions of Interferons | 0.000090 |
| 5 | Immune response_Oncostatin M signaling via JAK-Stat in mouse cells | 0.000425 |
| 6 | Immune response_Oncostatin M signaling via JAK-Stat in human cells | 0.000526 |
| 7 | Development_Thrombopoetin signaling via JAK-STAT pathway | 0.000639 |
| 8 | Immune response_IL-15 signaling via JAK-STAT cascade | 0.000699 |
| 9 | Immune response_IL-23 signaling pathway | 0.000827 |
| 10 | Signal transduction_PTMs in IL-23 signaling pathway | 0.001274 |
| 11 | Development_PDGF signaling via STATs and NF-kB | 0.001357 |
| 12 | Immune response_IL-22 signaling pathway | 0.001532 |
| 13 | Development_EPO-induced Jak-STAT pathway | 0.001623 |
| 14 | Development_Growth hormone signaling via STATs and PLC/IP3 | 0.001623 |
| 15 | Immune response_IL-9 signaling pathway | 0.001717 |
Comparing with group 1(control), the pathways with higher activity were mainly related to the immune response, and also related to other physiological processes such as development and G protein pathways; the dominant signaling pathways were interleukin signaling pathway, JAK/Stat et al.; the key proteins involved in multiple pathways contain STAT1, SERPINA3, G protein Rap1B and so on. Meanwhile, group 4 (EFL1) showed that the physiological process with high activity was relatively simple, mainly focused on the immune response and development process. Interleukin signaling pathways, Ang/Tie 2 and NF/kB were found to be the main signaling pathways and the key proteins involved were STAT1 and STAT5; compared with control, group 3 induced cytoskeleton remodeling, glycolysis and gluconeogenesis with higher activities, signaling pathways which contain a variety of major B-Raf pathways, epithelial cells to interstitial cell transition(EMT)-related signaling pathways, cell endocytosis, etc. and PDGF receptors, Ephrin receptors,in which STAT 1 was related to the key proteins.
A network was constructed by protein-protein interaction of the 295 significantly DEPs basing on Analyze Network Algorithm using MetaCore in Fig. 3 (A-D). (Tables 6 and 7).
Fig. 3.
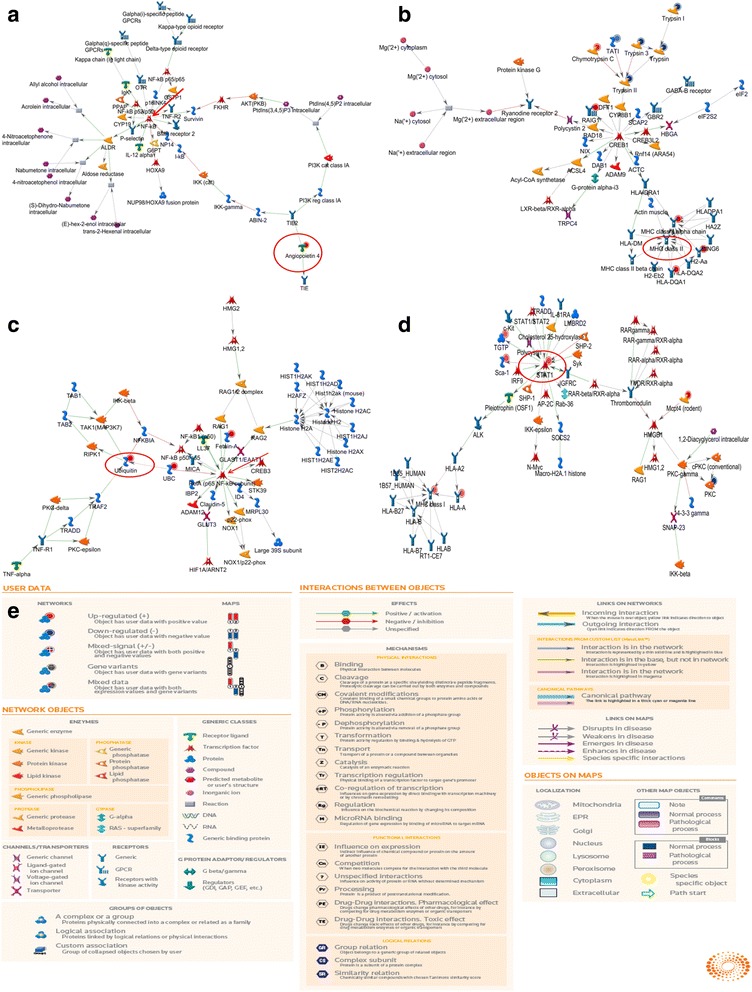
Biological networks generated by different groups. a Protein interaction networks of DEPs from four groups after taking the intersection; b, c and d: protein interaction networks of DEPs from four groups after taking union (b: Major Histocompatibility Complex class IInetwork; c: Ubiquitination in Mediating the Cellular Stress Response; d: Interferon-γ-mediated signal transduction and response network); e Explanation of various symbols in the network map. The network of significantly differentially expressed proteins (ratio ≥ 1.32 or ≤ 0.68 fold) was analyzed by MetaCoreTM(version 6.18)software
Table 6.
Intersection of differentially expressed protein Networks
| Network | GO processes | Total nodes | Seed nodes | p-Value | zScore | gScore |
|---|---|---|---|---|---|---|
| Angiopoietin 4, NF-kB, ALDR, TIE2, ATP + PtdIns(4,5)P2 = ADP + PtdIns(3,4,5)P3 | response to oxygen-containing compound (70.6%; 1.570e-16), regulation of multicellular organismal process (76.5%; 2.094e-15), response to peptide (47.1%; 1.618e-14), response to stress (82.4%; 2.570e-14), positive regulation of cellular process (88.2%; 3.104e-14) | 51 | 1 | 0.00245 | 20.16 | 22.66 |
Table 7.
Union of differentially expressed protein Networks
| Network | GO processes | p-Value | zScore | gScore |
|---|---|---|---|---|
| Trypsin II, Chymotrypsin C, Trypsin 3, TATI, RAIG1 | antigen processing and presentation of peptide or polysaccharide antigen via MHC class II (27.3%; 6.498e-17) | 1.010E-21 | 48.76 | 48.76 |
| Ubiquitin, Fetuin-A, UBC, RelA (p65 NF-kB subunit), TRAF2 | regulation of response to stress (56.5%; 6.254e-19), positive regulation of NF-kappaB transcription factor activity (28.3%; 2.556e-17) | 1.140E-05 | 14.33 | 44.33 |
| STAT1, TGTP, Mcpt4 (rodent), Sca-1, Thrombomodulin | interferon-gamma-mediated signaling pathway (31.9%; 8.694e-24), response to interferon-gamma (36.2%; 1.175e-23) | 2.970E-14 | 33.37 | 33.37 |
Obviously, commonly pathways are mainly interleukin-mediated signaling pathways, including IL-7, IL-15, IL-23 and other inflammatory factors both controlled by EFL1 and SE groups. We supposed that these inflammatory factors activate the interleukin signaling pathway, NF / kB signaling pathway, and then mediate intestinal mucosal barrier injure by up-regulating inflammatory proteins expression which resulting in inflammatory response. While there is no obvious interleukin-mediated inflammatory response in SEP group. Generally speaking, inflammatory response especially interleukin might be closely related to the attenuated mechanism of Semen Euphorbiae.
According to network analysis, four reliable functional networks were found and analyzed. After intersection of four groups, the main protein interaction network was multicellular organism regulation process (only Angiopoietin 4 is the down-regulated differentially expressed protein and NF-κB is a pivotal role which interacts with other proteins in the network most closely, Fig. 3a). DEPs which were taken together mainly participated in the protein interaction networks as shown in Fig. 3b, c and d. MHC II presents endogenous and exogenous antigenic peptides or antigenic polysaccharides (containing 10 differential proteins, the key point is MHC class II in Fig. 3b), stress response (containing 3 up-regulation differential proteins, RelA/P65 and ubiquitin are the central part of network, Fig. 3c), γ- Interferon - mediated signal transduction and response (containing 6 up-regulation,1 down-regulation differential proteins, as shown in Fig. 3d, STAT1 interacted closely with other proteins and play an important role in the networks).
It should be pointed out that Angiopoietin 4 is the only down-regulated differential expressed protein in the interaction network. Subsequently, STAT1 was found to be the key protein shared by the EFL1, SEP and SE tested groups, compared with the control group. A previous study has implied that the transcription factor NF-κB (nuclear factor kappa B) plays a central role in the regulation of immune and inflammatory responses, as well as in control of cell apoptosis. These proteins participate in the regulation of a wide range of genes involved in immune, inflammatory and apoptosis function [21]. Although the relationship between Angiopoietin 4 and NF-κB has not been reported, according to the network, we could make the hypothesis that SE could increase Angiopoietin 4 and then activate NF-κB to make the body produce immune or inflammatory response. In addition, interferons (IFNs) are important cytokines that play essential roles in antiviral, antibacterial, antitumor and immunomodulatory activities. IFNs primarily signals through the JAK-STAT pathway leading to the activation of signal transducer and activator of STAT and subsequent transcription of target genes [22]. Based on the pathway analysis, IFN-γ could activate STATs through JAK-STAT signal pathway to initiate CIITA (typeIItranscription activator) which as MHC IItrans activator, and then the expression of MHC II were up-regulated to produce immune response and immune regulation so that the mice have diarrhea symptoms after treated with SE group. For these reasons and hypothesis, western blot analysis was then conducted to validate the two differentially expressed proteins- STAT1 and Angiopoietin 4.
Validation of differentially expressed proteins identified by proteomics
Two proteins, STAT1 and Angiopoietin 4 identified DEPs with marked differences in expression determined by iTRAQ based quantitative analysis were selected to be verified by western blot analysis (Figs. 4 and 5). As depicted in Figs. 4 and 5 and Table 8, Angiopoietin 4 protein was significantly down-regulated in SEH, SEPH and EFLH groups as compared with control group (p < 0.05), the expression level of Ang4 in SEH was the lowest; and STAT1 was up-regulated in SEH, SEPH and EFLH groups, which levels were all higher than control group (p < 0.05). Moreover, the groups of low dose of SEL, SEPL and EFLL have no significant differences compared with the control. The results which were found by western blot is consistent with the findings in iTRAQ analysis. Both of Ang-4 and STAT1 expression levels in the mice colon tissue may be dose-dependent with the increase dose of SE and SEP.
Fig. 4.
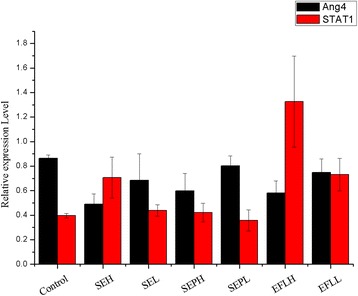
Relative expression levels of Ang4 and STAT1were normalized to the β-actin which were quantified by densitometric analysis. These experiments were each conducted five times
Fig. 5.
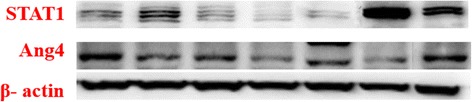
Western blotting showing the changes in Ang4 and STAT1 level in mice intestine treated with different doses of SE, SEP and EFL1 with respect to control-treated mice intestine
Note:Internal reference:β- actin,1.Control, 2.High-dose of SE (SEH, 1.5 ml/20 g), 3.low-dose of SE (SEL, 0.5 ml/20 g), 4. High-dose of SEP (SEPH, 1.0 ml/20 g), 5. Low-dose of SEP (SEPL, 0.33 ml/20 g), 6.High-dose of EFL1 (EFLH, 20 mg/20 g), 7 Low-dose of EFL1 (EFLL, 10 mg/20 g)
Table 8.
The relative expression of Ang4 and STAT1 in intestinal tissue of mice (±S, n = 5)
| groups | Ang4 | STAT1 |
|---|---|---|
| Control | 0.865 ± 0.027 | 0.396 ± 0.019 |
| SEH | 0.489 ± 0.084* | 0.706 ± 0.167* |
| SEL | 0.683 ± 0.218 | 0.439 ± 0.046 |
| SEPH | 0.598 ± 0.142* | 0.421 ± 0.076 |
| SEPL | 0.803 ± 0.080 | 0.358 ± 0.086 |
| EFLH | 0.582 ± 0.098* | 1.326 ± 0.372* |
| EFLL | 0.749 ± 0.111 | 0.731 ± 0.133 |
Note: *compared with control (P < 0.05)
It is well established that the angiopoietin (Ang) family of growth factors includes Ang1, Ang2, Ang3 and Ang4, all of which bind to the endothelial receptor tyrosine kinase Tie2. Ang3 (mouse) and Ang4 (human) are interspecies orthologs. Tie2 [23] maintains the vascular integrity of mature vessels by enhancing endothelial barrier function and inhibiting apoptosis of endothelial cells. According to the pathway network analysis, as shown in Fig. 3a, we speculated that Semen Euphorbiae might inhibit the expression of Ang-4, which Tie-2 couldn’t be activated, so that the steady state of endothelial cells was broken and the sensitivity of various inflammatory mediators increased, permeability, and thus promoted the occurrence of inflammatory response. The inhibition of Ang 4 by SEP group after processing was weakened comparing to SE group, resulting in lower diarrhea and inflammatory response.
STAT1 has been implicated as a mediator of biological responses to a variety of growth factors and cytokines, based on ligand-dependent tyrosine phosphorylation and activation. Stat1 is a functional transcription factor even in the absence of inducer-mediated activation, participating in the constitutive expression of some genes [24]. JAK2/ STAT pathway signaling is activated by a wide array of cytokines and growth factors leading to the stimulation of cell proliferation, differentiation, and apoptosis [25]. And it is an important way of signal transduction of inflammatory factors.
In addition to being involved in the main JAK2 / STAT signaling pathway, STAT1 could be activated by JAK2 (non-receptor tyrosine) kinase, but also by inflammatory factors such as interleukin-6 (IL-6), tumor necrosis factor (TNF),growth factors such as interferon (IFN) [26], epidermal growth factor (EGF), platelet-derived growth factor (PDGF) and other signal activation.
As the up-regulated proteins induced by each group, STAT1 was induced by SEP group lower than the SE group so that we suspected that STAT 1 was most likely one of target proteins related to intestinal inflammation which might illustrate the attenuated mechanism of Semen Euphorbiae.
Both Ang-4 and STAT1 were surmised to be one of the target proteins inducing by Semen Euphorbiae.
Conclusions
This study used iTRAQ labeling followed by 2D-LC-MS/MS for the quantitative proteomic analysis of intestine samples from KM mice with different groups and control to discover candidate biomarkers for attenuated mechanism of Semen Euphorbiae processing for the first time. These findings suggest that SE induced an inflammatory response, and activated the Interleukin signaling pathway, such as the Ang/Tie 2 and JAK2/ STAT signaling pathways, which may eventually contribute to injury result from intestinal inflammatory, while SEP could ease this injury by reducing STAT1 and activating Ang-4 which could reduce the inflammatory response. Taken together, these results not only provided a novel insight into attenuated mechanism of Semen Euphorbiae, which was marked by a number of DEPs that might be associated with intestinal inflammation, but also the first experimental evidence that the Angiopoietin 4 and STAT1 proteins might be two major candidate biomarkers in the attenuated of SE after processing based on proteomic investigation. Our findings suggest that this screening method has potential valuable in studying mechanism of processing. Future systematic studies will investigate how Semen Euphorbiae regulate the expression of these key proteins and illustrate the problem from a clinical point of view.
Acknowledgments
Not applicable.
Funding
This work was sponsored by grants from NSFC projects (No. 81673597).
Availability of data and materials
Please contact author for data requests.
Abbreviations
- 2D-LC-MS/MS
Two-dimensional liquid chromatography-tandem mass spectrometry
- ACN
Acetonitrile
- Ang
Angiopoietin
- CIITA
TypeIItranscription activator
- DEPs
Differentially expressed proteins
- DTT
Dithiothreitol
- EFL1
Euphorbiae Factor 1
- EGF
Epidermal growth factor
- Eph/Ephrin
Erythropoientin-producing hepatocyte kinases/Eph receptor interacting proteins
- GO
Gene ontology
- IFN
Interferon
- IgG
Immunoglobulin G
- IL-6
Interleukin-6
- iTRAQ
Isobaric tags for relative and absolute quantitation
- JAK2
Janus Kinase 2
- LC
Liquid chromatography
- NF-κB
Nuclear factor kappa B
- PDGF
Platelet-derived growth factor
- PSMs
Peptide-spectrum matches
- PVDF
Polyvinylidene fluoride
- SDS-PAGE
Sodium dodecyl sulfate polyacrylamide gel electrophoresis
- SE
Semen Euphorbiae
- SEP
Semen Euphorbiae Pulveratum
- STAT1
Signal transducers and activators of transcription one
- TCM
Traditional Chinese medicine
- TNF
Tumor necrosis factor
Authors’ contributions
ZY carried out the preparations of Semen Euphorbiae and Semen Euphorbiae Pulveratum, participated in western blot and drafted the manuscript. ZXT carried out Proteomics extraction procedures. LWH and LSX participated in the design of the study and performed the statistical analysis. SZY and NRJ helped to draft the manuscript and perform the statistical analysis. WYZ and LSJ conceived of the study, and participated in its design and coordination and helped to draft the manuscript. All authors read and approved the final manuscript.
Ethics approval and consent to participate
All procedures employed were approved by Animal Ethical and Welfare Committee of Beijing University of Chinese Medicine.
Consent for publication
Not applicable.
Competing interests
All the authors declare that they have no competing interest.
Publisher’s Note
Springer Nature remains neutral with regard to jurisdictional claims in published maps and institutional affiliations.
Contributor Information
Yu Zhang, Email: bucm_yuzhang2015@bucm.edu.cn.
Yingzi Wang, Phone: 010-84738615, Email: wangyzi@sina.com.
Shaojing Li, Email: shaojingli2004@126.com.
Xiuting Zhang, Email: 455891986@qq.com.
Wenhua Li, Email: 3071019097@qq.com.
Shengxiu Luo, Email: 2515397782@qq.com.
Zhenyang Sun, Email: 1226224696@qq.com.
Ruijie Nie, Email: 1010376164@qq.com.
References
- 1.Shi QW, Su XH, Kiyota H. ChemInform abstract: chemical and pharmacological research of the plants in genus Euphorbia. ChemInform. 2008;108(10):4295–4327. doi: 10.1021/cr078350s. [DOI] [PubMed] [Google Scholar]
- 2.Wang YS, Song GW, Zhang HW, et al. Analysis of semen euphorbiae frostlike powders by HPLC fingerprint. 2013. pp. 10011–10014. [Google Scholar]
- 3.FUNG Characterization of semen euphorbiae. Proceedings of the Society for Experimental Biology & Medicine Society for Experimental Biology & Medicine. 2011;128(1):75–80. doi: 10.3181/00379727-128-32946. [DOI] [PubMed] [Google Scholar]
- 4.Wang ZY, Kang H, Ji LL, et al. Proteomic characterization of the possible molecular targets of pyrrolizidine alkaloid isoline-induced hepatotoxicity. Environmental Toxicology & Pharmacology. 2012;34(2):608–617. doi: 10.1016/j.etap.2012.06.013. [DOI] [PubMed] [Google Scholar]
- 5.Van SA, Renes J, van Delft JH, et al. Proteomics in the search for mechanisms and biomarkers of drug-induced hepatotoxicity. Toxicology in Vitro An International Journal Published in Association with Bibra. 2012;26(3):373–385. doi: 10.1016/j.tiv.2012.01.012. [DOI] [PubMed] [Google Scholar]
- 6.Wei J, Zhang F, Zhang Y, et al. Proteomic investigation of signatures for geniposide-induced hepatotoxicity. J Proteome Res. 2014;13(12):5724–5733. doi: 10.1021/pr5007119. [DOI] [PubMed] [Google Scholar]
- 7.Witzmann FA, Grant RA. Pharmacoproteomics in drug development. Pharmacogenomics Journal. 2003;3(2):69–76. doi: 10.1038/sj.tpj.6500164. [DOI] [PubMed] [Google Scholar]
- 8.Su L, Cao L, Zhou R, et al. Identification of novel biomarkers for Sepsis prognosis via urinary proteomic analysis using iTRAQ labeling and 2D-LC-MS/MS. PLoS One. 2013;8(1):e54237. doi: 10.1371/journal.pone.0054237. [DOI] [PMC free article] [PubMed] [Google Scholar]
- 9.Ye H, Sun L, Huang X, et al. A proteomic approach for plasma biomarker discovery with 8-plex iTRAQ labeling and SCX-LC-MS/MS. Mol Cell Biochem. 2010;343(1):91–99. doi: 10.1007/s11010-010-0502-x. [DOI] [PubMed] [Google Scholar]
- 10.Caubet C, Lacroix CS, Drube J, et al. Advances in urinary proteome analysis and biomarker discovery in pediatric renal disease. Pediatr Nephrol. 2010;25(1):27–35. doi: 10.1007/s00467-009-1251-5. [DOI] [PubMed] [Google Scholar]
- 11.Adolf W, Hecker E. Further new diterpene esters from the irritant and cocarcinogenic seed oil and latex of the caper spurge ( Euphorbia lathyris L.) Experientia. 1971;27(12):1393–1394. doi: 10.1007/BF02154248. [DOI] [PubMed] [Google Scholar]
- 12.Zhu JJ, Wang YZ, Zhang C, et al. Determination of olein compositions in the petroleum ether extractant of semen euphorbiae by gas chromatogra phy-mass. Journal of Shandong University of Traditional Chinese Medicine. 2013;37(5):438–441. [Google Scholar]
- 13.Zhu J, Zhang C, Wang Y, et al. Study on chemical constituents of petroleum ether Extractant of semen euphorbiae. Journal of Shandong University of Traditional Chinese Medicine. 2014;38(4):381–2,391. [Google Scholar]
- 14.Duan FP, Wang YZ, Li CX. Chemical composition and biological activity analysis of semen euphorbiae petroleum ether extracts. Journal of Chemical & Pharmaceutical Research. 2014;6(5):745–749. [Google Scholar]
- 15.Bradford M. A rapid method for the quantification of microgram quantities of protein utilizing the principle of protein-dye binding. Anal Biochem. 1976;72(s 1–2):248–254. doi: 10.1016/0003-2697(76)90527-3. [DOI] [PubMed] [Google Scholar]
- 16.Sacute W, Niewski JR, et al. Universal sample preparation method for proteome analysis. Nat Methods. 2009;6(5):359–362. doi: 10.1038/nmeth.1322. [DOI] [PubMed] [Google Scholar]
- 17.Tam JC, Ko CH, Cheng Z, et al. Comprehensive proteomic analysis of a Chinese 2-herb formula (Astragali Radix and Rehmanniae Radix) on mature endothelial cells. Proteomics. 2014;14(17–18):2089–2103. doi: 10.1002/pmic.201300547. [DOI] [PubMed] [Google Scholar]
- 18.Zhang K, Pan X, Zheng J, et al. Comparative tissue proteomics analysis of thoracic aortic dissection with hypertension using the iTRAQ technique. European journal of cardio-thoracic surgery : official journal of the European Association for Cardio-thoracic Surgery. 2015;47(3):431–438. doi: 10.1093/ejcts/ezu171. [DOI] [PubMed] [Google Scholar]
- 19.Ren W, Hou X, Wang Y, et al. Overgrazing induces alterations in the hepatic proteome of sheep (Ovis aries): an iTRAQ-based quantitative proteomic analysis. Proteome Sci. 2016;15(1):2. doi: 10.1186/s12953-016-0111-z. [DOI] [PMC free article] [PubMed] [Google Scholar]
- 20.Glen A, Gan CS, Hamdy FC, et al. iTRAQ-facilitated proteomic analysis of human prostate cancer cells identifies proteins associated with progression. J Proteome Res. 2008;7(3):897–907. doi: 10.1021/pr070378x. [DOI] [PubMed] [Google Scholar]
- 21.Gong YT, Wang XM. NF-kB and neurodegenerative disorder in central nervous system. Chinese Bulletin of Life Sciences. 2004;16(5):280–284. [Google Scholar]
- 22.Schindler C, Plumlee C. Inteferons pen the JAK-STAT pathway. Semin Cell Dev Biol. 2008;19(4):311. doi: 10.1016/j.semcdb.2008.08.010. [DOI] [PMC free article] [PubMed] [Google Scholar]
- 23.Fukuhara S, Sako K, Minami T, et al. Differential function of Tie2 at cell|[ndash]|cell contacts and cell|[ndash]|substratum contacts regulated by angiopoietin-1. Nat Cell Biol. 2008;10(5):513–526. doi: 10.1038/ncb1714. [DOI] [PubMed] [Google Scholar]
- 24.Ramana CV, Chatterjee-Kishore M, Nguyen H, et al. Complex roles of Stat1 in regulating gene expression. Oncogene. 2000;19(21):2619–2627. doi: 10.1038/sj.onc.1203525. [DOI] [PubMed] [Google Scholar]
- 25.Caldow MK,Cameron-Smith D.JAK/STAT Pathway.2012:495–497.
- 26.Sikorski K, Czerwoniec A, Bujnicki JM, et al. STAT1 as a novel therapeutical target in pro-atherogenic signal integration of IFNγ, TLR4 and IL-6 in vascular disease. Cytokine Growth Factor Rev. 2011;22(4):211–219. doi: 10.1016/j.cytogfr.2011.06.003. [DOI] [PubMed] [Google Scholar]
Associated Data
This section collects any data citations, data availability statements, or supplementary materials included in this article.
Data Availability Statement
Please contact author for data requests.