Abstract
[18F] 2-fluoro-2-deoxy-D-glucose positron emission tomography-computed tomography scan was performed on 45 children with autism to study the baseline pattern and age-related developmental changes in the brain metabolism. Median standardized uptake values (SUVs) were compared with published healthy control data. Results showed that, in contrary to control data, the median SUVs in children with autism decrease linearly with increase in age. As compared to controls, autism children below 5 years showed greater metabolism and older children showed lower metabolism. In autism group, comparison of absolute SUVs within different regions of the brain revealed relatively lower metabolism in amygdala, hippocampus, parahippocampal gyrus, caudate nucleus, cerebellum, mesial temporal lobe, thalamus, superior and middle temporal pole, and higher metabolic uptake in calcarine fissure and Heschl's gyrus. These results help in understanding the baseline metabolism and developmental changes of brain among different age groups in autism.
Keywords: [18F] 2-fluoro-2-deoxy-D-glucose, autism, brain development, brain glucose metabolism, computed tomography, positron emission tomography
Introduction
Autism spectrum disorder (ASD) is a developmental disorder, with core clinical features including impaired social interactions, verbal and nonverbal communication deficits, restricted activities and interests, and stereotypic pattern of behavior.[1,2] Autism is one of the diagnoses included under the umbrella term of ASD in the Diagnostic and Statistical Manual of Mental Disorders, Fourth Edition (DSM-IV) Text Revision (TR) criteria.[3] Symptoms of autism start by 2 years of age and are accompanied by abnormal developmental changes in brain function and connectivity.[4] According to the report by the Centers for Disease Control and Prevention, about one in every 68 children has been identified with ASD.[5] The prevalence of ASD is variable in different countries.[3] The gradual increase in prevalence of ASD is due to changes in diagnostic practices, lifestyle, and increased awareness.[3] ASD is more prominent among boys as compared to girls.[5]
The advent of neuroimaging techniques such as magnetic resonance imaging (MRI), single-photon emission computed tomography (SPECT), positron emission tomography (PET), and functional MRI has opened a promising way to understand and study brain dysfunction in autism. Some structural and volumetric studies using MRI have shown increased brain volume, decreased volume of vermian lobules VI and VII, decreased volume of amygdala, and increased hippocampal volume in individuals with autism.[6,7,8,9] However, subsequent studies showed no difference in brain volume, vermian lobules, amygdala, and decrease or no difference in hippocampal volume in individuals with autism.[8,10,11,12] The lack of consistency in findings of brain abnormalities and contradictory results made MRI a poor diagnostic tool in autism.
The recent advancement in PET enables to determine the functional abnormalities in the brain. As glucose is the main metabolic substrate in the brain, [18F] 2-fluoro-2-deoxy-D-glucose (FDG) is the most commonly and widely used radiotracer in PET imaging. FDG is robust and has longer half-life, which facilitates its use in both research and clinical imaging settings.[13] Earlier studies using PET in autism have shown decreased blood flow in temporal cortex, decreased glucose metabolism in thalamus and putamen, and increased glucose metabolism in occipital and parietal cortices.[14,15,16] Although various regions of abnormalities are observed in different PET studies, there is no conclusion of specific metabolic pattern in children with autism as compared to healthy brain. In this study, we used PET/computed tomography (CT) as a potential biomarker for studying the brain abnormalities in children with autism.
The objectives of this study were to determine the pattern of brain glucose metabolism in children with autism and to identify the differences in the age-related regional brain glucose metabolism of children with autism as compared to published data of healthy brain.
Materials and Methods
Patient selection
Forty-five children with primary autism (males and females) were selected from patients who underwent treatment during the year 2014–2015 at a neurological institute. As a part of the treatment protocol, PET/CT scan of the brain was done as a pre-intervention evaluation. The study protocol was reviewed and ethics approval was given by the Institutional Committee. Written informed consent was obtained from the parents of all the children. These children were diagnosed with autism by experienced psychology experts in the field of autism. They were diagnosed according to the DSM-IV TR criteria[3] and assessed on the Childhood Autism Rating Scale[17] and the Indian Scale for Assessment of Autism[18] scores. Children between 2.5 and 15 years of age were recruited for the study. For the children with autism, the following exclusion criteria were applied: abnormal result in MRI, presence of comorbid neurological disorder, and metabolic or chromosomal disease. However, these can become the confounding factor by affecting the baseline pattern of PET/CT findings.
Positron emission tomography brain image acquisition
Brain glucose metabolism was measured using high-resolution PET/CT camera. Regional changes in brain are determined using standardized uptake values (SUVs). Before the FDG-PET/CT examination, patients were fasting for at least 4–6 h. The blood glucose level was determined to be normal in the range of 100–140 mg/dl before injection. The autism children were then injected according to the dose card as suggested by the European Association of Nuclear Medicine.[19] After the injection, children with autism were isolated and kept in a quiet, dark room. Sedation was given to all the patients, few minutes before the scan, by which FDG signal within the brain was stable. They were positioned in supine with their arms resting by their side, head was fixed in place throughout the scan, and position of the vertex was marked. A 15 min static FDG PET/CT scan was performed using Biograph 16 scanner (Siemens, Germany). Transmission CT images for attenuation correction and PET emission images were acquired approximately 45 min after injection of the tracer. The CT acquisition parameters were as follows: slice thickness 0.5 cm, tube rotation 0.6 s, pitch 1.5, 100 kV, 90 mA, with dose modulation. PET images of the brain were obtained by 15 min acquisition on scanner. Images were reconstructed using standard vendor-supplied software (iterative three dimensional).
Positron emission tomography brain imaging processing
Brain PET images were normalized using SCENIUM Ratio Analysis software (Siemens Medical Solutions, USA), a probabilistic population-based brain atlas of human cortical structures. Spatial normalization was performed by an automated image registration toolkit, which used the ratio of image uniformity as the objective function. The spatial normalization procedure was evaluated qualitatively by visual inspection of normalized PET images overlaid on the brain atlas. The SUVs of all the 54 regions of the brain were calculated. The SUVs are calculated using the ratio of tissue radioactivity concentration within the region of interest (ROI) and the injected dose of radioactivity per kilogram of the patient's body weight.
SUV= Region of Interest/[Injection dose (MBq)/Patient's body weight (kg)].
Statistical analysis
The statistical data were recorded and analyzed using Graph-pad PRISM software version 7 (GraphPad Software Inc, San Diego, CA). The average mean and standard deviation were analyzed for age and regional SUVs as absolute values. On post hoc analysis, ROI areas of hypometabolism or hypermetabolism in children with autism were calculated using normal distribution curve. In normal distribution curve, values less than one standard deviation (–1SD) from the mean SUVs were considered as hypometabolic. Values greater than one standard deviation (+1SD) from the mean SUVs were considered as hypermetabolic. The correlation and linear regression between age and absolute SUVs was performed using Pearson correlation. P < 0.05 was considered statistically significant.
To compare with the published data, the median SUVs were calculated from the absolute SUVs. The median SUVs between autism group of this study were compared to the median SUVs of published healthy control data.[20]
Results
Demographics
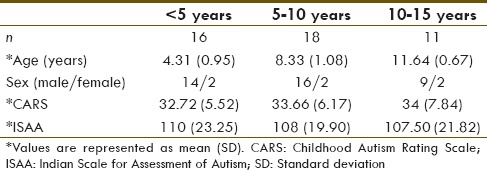
The autism groups are segregated into three groups, according to their age as <5 years, 5–10 years, and 10–15 years. The demographics of the children with autism are shown in Table 1.
Table 1.
Demographics
Baseline pattern of brain metabolism in children with autism
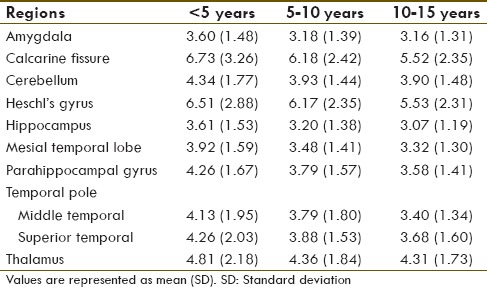
On post hoc analysis, ROI areas of hypometabolism and hypermetabolism across the different age groups were analyzed for children with autism. They showed increased uptake in calcarine fissure and Heschl's gyrus. Whereas, amygdala, hippocampus, parahippocampal gyrus, cerebellum, caudate nucleus, mesial temporal lobe, thalamus, superior, and middle temporal pole showed decreased uptake. Absolute mean SUVs of children with autism in the ROI are shown in Table 2.
Table 2.
Absolute mean standardized uptake values of autism group in the region of interest
The metabolism in these ROI decreases as age increases. There was a negative correlation observed between age and ROI as shown in Figure 1.
Figure 1.
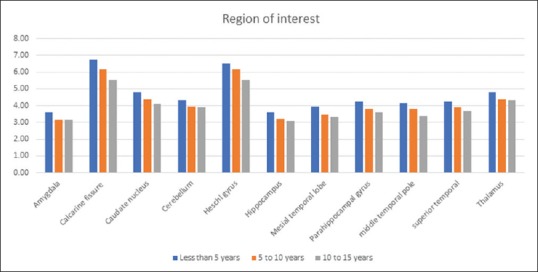
The age-related changes within the region of interest in autism group the horizontal axis represents the post hoc region of interests while the vertical axis represents the absolute mean standardized uptake values. This graph shows a linear decrease in mean standardized uptake values of region of interest as age increases
We also analyzed all four lobes of the cerebral cortex. It was observed that temporal cortex showed the lowest metabolic uptake in all age groups.
There was also statistically significant negative correlation between age and absolute mean SUVs of all the cortical lobes including frontal (P = 0.03, r = −0.32), parietal (P = 0.02, r = −0.34), temporal (P = 0.01, r = −0.34), and occipital (P = 0.02, r = −0.35). This signifies the age-related linear decrease in the metabolism of the cortical lobes in the children with autism as shown in Figure 2.
Figure 2.
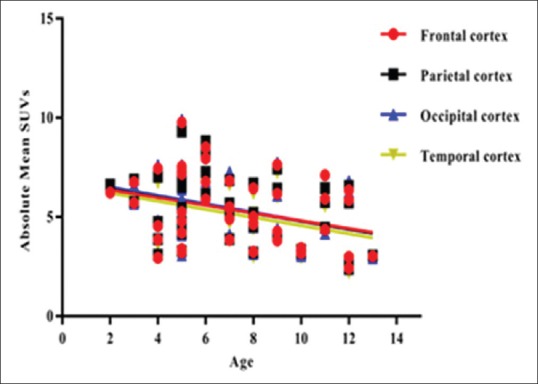
The negative correlation between age and absolute mean standardized uptake values of cortical lobes in autism group the horizontal axis represents the post hoc region of interests while the vertical axis represents the absolute mean standardized uptake values. There was a linear decrease in the metabolism of the cortical lobes with increase in age
Comparison between age-related regional uptake in children with autism and published healthy control data
Recently, the absolute median SUVs of healthy brain were published.[20] We compared the values of our autism group to the previously published absolute median SUVs of healthy brain. We observed that in <5-year age group of autism, all regions of the brain except hippocampus showed increased metabolic uptake as compared to the healthy control data. Hippocampus showed lower metabolic uptake. In 5–10-year age group, autism showed lower metabolic uptake in all regions of the brain as compared to the healthy control data. In 10–15-year age group, autism showed lower metabolic uptake in all the regions as compared to the healthy control data. Insula is minimally higher than healthy control data [Table 3].[20] As a representative image, FDG PET/CT of 4-, 8-, and 12-year-old male children with autism is shown in Figure 3.
Table 3.
Comparison between median standardized uptake values (95% confidence interval) of autism group and healthy controls
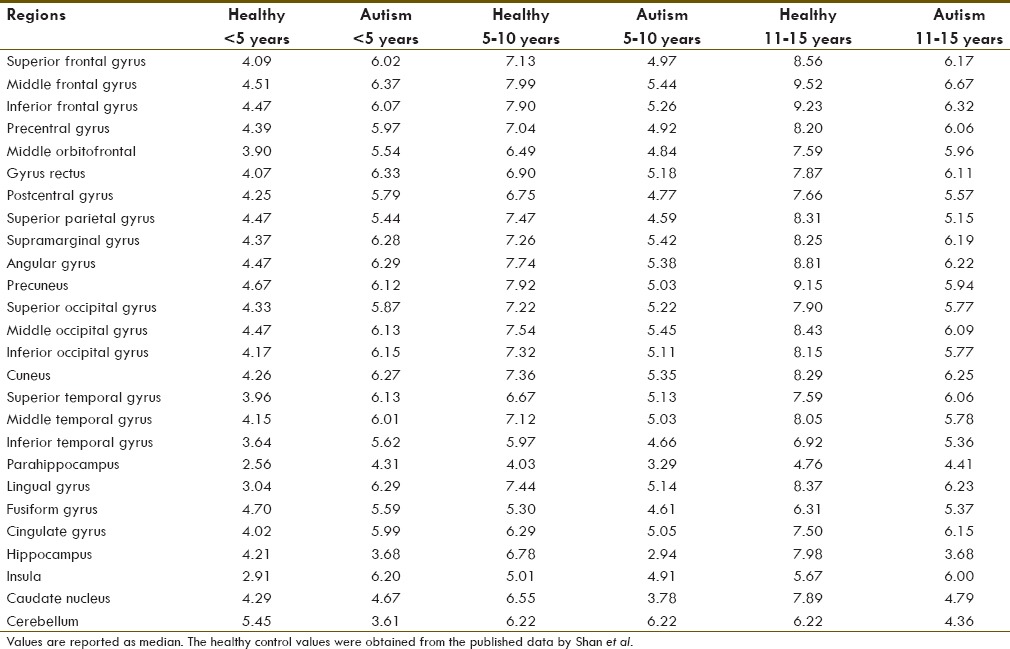
Figure 3.
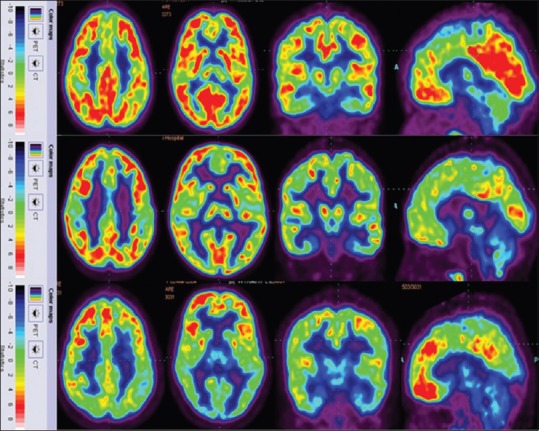
[18F] 2-fluoro-2-deoxy-D-glucose-positron emission tomography image of the autism group top row indicates, a 4-year-old boy showing hypometabolism in hippocampus; middle row indicates an 8-year-old boy showing hypometabolism in cerebellum, thalamus, amygdala, hippocampus, and parahippocampal gyrus; bottom row indicates a 12-year-old boy showing hypometabolism in cerebellum, thalamus, amygdala, hippocampus, and parahippocampal gyrus
Discussion
The purpose of this study was to determine the baseline pattern of brain glucose metabolism in children with autism and to compare the developmental age-related metabolic changes between autism group and healthy brain. In this study, we observed that children with autism exhibited hypometabolism and hypermetabolic regions across all age groups. Based on the post hoc findings, children with autism showed a linear decrease of brain glucose metabolism with increase of age within the ROI. Moreover, autism children showed increased metabolism below 5 years and showed decrease metabolism in 5–10 and 10–15 years as compared to the published healthy control data. This indicates that there are definite abnormalities in various stages of development of brain in children with autism.
Baseline pattern of brain metabolism in healthy brain
The age-related changes in metabolism among healthy brain was first established by Chugani.[21] Chugani showed that from birth to 4 years, there is an increase in glucose utilization which shows synaptic proliferation, and during that period, the child's cortical metabolism is twice as of adult, while from 4 to 10 years, the metabolism is maintained and after that there is a decline in brain metabolism to reach the adult metabolic pattern.[21] Furthermore, Shan et al.[20] documented age-related changes in median SUVs of healthy brain. They observed that absolute median SUVs increase with age until they reach adulthood. In his study, when the regions are normalized to cerebellum, the pattern was shown to be similar to previously published data by Chugani.[21] Few other studies also showed a linear increase of SUVs with respect to age.[22,23]
Developmental changes in children with autism as compared to healthy brain
In this study, we compared the median SUVs of autism group to that of published median SUVs of healthy control data.[20] Contrary to healthy control data, autism group showed age-related linear decrease in metabolism of brain. These findings demonstrate atypical neurodevelopmental trajectory of brain maturation in autism.
Pathological changes in the brain metabolism in autism
Absolute SUVs increase with age until they reach the normal adult pattern in healthy controls. Among the cortical structures, frontal showed highest age-related SUVs change which was followed by parietal, occipital, and temporal. Autism population showed the age-related decrease in SUVs uptake in the cortical region with varying uptake in all the four lobes. The trajectory of the brain metabolism in autism varies across different parts of the brain with the frontal and temporal being affected more as compared to the parietal and occipital cortices.[24] The current findings corroborate with the existing literature.
Literature suggests that there is a period of early overgrowth followed by arrested growth. This can be related to the abnormal age-related decrease in the brain metabolism in children with autism.[24,25] The abnormal change in brain metabolism in autism could also be related with the abnormal neuronal migration, developmental alteration in axon numbers, axon pathfinding, and synaptogenesis.[26] The neuronal migration abnormality could alter the orientation, size, and spacing of minicolumns in frontal lobe which may lead to imbalance in excitation and inhibition of neurons.[27] This minicolumn abnormality may lead to the deficiency in inter-regional connectivity.[28] Moreover, synaptic pruning, elaboration of dendritic arborization, and increased myelination could also impact cortical connectivity.[29]
In the present findings, children with autism below 5 years showed greater metabolic uptake as compared to healthy brain. These increased metabolic uptakes below 5 years could be associated with the increase in number of cortical neurons and density.[30,31,32] The progressive hypometabolism in autism could also be due to over inhibition of neurons creating imbalance between neuronal excitation and inhibition.[27] These excitatory and inhibitory imbalances could cause the deficit in learning in autism disorder.
Temporal cortex
Temporal cortex abnormalities seem to play a vital role in the clinical signs and symptoms. In the present studies, we observe that children with autism show decreased metabolism in the temporal cortex. Decreased metabolism in the superior temporal gyrus (STG) and increased metabolism in Heschl's gyrus lead to the abnormalities in the incoming auditory stimuli affecting the sensory perception, associated cognitive functions, and emotion in children with autism.[33,34] It is also consistent with the previous findings showing abnormal activation of auditory cortex in response to auditory stimuli, auditory orientation to speech stimuli, and detection of auditory change in autism.[35]
Medial temporal cortex which includes hippocampus, parahippocampal gyrus, and amygdala also showed abnormalities as described above. These brain regions are responsible for emotions and memory. The decreased metabolism in hippocampus, amygdala could be associated with the small size and increased packaging density found in hippocampus and amygdala as shown by Bauman and Kemper.[30] Therefore, these children may have significant abnormalities in emotions and memory.
Different functional neuroimaging studies showed the activation of fusiform area during perception of any visual stimuli. The present study indicates that children with autism showed a progressive decline of metabolism in the fusiform area. These results are in series with the findings from different studies in children with autism suggesting hypoactivation of fusiform area during facial expression.[36]
The regions which are essential for social cognition and interaction include STG and middle temporal gyrus (MTG). In the present study, hypometabolism is observed in STG and MTG. This hypometabolism could be associated with the dysfunction in social activities in autism children. Our study is in concordant with the previous findings showing reduced activation in STG and MTG in children with autism.[37]
Cerebellum
Cerebellum consists of the largest number of neurons and synapses in brain.[38] It plays a major role in motor functions and cognitive functions.[39] The deficits in cerebellar metabolism have been established in autism for many decades. In this study, children with autism show a reduced glucose metabolism in cerebellum. This corresponds to the different neuropathological studies showing abnormalities in cerebellar Purkinje cells, reduction in the size and number of cells in cerebellar nuclei, and active neuroinflammatory process within cerebellar white matter.[40]
Children with autism showed an age-related linear decrease in glucose metabolism in cerebellar region. The bilateral median SUVs of cerebellum in this study were compared with healthy controls. Since Shan et al.[20] have not published unilateral values of cerebellum, the comparison of the right and left cerebellum was not performed. Further investigation of PET has to be focused on cerebellum to examine the pattern of brain glucose in individuals with autism.
Hypoperfusion
The SPECT provides information on regional cerebral blood flow of brain. Decrease in cerebral blood flow reflects hypometabolism in PET, which reflects neuronal damage in brain. The findings of our results correlate with the different SPECT studies showing reduced cerebral blood flow in temporal, frontal, parietal, and occipital cortices, thalamus, basal ganglia, and cerebellar hemisphere.[1,41]
Neuroinflammation
The metabolism of brain in children with autism decreases as age increases. This decreased metabolism could be related to the central nervous system inflammation which includes activation of microglial cells in autism as confirmed by postmortem histology studies of autism brains.[42] It has been reported that autism brain shows increased microglial activation in fusiform gyrus, orbitofrontal cortex, cingulate cortex, midbrain, and cerebellum.[43]
The identification of inflammation is associated with abnormal findings in cerebrospinal fluid of autism patients that include tumor necrosis factor, IL-6, and monocyte chemoattractant protein-1 and chemotactic factors for mast cells. The inflammatory cytokines are increased during brain inflammation and associated with the damage of hippocampus and cortical regions.[44,45]
The purpose of this study was to establish the metabolic pattern for quantitative analysis of FDG PET for children with autism. To our knowledge, this is the first study which shows the age-related changes in the brain metabolism of children with autism.
Limitations
One of the limitations of this study is that gender-based comparison between male and female population could not be performed, due to insufficient number of female subjects. Due to ethical considerations and radiation exposure on pediatric healthy population, the PET/CT on healthy children was not performed. The PET/CT scans of healthy control and autism groups were performed in two different centers. The other limitation of the study is that only 26 regions of the brain were able to compare with the healthy controls. The group significant test could not be performed since the published data as established by Shan et al. have absolute median SUVs. The individual cerebellar changes in the autism could not be evaluated in this study since the median SUVs as established by Shan et al.[20] do not comment about the left and right side of the cerebellum.
Future directions
These pilot findings are promising and help in understanding the pattern in autism. This provides better insight into the pathology of autism and regions impaired at an earlier stage of the disease. In this study, only 26 regions of the brain were compared with the healthy controls. Therefore, future studies should be performed on complete regions of the brain between healthy controls and autism children. Moreover, studies have to focus on finding the correlation between clinical evaluation and the neuroimaging findings. Further studies are needed to analyze the comparison between mild, moderate, and severe autism.
Conclusion
Unlike the healthy controls, as the age increases, there is a linear decrease in brain metabolism of autism children. This study shows a baseline pattern of hypometabolism in amygdala, hippocampus, parahippocampal gyrus, cerebellum, mesial temporal lobe, thalamus, superior and middle temporal pole, and hypermetabolism in calcarine fissure and Heschl's gyrus in autism. These findings may be useful to understand the developmental changes in brain metabolism and to identify the regional defects peculiar to autism. The abnormalities detected in this study provide the explanation for the developmental, cognitive, and behavioral deficits observed in children with autism.
Financial support and sponsorship
Nil.
Conflicts of interest
The authors declare no conflicts of interest.
References
- 1.Gillberg C, Coleman M. Cambridge (England): Cambridge University Press; 2000. The Biology of the Autistic Syndromes. [Google Scholar]
- 2.Rapin I, Katzman R. Neurobiology of autism. Ann Neurol. 1998;43:7–14. doi: 10.1002/ana.410430106. [DOI] [PubMed] [Google Scholar]
- 3.American Psychiatric Association. 4th ed. Virginia (US): American Psychiatric Publishing; 2000. Diagnostic Criteria From DSM-IV-TR. [Google Scholar]
- 4.Ecker C, Bookheimer SY, Murphy DG. Neuroimaging in autism spectrum disorder: Brain structure and function across the lifespan. Lancet Neurol. 2015;14:1121–34. doi: 10.1016/S1474-4422(15)00050-2. [DOI] [PubMed] [Google Scholar]
- 5.Developmental Disabilities Monitoring Network Surveillance Year Principal Investigators; Centers for Disease Control and Prevention (CDC). Prevalence of autism spectrum disorder among children aged 8 years – Autism and developmental disabilities monitoring network, 11 sites, United States, 2010. MMWR Surveill Summ. 2014;63:1–21. [PubMed] [Google Scholar]
- 6.Courchesne E, Karns CM, Davis HR, Ziccardi R, Carper RA, Tigue ZD, et al. Unusual brain growth patterns in early life in patients with autistic disorder: An MRI study. Neurology. 2001;57:245–54. doi: 10.1212/wnl.57.2.245. [DOI] [PubMed] [Google Scholar]
- 7.Hardan AY, Minshew NJ, Mallikarjuhn M, Keshavan MS. Brain volume in autism. J Child Neurol. 2001;16:421–4. doi: 10.1177/088307380101600607. [DOI] [PubMed] [Google Scholar]
- 8.Courchesne E, Yeung-Courchesne R, Press GA, Hesselink JR, Jernigan TL. Hypoplasia of cerebellar vermal lobules VI and VII in autism. N Engl J Med. 1988;318:1349–54. doi: 10.1056/NEJM198805263182102. [DOI] [PubMed] [Google Scholar]
- 9.Carper RA, Moses P, Tigue ZD, Courchesne E. Cerebral lobes in autism: Early hyperplasia and abnormal age effects. Neuroimage. 2002;16:1038–51. doi: 10.1006/nimg.2002.1099. [DOI] [PubMed] [Google Scholar]
- 10.Zeegers M, Hulshoff Pol H, Durston S, Nederveen H, Schnack H, van Daalen E, et al. No differences in MR-based volumetry between 2- and 7-year-old children with autism spectrum disorder and developmental delay. Brain Dev. 2009;31:725–30. doi: 10.1016/j.braindev.2008.11.002. [DOI] [PubMed] [Google Scholar]
- 11.Aylward EH, Minshew NJ, Goldstein G, Honeycutt NA, Augustine AM, Yates KO, et al. MRI volumes of amygdala and hippocampus in non-mentally retarded autistic adolescents and adults. Neurology. 1999;53:2145–50. doi: 10.1212/wnl.53.9.2145. [DOI] [PubMed] [Google Scholar]
- 12.Piven J, Bailey J, Ranson BJ, Arndt S. No difference in hippocampus volume detected on magnetic resonance imaging in autistic individuals. J Autism Dev Disord. 1998;28:105–10. doi: 10.1023/a:1026084430649. [DOI] [PubMed] [Google Scholar]
- 13.Zürcher NR, Bhanot A, McDougle CJ, Hooker JM. A systematic review of molecular imaging (PET and SPECT) in autism spectrum disorder: Current state and future research opportunities. Neurosci Biobehav Rev. 2015;52:56–73. doi: 10.1016/j.neubiorev.2015.02.002. [DOI] [PubMed] [Google Scholar]
- 14.Hazlett EA, Buchsbaum MS, Hsieh P, Haznedar MM, Platholi J, LiCalzi EM, et al. Regional glucose metabolism within cortical Brodmann areas in healthy individuals and autistic patients. Neuropsychobiology. 2004;49:115–25. doi: 10.1159/000076719. [DOI] [PubMed] [Google Scholar]
- 15.Haznedar MM, Buchsbaum MS, Wei TC, Hof PR, Cartwright C, Bienstock CA, et al. Limbic circuitry in patients with autism spectrum disorders studied with positron emission tomography and magnetic resonance imaging. Am J Psychiatry. 2000;157:1994–2001. doi: 10.1176/appi.ajp.157.12.1994. [DOI] [PubMed] [Google Scholar]
- 16.Herold S, Frackowiak RS, Le Couteur A, Rutter M, Howlin P. Cerebral blood flow and metabolism of oxygen and glucose in young autistic adults. Psychol Med. 1988;18:823–31. doi: 10.1017/s0033291700009752. [DOI] [PubMed] [Google Scholar]
- 17.Schopler E, Reichler RJ, Renner BR. Los Angeles: Western Psychological Services; 2002. The Childhood Autism Rating Scale (CARS) [Google Scholar]
- 18.Patra S, Arun P. Use of Indian scale for assessment of autism in child guidance clinic: An experience. Indian J Psychol Med. 2011;33:217–9. doi: 10.4103/0253-7176.92043. [DOI] [PMC free article] [PubMed] [Google Scholar]
- 19.Jamar F, Buscombe J, Chiti A, Christian PE, Delbeke D, Donohoe KJ, et al. EANM/SNMMI guideline for 18F-FDG use in inflammation and infection. J Nucl Med. 2013;54:647–58. doi: 10.2967/jnumed.112.112524. [DOI] [PubMed] [Google Scholar]
- 20.Shan ZY, Leiker AJ, Onar-Thomas A, Li Y, Feng T, Reddick WE, et al. Cerebral glucose metabolism on positron emission tomography of children. Hum Brain Mapp. 2014;35:2297–309. doi: 10.1002/hbm.22328. [DOI] [PMC free article] [PubMed] [Google Scholar]
- 21.Chugani HT. A critical period of brain development: Studies of cerebral glucose utilization with PET. Prev Med. 1998;27:184–8. doi: 10.1006/pmed.1998.0274. [DOI] [PubMed] [Google Scholar]
- 22.Kang E, Lee DS, Kang H, Lee JS, Oh SH, Lee MC, et al. Age-associated changes of cerebral glucose metabolic activity in both male and female deaf children: Parametric analysis using objective volume of interest and voxel-based mapping. Neuroimage. 2004;22:1543–53. doi: 10.1016/j.neuroimage.2004.04.010. [DOI] [PubMed] [Google Scholar]
- 23.Van Bogaert P, Wikler D, Damhaut P, Szliwowski HB, Goldman S. Regional changes in glucose metabolism during brain development from the age of 6 years. Neuroimage. 1998;8:62–8. doi: 10.1006/nimg.1998.0346. [DOI] [PubMed] [Google Scholar]
- 24.Courchesne E. Abnormal early brain development in autism. Mol Psychiatry. 2002;7 Suppl 2:S21–3. doi: 10.1038/sj.mp.4001169. [DOI] [PubMed] [Google Scholar]
- 25.Courchesne E, Campbell K, Solso S. Brain growth across the life span in autism: Age-specific changes in anatomical pathology. Brain Res. 2011;1380:138–45. doi: 10.1016/j.brainres.2010.09.101. [DOI] [PMC free article] [PubMed] [Google Scholar]
- 26.Geschwind DH, Levitt P. Autism spectrum disorders: Developmental disconnection syndromes. Curr Opin Neurobiol. 2007;17:103–11. doi: 10.1016/j.conb.2007.01.009. [DOI] [PubMed] [Google Scholar]
- 27.Nelson SB, Valakh V. Excitatory/inhibitory balance and circuit homeostasis in autism spectrum disorders. Neuron. 2015;87:684–98. doi: 10.1016/j.neuron.2015.07.033. [DOI] [PMC free article] [PubMed] [Google Scholar]
- 28.Casanova MF, van Kooten IA, Switala AE, van Engeland H, Heinsen H, Steinbusch HW, et al. Minicolumnar abnormalities in autism. Acta Neuropathol. 2006;112:287–303. doi: 10.1007/s00401-006-0085-5. [DOI] [PubMed] [Google Scholar]
- 29.Huttenlocher PR. Morphometric study of human cerebral cortex development. Neuropsychologia. 1990;28:517–27. doi: 10.1016/0028-3932(90)90031-i. [DOI] [PubMed] [Google Scholar]
- 30.Bauman ML, Kemper TL. Neuroanatomic observations of the brain in autism: A review and future directions. Int J Dev Neurosci. 2005;23:183–7. doi: 10.1016/j.ijdevneu.2004.09.006. [DOI] [PubMed] [Google Scholar]
- 31.Rapoport J, Chavez A, Greenstein D, Addington A, Gogtay N. Autism spectrum disorders and childhood-onset schizophrenia: Clinical and biological contributions to a relation revisited. J Am Acad Child Adolesc Psychiatry. 2009;48:10–8. doi: 10.1097/CHI.0b013e31818b1c63. [DOI] [PMC free article] [PubMed] [Google Scholar]
- 32.Stoner R, Chow ML, Boyle MP, Sunkin SM, Mouton PR, Roy S, et al. Patches of disorganization in the neocortex of children with autism. N Engl J Med. 2014;370:1209–19. doi: 10.1056/NEJMoa1307491. [DOI] [PMC free article] [PubMed] [Google Scholar]
- 33.Kuhl PK. Early language acquisition: Cracking the speech code. Nat Rev Neurosci. 2004;5:831–43. doi: 10.1038/nrn1533. [DOI] [PubMed] [Google Scholar]
- 34.Pandya DN, Yeterian EH. New York: Springer; 1985. Architecture and connections of cortical association areas Association and Auditory Cortices; pp. 3–61. [Google Scholar]
- 35.Samson F, Hyde KL, Bertone A, Soulières I, Mendrek A, Ahad P, et al. Atypical processing of auditory temporal complexity in autistics. Neuropsychologia. 2011;49:546–55. doi: 10.1016/j.neuropsychologia.2010.12.033. [DOI] [PubMed] [Google Scholar]
- 36.Pierce K, Müller RA, Ambrose J, Allen G, Courchesne E. Face processing occurs outside the fusiform ‘face area’ in autism: Evidence from functional MRI. Brain. 2001;124(Pt 10):2059–73. doi: 10.1093/brain/124.10.2059. [DOI] [PubMed] [Google Scholar]
- 37.Sato W, Toichi M, Uono S, Kochiyama T. Impaired social brain network for processing dynamic facial expressions in autism spectrum disorders. BMC Neurosci. 2012;13:99. doi: 10.1186/1471-2202-13-99. [DOI] [PMC free article] [PubMed] [Google Scholar]
- 38.Andersen BB, Korbo L, Pakkenberg B. A quantitative study of the human cerebellum with unbiased stereological techniques. J Comp Neurol. 1992;326:549–60. doi: 10.1002/cne.903260405. [DOI] [PubMed] [Google Scholar]
- 39.Schmahmann JD, Sherman JC. The cerebellar cognitive affective syndrome. Brain. 1998;121(Pt 4):561–79. doi: 10.1093/brain/121.4.561. [DOI] [PubMed] [Google Scholar]
- 40.Pelphrey K, Adolphs R, Morris JP. Neuroanatomical substrates of social cognition dysfunction in autism. Ment Retard Dev Disabil Res Rev. 2004;10:259–71. doi: 10.1002/mrdd.20040. [DOI] [PubMed] [Google Scholar]
- 41.George MS, Costa DC, Kouris K, Ring HA, Ell PJ. Cerebral blood flow abnormalities in adults with infantile autism. J Nerv Ment Dis. 1992;180:413–7. doi: 10.1097/00005053-199207000-00002. [DOI] [PubMed] [Google Scholar]
- 42.Vargas DL, Nascimbene C, Krishnan C, Zimmerman AW, Pardo CA. Neuroglial activation and neuroinflammation in the brain of patients with autism. Ann Neurol. 2005;57:67–81. doi: 10.1002/ana.20315. [DOI] [PubMed] [Google Scholar]
- 43.Suzuki K, Sugihara G, Ouchi Y, Nakamura K, Futatsubashi M, Takebayashi K, et al. Microglial activation in young adults with autism spectrum disorder. JAMA Psychiatry. 2013;70:49–58. doi: 10.1001/jamapsychiatry.2013.272. [DOI] [PubMed] [Google Scholar]
- 44.Theoharides TC, Alysandratos KD, Angelidou A, Delivanis DA, Sismanopoulos N, Zhang B, et al. Mast cells and inflammation. Biochim Biophys Acta. 2012;1822:21–33. doi: 10.1016/j.bbadis.2010.12.014. [DOI] [PMC free article] [PubMed] [Google Scholar]
- 45.Theoharides TC, Asadi S, Patel AB. Focal brain inflammation and autism. J Neuroinflammation. 2013;10:46. doi: 10.1186/1742-2094-10-46. [DOI] [PMC free article] [PubMed] [Google Scholar]


