Abstract
Purpose
There is a need for automated retinal optical coherence tomography (OCT) image analysis tools for quantitative measurements in small animals. Some image processing techniques for retinal layer analysis have been developed, but reports about how useful those techniques are in actual animal studies are rare. This paper presents the use of a retinal layer detection method we developed in an actual mouse study that involves wild type and mutated mice carrying photoreceptor degeneration.
Methods
Spectral domain OCT scanning was performed by four experimenters over 12 months on 45 mouse eyes that were wild-type, deficient for ephrin-A2 and ephrin-A3, deficient for rhodopsin, or deficient for rhodopsin, ephrin-A2 and ephrin-A3. The thickness of photoreceptor complex between the outer plexiform layer and retinal pigment epithelium was measured on two sides of the optic disc as the biomarker of retinal degeneration. All the layer detection results were visually confirmed.
Results
Overall, 96% (8519 out of 9000) of the half-side images were successfully processed using our technique in a semi-automatic manner. There was no significant difference in success rate between mouse lines (p = 0.91). Based on a human observer’s rating of image quality for images successfully and unsuccessfully processed, the odds ratios for ‘easily visible’ images and ‘not clear’ images to be successfully processed is 62 and 4, respectively, against ‘indistinguishable’ images. Thickness of photoreceptor complex was significantly different across the quadrants compared (p < 0.001). It was also found that the average thickness based on 4-point sparse sampling was not significantly different from the full analysis, while the range of differences between the two methods could be up to about 6 lm or 16% for individual eyes. Differences between mouse lines and progressive thickness reduction were revealed by both sampling measures.
Conclusions
Although the thickness of the photoreceptor complex layer is not even, manual sparse sampling may be as sufficiently accurate as full analysis in some studies such as ours, where the error of sparse sampling was much smaller than the effect size of rhodopsin deficiency. It is also suggested that the image processing method can be useful in actual animal studies. Even for images poorly visible to human eyes the image processing method still has a good chance to extract the complex layer.
Keywords: image segmentation, mouse study, optical coherence tomography, photoreceptor degeneration
Introduction
Quantitative measurements of retinal structures based on in-vivo retinal optical coherent tomography (OCT) images are highly demanded in clinical practice and scientific research, especially for subjects with eye diseases such as macular degeneration and glaucoma. In animal studies, using non-invasive measurements as biomarkers helps reduce the number of animals used in longitudinal experiments, because animals can be examined at different ages and do not always have to be sacrificed. Although tremendous research and development efforts have been devoted to automated analysis of human retinal OCT images1–5 and some analytical functions are available in many commercial OCT machines for clinics, there has been minimal research on automated analysis of retinal OCT images for small animals6–8. Analysis tools in high resolution OCT machines specifically designed for scientific research are scarce. There are particularly strong needs from the scientific research community for easy analyses of retinal OCT images of small animals.
While image processing researchers have been developing a variety of sophisticated analysis methods, there are basic questions that the scientific community is interested in that have not been addressed. How well can these analysis tools perform for OCT scans in actual animal studies, which often include images of degenerated retina or suboptimal scans? Additionally, automated analysis is supposed to be more efficient and more comprehensive than manual measurement. Is there any evidence to suggest that computerised full analysis can yield more accurate measurements than manual measurements based on sparse sampling? It should be kept in mind that current computerised analysis techniques are prone to errors when OCT image quality is sub-optimal due to a variety of reasons in practice. In images of highly degenerated retina, which is common in scientific research, many structure patterns that are apparent in healthy retina are usually not visible. It is necessary for users to take control of the analysis with help from computerised procedures, rather than to rely on fully automatic analysis. The semi-automatic approach helps to minimise errors generated by computer programs.
In this paper, we present our evaluation of a semiautomatic analysis tool based on its use in an actual mouse study. Unlike previous evaluation experiments that used images of healthy retina from human subjects5,9 and those that used a small number of hand-picked images of mice6,8, our experiment included OCT scans of all the wild type and gene knockout mice used in an actual animal study. The results show that the computer aided analysis can meet the users’ needs, at least in terms of data yield rate. As the study and the analysis approach are representative of their own fields, the findings from this evaluation can inform the community about the value of computer-aided analyses of retinal OCT images of rodents.
Method
Animal study
Our previous studies showed ephrin-As, particularly ephrin-A2 (A2) and ephrin-A3(A3) are negative regulators for the proliferation of stem cells or neural progenitors in the central nervous system, including the retina10,11. The present study, in which the computer-aided analysis software was used, aimed to investigate the effect of A2 and A3, on the proliferation of endogenous retinal progenitor cells in mice carrying rhodopsin deficiency (Rho−/−). Four mouse lines were included in the study: wild-type (WT), mice deficient for ephrin-A2 and ephrin-A3 (A2−/−A3−/−), mice deficient for rhodopsin, and mice deficient for rhodopsin, ephrin-A2 and ephrin-A3 (Rho−/−ephrin-A2−/−A3−/−). Retinal lamination in A2A3 knockout mice is generally similar to that in WT mice. Both Rho knockout and RhoA2A3 knockout mice have a thinner outer nuclear layer than WT mice, because lack of rhodopsin leads to photoreceptor degeneration.
A spectral domain (SD)-OCT system (Bioptigen, www.bioptigen.com) was used to acquire OCT images. The Bioptigen system was designed for small animals and provided a high resolution of 2 μm. OCT images of each eye consisted of 100 B-scans, covering a 50° field-of-view of the mouse retina. In this study, the thickness of photoreceptor complex between the outer plexiform layer (OPL) and retinal pigment epithelium (RPE) was assessed quantitatively as a surrogate measure for photoreceptor survival. One of the reasons to use this measure is because the thickness of photoreceptor complex is correlated to the number of surviving photoreceptors12. The thickness can be a consistent outcome measure that allows identification of mice with photoreceptor degeneration. A custom, semi-automated processing program, instead of Bioptigen’s fully automated analysis software, was used to measure the thickness, because our own program allows parameter adjustment and interventions to maximize retinal layer detection rate and to minimize erroneous data.
SD-OCT live imaging
The OCT procedure was described previously13. In brief, mice were anaesthetised with an intraperitoneal injection of a mixture of ketamine (100 mg kg−1) and xylazine (20 mg kg−1) and were kept warm on a heating blanket. Pupils were dilated with a topically applied eye drop of 1% tropicamide. Radial volumetric images, centered on the optic nerve head, were acquired from either the left or right eye using the high resolution Bioptigen SD-OCT system. All of the analyses were carried out in a double masked fashion.
Detection of OPL
To detect the OPL in OCT images, a second-order Gaussian matched filter developed by Luo14 for detecting retinal blood vessels in fundus images was adopted. The mathematical model of the filter is:
| (1) |
where L is the length of the filter window, c is the x position of the center line of the filter window along the y axis, and W is the width of the filter window. Here, the orientation of the filter is assumed to be aligned along the y axis (Figure 1). In the OPL detection procedure, the orientation, center location, and σ of the filter are changed within a certain range to find the response peak of convolution, which represents the best match between the filter and the images. When one segment is detected (matched), the values for those parameters at the response peak are used to guide the search for the next segment. Detection results of one B-scan are used to guide the detection for the next scan.
Figure 1.
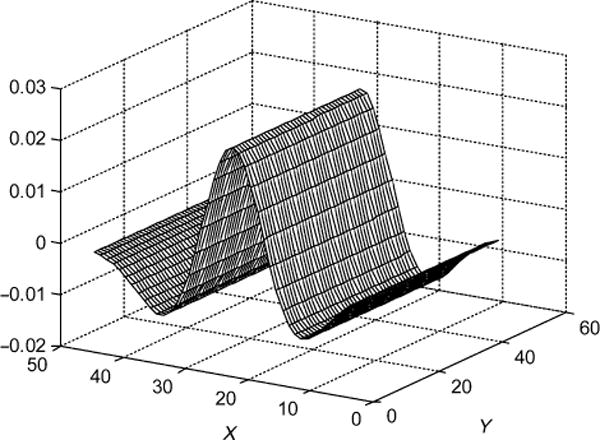
Profile of second-order Gaussian matched filter used for detection of OPL.
The matched filter described by Equation (1) can be used for detection of bright stripe patterns such as the OPL layer, and when flipped upside down it can also be used for detection of dark stripe patterns such as the inner segment layer (green line in Figure 2). It is possible to design a group of preset filters to detect all stripe-shaped layers. In this paper, we only report its use for OPL detection.
Figure 2.
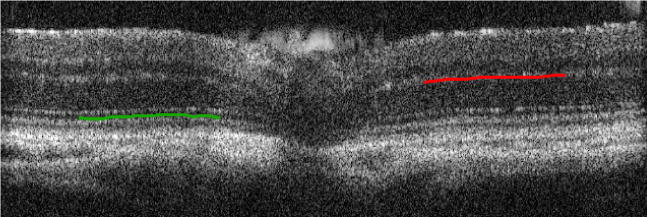
The Gaussian matched filter can be used for detection of bright and dark stripe patterns. As a WT retinal OCT image demonstrated here, with the hat top pointing upwards as shown in Figure 1, the filter can detect OPL (red curve). When flipped upside down (the hat top pointing downwards), the same filter can detect the inner segment layer (green curve).
Detection of RPE
For detection of the RPE, a directional 2D Gaussian smoothing window was first applied to enhance the layer structure and suppress noise. The Gaussian window is described by the following equation:
| (2) |
where L is the length and width of the smoothing window, c is the x position of the centre line of the window along the y axis. Here, the orientation of the filter is assumed to be aligned along the y axis. After the smoothing operation, the upper surface of the RPE was detected by finding the first falling edge from an upward pixel scanning (Figure 3). The initial direction (yellow lines in Figure 3) of the Gaussian smoothing window was approximately defined by users at the beginning of the analysis, and then the direction of the smoothing window for the following images was based on previous detection results.
Figure 3.
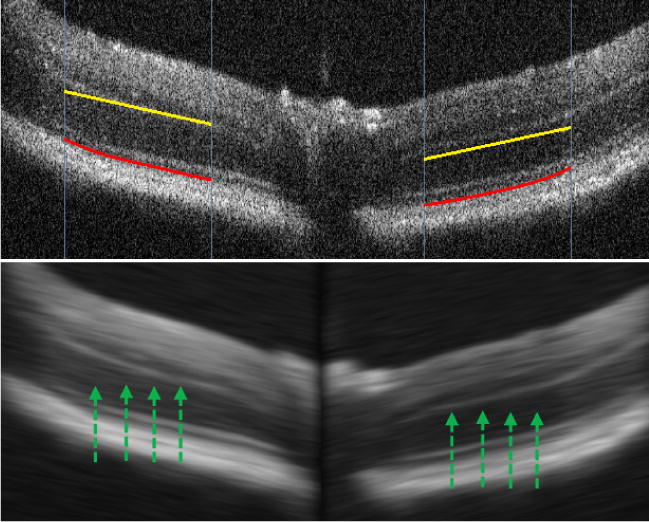
RPE detection. According to a user’s indication of the approximate direction of layer structure (yellow lines) or detection results of previous scans, a directional Gaussian smoothing is performed to suppress the noise. Then the RPE (red lines) is identified as the first falling edge from upward pixel scanning, as indicated by the green arrows.
Using the analysis software
We developed a custom MATLAB program implementing the algorithms described above. The procedure using the analysis software is semi-automatic. For a newly opened OCT scan video, a user indicates the approximate location of the OPL layer on the left and right sides of the optic disc using the cursor. The indications are presented as yellow lines in Figure 3. The manual indication informs the software where to start the detection of the OPL. It does not have to be precise because the algorithm searches for the OPL within a certain range. The direction of the yellow lines is also used as the initial orientation of the directional Gaussian smoothing prior to the RPE detection. Once the first scan is successfully processed, the detection results are used to guide analysis in the next scan. Users can perform automatic processing of multiple scans until the end of the video file, and then review the results. Erroneous detection for a scan can be rejected by users, and the scan can be re-analysed using a new manual indication. Then automatic processing of the following scans can be re-initiated if needed. If a particular scan cannot be processed correctly by the software, the thickness measure for that scan will be omitted.
The software provides a colour-coded thickness map for users to review the processing results from a different perspective. It is usually very easy for users to check for errors in the results using this map (Figure 4). If suspicious results are spotted, users can either re-analyse or discard those scans.
Figure 4.
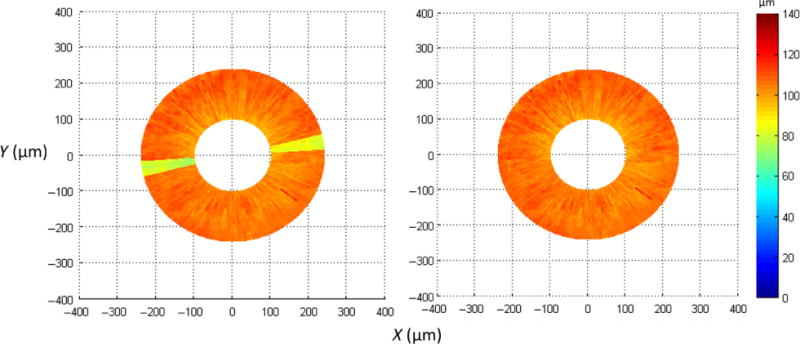
Color coded top-view thickness map can help users quickly check the detection results from a different perspective. If suspicious results are spotted, such as the yellow sectors on the left indicating a sudden reduction in thickness from scan #3 to #9, users can visually examine the detection results for those scans and re-analyse them if needed. After correcting the detection errors, the top-view thickness map on the right shows a relatively even thickness distribution.
Statistical analysis
Statistical analysis was performed using SPSS v22 (http://www-01.ibm.com/software/analytics/spss/). Repeated measures ANOVA was used to test the differences between quadrants, mouse lines, and sampling methods. An independent T-test was used to compare different mouse lines and age groups. Outcomes with p < 0.05 were considered statistically significant. SPSS was also used to generate most of the plots. Error bars, inter-quartile ranges and outliers are reported by the software.
Results
In the animal study, 45 eyes from 45 mice were scanned (6 WT, 14 A2−/−A3−/−, 14 Rho−/−, and 11 Rho−/− A2 −/−A3−/−). These scans were performed four experimenters over 12 months. Visual examination revealed some inconsistency in the image quality among the total 4500 scans, which may be due to variability in mouse eyes and OCT operation by multiple experimenters over a long period of time. Using the software mentioned above, three experimenters processed all of the scans, and visually examined all of the layer detection results to ensure that the results were consistent with their visual observations. Scans that the software could not yield consistent results or the users could not see the OPL were treated as missed detection cases.
For each scan, images on the right and left side of optic disc were processed separately. Thus, the thickness of the photoreceptor complex was sampled at 9000 points. Overall, 8519 (96.1%) thickness data points were successfully acquired. The data yield rates for A2−/−A3−/−, Rho−/−, Rho−/− A2−/−A3−/−, and WT mice were 94.7%, 96.9%, 96.3%, and 96.8%, respectively. There was no significant difference in the yield rates across the mouse groups (F3,41 = 0.18, p = 0.91).
There are many factors that can cause the OCT images to be too blurry to be analysed by the image processing tools, or to be visible to experimenters. The possible causes for blurry images can be related to cataract development in mouse eyes, corneal opacity, OCT operator’s skill, etc. It is very difficult, if not impossible, to prevent image blur completely in practical animal studies. The key from an automated analysis perspective is to minimise data loss given a certain number of blurry images. We asked an experienced OCT image viewer, an ophthalmologist, to grade the image quality of the 346 images that did not yield thickness data in three categories – visible, not clear but still somewhat visible, and indistinguishable. Some exemplar images of the three categories are shown in Figure 5. Among the images that did not yield thickness data at least on one side, the percentage of the three image quality categories were 4%, 14%, and 82%, respectively. In other words, most of the failed images were indistinguishable. For all the images that failed to generate thickness data, we also graded the image quality of their counterpart images that successfully generated thickness data. For example, if a B-scan of one eye has missing thickness data on the left and right sides, then a different B-scan without missing thickness data from the same OCT video was randomly selected for image quality grading as well. Based on the counts of images with and without missing thickness data, the odds ratios of obtaining thickness data for a given image were calculated. We found a ‘visible’ image is 62 times more likely to be processed successfully than an ‘indistinguishable’ image, and a ‘not clear’ image is 4 times more likely than an ‘indistinguishable’ image. These odds ratios suggest that the chance our analysis software can successfully measure the photoreceptor complex is high if the image quality is better than ‘indistinguishable’.
Figure 5.
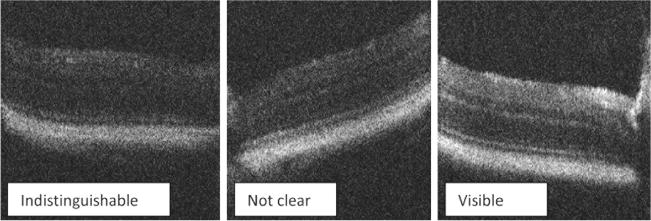
Examples of image quality rating given by an experienced ophthalmologist. The difference in image quality could be due to variability in mouse eyes and OCT operation by multiple experimenters.
Based on the thickness data obtained, we found that the thickness measurement of the photoreceptor complex was not even – on average the first and second quadrants were significantly thicker (F3,123 = 27.5, p < 0.001) than the third and fourth quadrants (Figure 6a). The four quadrants are divided at meridians 0°, 90°, 180°, 270°. This pattern appeared to be consistent for all four mouse lines. Uneven thickness in mice has been demonstrated in a previous study6.
Figure 6.
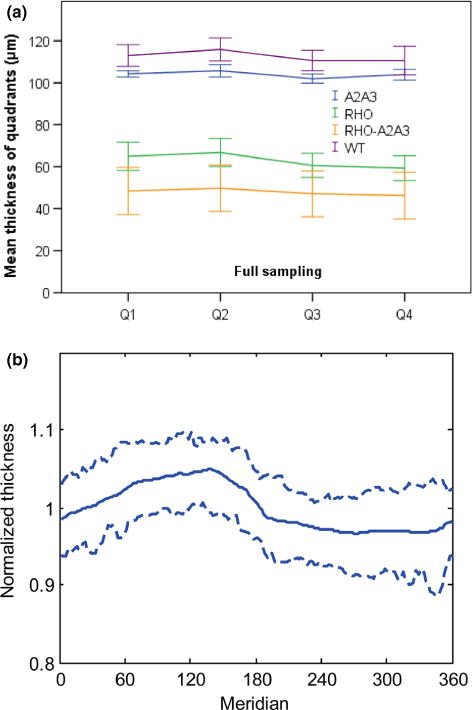
The photoreceptor complex thickness of the mouse retina was not even across quadrants or meridians. (a) The thickness was significantly larger in the first and second quadrants than the third and fourth quadrants. This pattern is consistent for all 4 mouse lines. Error bars indicate 95% confidence intervals. (b) Based on normalised thickness using the average of each eye, it seems that the largest thickness is likely to be around 135°, and the smallest thickness is usually between 270° and 320°. The two dashed curves indicate 75% confidence interval.
Further analysis was conducted by normalising the thickness using the average thickness for each eye and then combining all 45 eyes. Figure 6b shows that the largest thickness was more likely to be around 135°, and the smallest thickness was more likely to be between 270° and 320°. It is not clear to us what may cause the uneven thickness measurement. It may be due to variations in the biological structure of mouse retina.
When not using any computer-aided analysis software to help with full analysis of OCT images, a common practice in animal studies is to manually measure the thickness on a few OCT images. In this paper, we compare the mean thickness measure from the full analysis and the thickness measure based on sparse sampling on scan #25 and #75 (each eye had 100 scans), which generates four data points at the middle of the four quadrants. If data is missing on those points, thickness data of nearby images were used. Figure 7 shows the thickness measures using the two sampling methods for each mouse line. There was no significant difference in overall average thickness between the full analysis and sparse sampling methods (p = 0.34).
Figure 7.
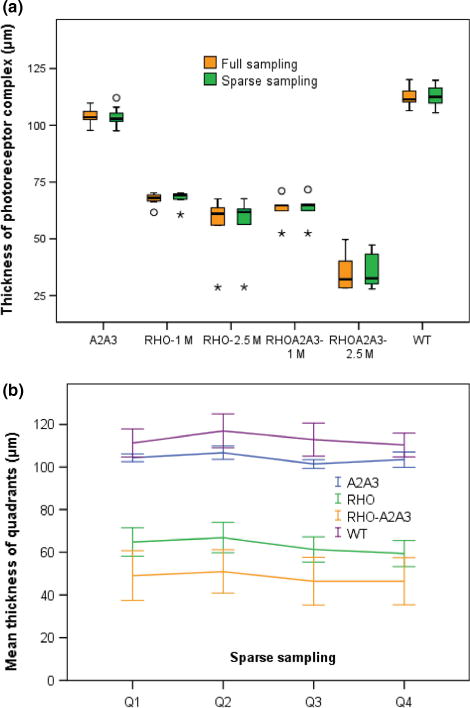
(a) Thickness measure outcomes from full analysis of all B-scans vs sparse sampling at 4 points 90° apart in each eye. Circle symbols denote outliers between 1.5× and 3× interquartile range, and stars denote outliers >3× interquartile range. For mouse lines Rho−/−and Rho−/−A2−/−A3−/−, plots are split by age group as there were apparent progressive reductions in thickness. (b) Similar to the full sampling data as shown in Figure 6, sparse sampling also revealed uneven thickness across quadrants. Error bars indicate 95% confidence intervals.
For testing the effect of gene knocking out (ephrin and rhodopsin), both full sampling and sparse sampling measures revealed significant differences in thickness between any two mouse groups (p < 0.001, independent T-test). Both sampling measures also revealed significant progressive retinal degeneration from one to two and a half months age (in terms of reduction in thickness of photoreceptor complex) in Rho−/− (p < 0.047) and Rho−/−A2−/−A3−/− mouse lines (p < 0.001, independent T-test). Like the full analysis measure, the sparse sampling data also reveal the uneven thickness across quadrants (F3,123 = 15.6, p < 0.001, repeated measure ANOVA, Figure 7b).
Not surprisingly, there is a chance sparse sampling may happen to hit a point that is quite different from the overall characteristics. Figure 8 shows the difference between full and sparse sampling for each quadrant in each eye. When average thickness from full sampling for a quadrant is compared with one point sampling, the difference ranged from +11 μm to 10 μm. The outliers and whiskers shown in the figure indicate that there was a good chance the difference could be several micron. As the figure also shows, when average thickness from full analysis is compared with average of four point samplings, the difference became smaller, ranging from +2.5 to −3.4 μm (a range of 5.9 μm). The relative difference for individual eyes ranged from 5% to −11% (a range of 16%).
Figure 8.
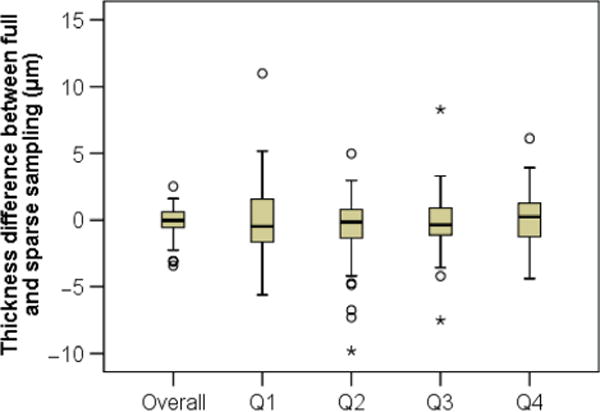
Difference in thickness measurement between full and sparse sampling methods. Comparing average thickness for each quadrant and thickness measure based on one point sampling, there was a good chance to observe a difference of several microns. Comparing overall thickness based on full sampling and average of 4 point sampling, the difference became smaller. Circle symbols denote outliers between 1.5× and 3× interquartile range, and stars denote outliers >3× interquartile range.
Conclusion
From the actual mouse study, we have seen that the image quality of many SD-OCT scans of mouse retina is not perfect. The fine layer structure visible in normal OCT scans is often missing in degenerated eyes. In order to compare thickness across different mouse groups, the thickness of the photoreceptor complex between the OPL and RPE was measured using a semi-automated image processing program we developed. Despite the image blur in many scans due to a variety of causes, such as cataract and imperfect operation, most of the OCT scans can be processed using the automated program with supervision and intervention of human experimenters. This study demonstrated that the analysis program is practically usable in mouse studies. It is possible that, with supervision of experimenters, some other retinal analysis algorithms can be made useful as well. We think it might be challenging for fully automated analysis algorithms to achieve a similar data yield rate and reliability. Further development and evaluation of automated methods is a future research topic.
By comparing the thickness measure according to full analysis and a four-point sparse sampling, we show that manual measurement at a few points can be a valid way to evaluate retinal degeneration based on the thickness of the photoreceptor complex. Although the thickness may change across meridians, the sparse sampling may be able to capture the slow variation in cases like the mice used in this study. Despite the overall consistent results generated by the two sampling methods within each mouse group, it should be noted that there can be a difference of several microns between the two measurements, e.g. 5.9 μm as shown in Figure 8. If variability caused by sparse sampling might compromise the ability to find small changes in the retina, it is recommended to increase the sampling points, or to use full field sampling. It can also be anticipated that in cases where variability of the photoreceptor complex layer is high (for instance in a photoreceptor degeneration model using an injection method and retinal detachment mouse model) a full analysis might be preferable.
Acknowledgments
This work is supported in part by NIH grant R01 EY017641 to DFC, the Department of Veterans Affairs grant VA241-P-2285 to DFC, National Youth Natural Science Foundation of China (#30901645), National Science Foundation of China (#61370124), and National Scholarship Foundation of China (#201303070205).
Footnotes
Disclosure
The authors report no conflicts of interest and have no proprietary interest in any of the materials mentioned in this article.
References
- 1.Bagci AM, Shahidi M, Ansari R, Blair M, Blair NP, Zelkha R. Thickness profiles of retinal layers by optical coherence tomography image segmentation. Am J Ophthalmol. 2008;146:679–687. doi: 10.1016/j.ajo.2008.06.010. [DOI] [PMC free article] [PubMed] [Google Scholar]
- 2.Mishra A, Wong A, Bizheva K, Clausi DA. Intra-retinal layer segmentation in optical coherence tomography images. Opt Express. 2009;17:23719–23728. doi: 10.1364/OE.17.023719. [DOI] [PubMed] [Google Scholar]
- 3.Yang Q, Reisman CA, Chan KP, Ramachandran R, Raza A, Hood DC. Automated segmentation of outer retinal layers in macular OCT images of patients with retinitis pigmentosa. Biomed Opt Express. 2011;2:2493–2503. doi: 10.1364/BOE.2.002493. [DOI] [PMC free article] [PubMed] [Google Scholar]
- 4.Yazdanpanah A, Hamarneh G, Smith BR, Sarunic MV. Segmentation of intra-retinal layers from optical coherence tomography images using an active contour approach. IEEE Trans Med Imaging. 2011;30:484–496. doi: 10.1109/TMI.2010.2087390. [DOI] [PubMed] [Google Scholar]
- 5.Ghorbel I, Rossant F, Bloch I, Tick S, Paques M. Automated segmentation of macular layers in OCT images and quantitative evaluation of performances. Pattern Recogn. 2011;44:1590–1603. [Google Scholar]
- 6.Ruggeri M, Webbe H, Jiao S, et al. In vivo three-dimensional high-resolution imaging of rodent retina with spectral-domain optical coherence tomography. Invest Ophthalmol Vis Sci. 2007;48:1808–1814. doi: 10.1167/iovs.06-0815. [DOI] [PubMed] [Google Scholar]
- 7.Molnar J, Chetverikov D, DeBuc DC, Gao W, Somfai GM. Layer extraction in rodent retinal images acquired by optical coherence tomography. Mach Vis Appl. 2012;23:1129–1139. [Google Scholar]
- 8.Srinivasan PP, Heflin SJ, Izatt JA, Arshavsky VY, Farsiu S. Automatic segmentation of up to ten layer boundaries in SD-OCT images of the mouse retina with and without missing layers due to pathology. Biomed Opt Express. 2014;5:348–365. doi: 10.1364/BOE.5.000348. [DOI] [PMC free article] [PubMed] [Google Scholar]
- 9.Liu X, Shen M, Huang S, Leng L, Zhu D, Lu F. Repeatability and reproducibility of eight macular intra-retinal layer thicknesses determined by an automated segmentation algorithm using two SD-OCT instruments. PLoS One. 2014;9:1–10. doi: 10.1371/journal.pone.0087996. [DOI] [PMC free article] [PubMed] [Google Scholar]
- 10.Jiao JW, Feldheim DA, Chen DF. Ephrins as negative regulators of adult neurogenesis in diverse regions of the central nervous system. Proc Natl Acad Sci USA. 2008;105:8778–8783. doi: 10.1073/pnas.0708861105. [DOI] [PMC free article] [PubMed] [Google Scholar]
- 11.Fang Y, Cho KS, Tchedre K, et al. Ephrin-A3 suppresses WNT signaling to control retinal stem cell potency. Stem Cells. 2013;31:349–359. doi: 10.1002/stem.1283. [DOI] [PMC free article] [PubMed] [Google Scholar]
- 12.Humphries MM, Rancourt D, Farrar GJ, et al. Retinopathy induced in mice by targeted disruption of the rhodopsin gene. Nat Genet. 1997;15:216–219. doi: 10.1038/ng0297-216. [DOI] [PubMed] [Google Scholar]
- 13.Yang Q, Cho K-S, Chen H, et al. Microbead-induced ocular hypertensive mouse model for screening and testing of aqueous production suppressants for glaucoma. Invest Ophthalmol Vis Sci. 2012;53:3733–3741. doi: 10.1167/iovs.12-9814. [DOI] [PMC free article] [PubMed] [Google Scholar]
- 14.Luo G, Chutatape O, Krishnan SM. Detection and measurement of retinal vessels, in fundus images using amplitude modified second-order Gaussian filter. IEEE Trans Biomed Eng. 2002;49:168–172. doi: 10.1109/10.979356. [DOI] [PubMed] [Google Scholar]


