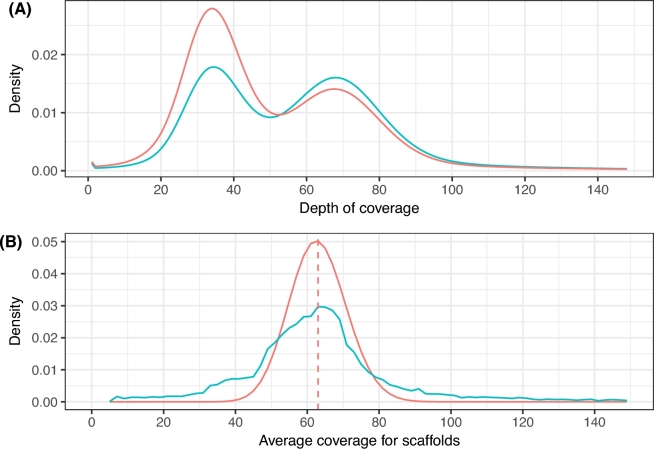
Figure 3:
Depth of coverage analysis for the haplotype-reduced assembly. (A) Density plot of read depth based on mapping all short fragment reads back to the haplotype-reduced assembled sequences after identification and removal of redundant sequences due the structural heterozygosity in the genome. (B) Density plot for average sequencing coverage per scaffold on the final assembly. The observed number of scaffolds in the final haplotype-reduced assembly and the respective read coverage (blue line) are shown in comparison with a Poisson process approximation (red line) with lambda = ×63, the observed average sequencing coverage in the useful read data.

