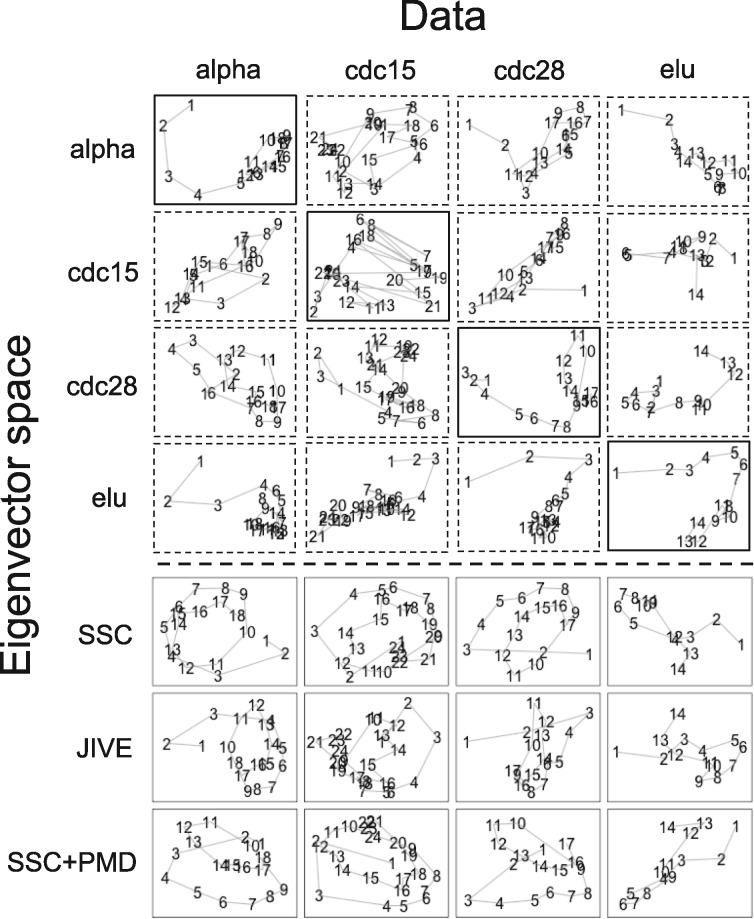
Fig. 4.
Two dimensional PC projections of PCA, MetaPCAs (SV, SSC), JIVE using four mRNA expression datasets of Spellman’s yeast cellcycle experiment. The numbers on the lines indicate time point during the two cell cycles. The first and second PC projections are on the x-axis and y-axis of each panel, respectively

