Abstract
Centronuclear myopathies (CNM) are a subtype of congenital myopathies (CM) characterized by skeletal muscle weakness and an increase in the number of central myonuclei. We have previously identified three CNM probands, two with associated dilated cardiomyopathy, carrying striated preferentially expressed gene (SPEG) mutations. Currently, the role of SPEG in skeletal muscle function is unclear as constitutive SPEG-deficient mice developed severe dilated cardiomyopathy and died in utero. We have generated a conditional Speg-KO mouse model and excised Speg by crosses with striated muscle-specific cre-expressing mice (MCK-Cre). The resulting litters had a delay in Speg excision consistent with cre expression starting in early postnatal life and, therefore, an extended lifespan up to a few months. KO mice were significantly smaller and weaker than their littermate-matched controls. Histopathological skeletal muscle analysis revealed smaller myofibers, marked fiber-size variability, and poor integrity and low number of triads. Further, SPEG-deficient muscle fibers were weaker by physiological and in vitro studies and exhibited abnormal Ca2+ handling and excitation-contraction (E-C) coupling. Overall, SPEG deficiency in skeletal muscle is associated with fewer and abnormal triads, and defective calcium handling and excitation-contraction coupling, suggesting that therapies targeting calcium signaling may be beneficial in such patients.
Introduction
SPEG protein encoded by the striated preferentially expressed gene (SPEG) is highly expressed in striated muscles. While the functions of SPEG are unclear, mutations in human patients cause a form of severe infantile onset centronuclear myopathy (CNM) with associated dilated cardiomyopathy, representing a unique subtype of congenital myopathy (CM) (1,2). CMs are a heterogeneous group of skeletal muscle disorders that typically present with hypotonia, and breathing and feeding difficulties in early life. They are subdivided into different types by distinct microscopic and ultrastructural findings in skeletal muscles (3). CNM is a common subtype characterized by the mislocalization of nuclei from the periphery to the center of myofibers. Several genes are now known to be mutated in CNM including MTM1, RYR1, TTN, BIN1, DNM2 and SPEG (1,4–8).
X-linked myotubular myopathy, the most common form of CNM, is caused by MTM1 mutations. We have previously shown that SPEG interacts with myotubularin, the protein product of MTM1 (1). The functions of myotubularin include regulation of calcium homeostasis, excitation-contraction (E-C) coupling, and cytoskeletal organization (9–11). As a myotubularin-interacting partner, we postulated that SPEG may be important for these functions as well. Further, we have previously described that SPEG co-localizes with various proteins expressed in terminal cisternae of the sarcoplasmic reticulum (SR) of the skeletal muscle. SR terminal cisternae and transverse-tubule (T-tubule) form the triads, and CNM is linked to dysfunctional E-C coupling at the triad.
We have created a conditional Speg-knockout mouse model (Spegfl/fl) and bred them with MCK-cre+ mice (cre recombinase expressed postnatally in striated muscles driven by muscle creatine kinase promoter) to overcome the early lethality of constitutive Speg-KO mice and decipher the underlying mechanisms for skeletal muscle dysfunction due to SPEG deficiency. The model targeted the two major isoforms expressed in cardiac and skeletal muscles, Spegα and Spegβ. Spegα is predominantly present during skeletal muscle differentiation, whereas both Spegα and Spegβ are present in neonatal cardiomyocytes during maturation and differentiation (12). The striated muscle-specific Speg-KO mice (Spegfl/fl: MCK-cre+) had reduced body mass and hypotonia and ultrastructural, histochemical and functional analyses revealed triad defects, myofibrillar disarray and contractile dysfunction. In vitro studies of muscle fibers revealed minimal force deficits at the cross-bridge but markedly reduced Ca2+ release from the SR suggestive of defective calcium release.
Results
Targeting strategy for Speg-conditional knockout mice
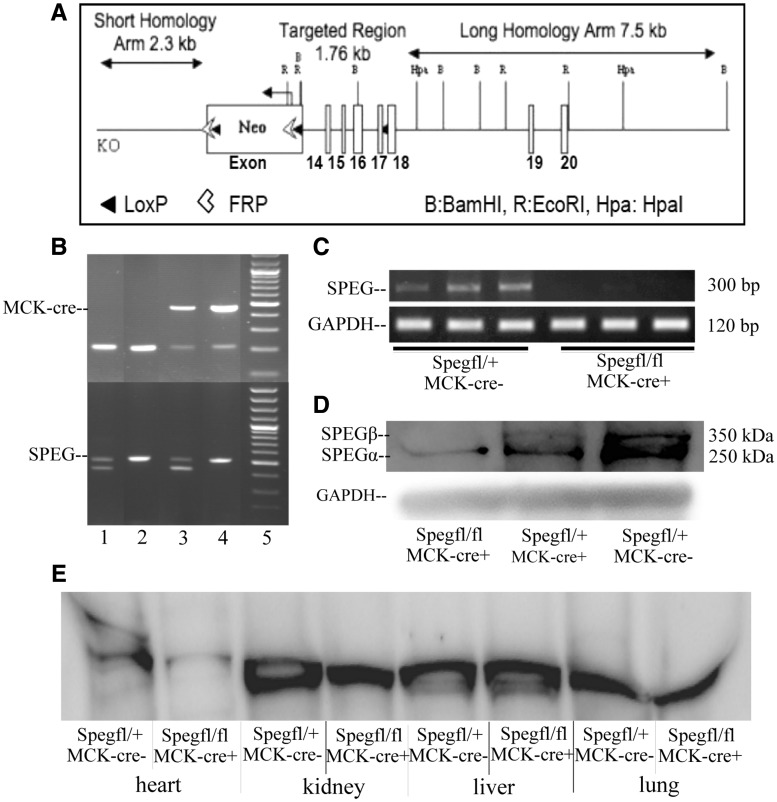
Constitutive Speg deletion of exons 8–10 in mice is known to be lethal during late embryonic life due to cardiac myofibril degeneration and marked reduction of cardiac function (13,14). To circumvent early lethality, we created a conditional Speg-knockout (Spegfl/fl) mouse model targeting exons 14–17 (Fig. 1A). Tissue-specific Speg excision was performed by crossing Spegfl/fl with striated muscle-specific MCK (muscle creatine kinase) cre-expressing mice and obtaining Spegfl/fl: MCK cre+ (Speg-KO). The Spegfl/+: MCK-cre+ littermates were used as controls (CTRL). In MCK-cre mice, cre expression usually starts at embryonic (E) day 17, reaches ∼40% at birth and reaches maximal levels by postnatal day (P) 10 and stays there for life (15). There was no reduction in the number of live births for Speg-KO mice representing 23% of all live pups (n = 180), others genotypes being Spegfl/fl: MCK cre- (25%), Spegfl/+: MCK cre+ (22%) and Spegfl/+: MCK cre- (30%). At three weeks of age, this was evaluated by PCR-agarose gel analysis of DNA extracted from their tails (Fig. 1B). Quantitative RT-PCR revealed that the Speg-KO quadriceps muscle contained minimal Speg mRNA relative to the CTRL (0.7 ± 0.6%), and on an agarose gel the Speg PCR product was absent in KO samples (Fig. 1C). Further, western blot analysis confirmed the lack of SPEG protein in skeletal muscles (Fig. 1D) and heart (Fig. 1E), and essentially normal levels in other major tissues, consistent with striated muscle-specific excision of Speg (Fig. 1E).
Figure 1.
Creation of the Speg-conditional knockout mice and striated muscle specific excision of the Speg gene. (A) Targeting strategy for Speg-conditional KO mouse. (A) 11.5 kb region used to construct the targeting vector was first sub-cloned from a positively identified C57BL/6 (RP23: 305K9) BAC clone. The region was designed such that the short homology arm (SA) extends ∼2.3 kb 5′ to exon 14. The long homology arm (LA) ends 3′ to exon 17 and is 7.5 kb long. The loxP/FRT-flanked Neo cassette is inserted on the 5′ side of exon 14 and the single loxP site is inserted between exons 17 and 18. The target region is 1.76 kb and includes exons 14–17. (B) PCR and agarose gel analysis of DNA isolated from tails of mice showing presence of MCK-Cre (top) and floxed Speg (bottom). MCK-Cre positive mice displayed bands for the transgene (∼450 bp) and internal positive control (200 bp) while the floxed Speg allele is 485 bp in size versus 422 bp for the WT. Speg-KO mice are cre-positive and homozygous for floxed Speg allele (column 4) while columns 1, 2 and 3 represent Spegfl/+ MCK-cre-, Spegfl/fl MCK-cre- and Spegfl/+ MCK-cre+, respectively. (C) qRT-PCR analysis of Speg mRNA in skeletal muscle of control and KO mice at 3 months of age. mRNA levels in KO mice were 0.7 ± 0.6% that of control mice. (D) Western blot analysis of SPEG in muscle dissected from Spegfl/+ MCK-cre-, Spegfl/+ MCK-cre+ and Spegfl/fl MCK-cre+ (Speg-KO) mice at 3 months of age. (E) Western blot analysis of SPEG in muscle dissected from unaffected het and Speg-KO mice. Heart muscle of SPEG-deficient mice displayed loss of SPEG protein.
Phenotypic findings
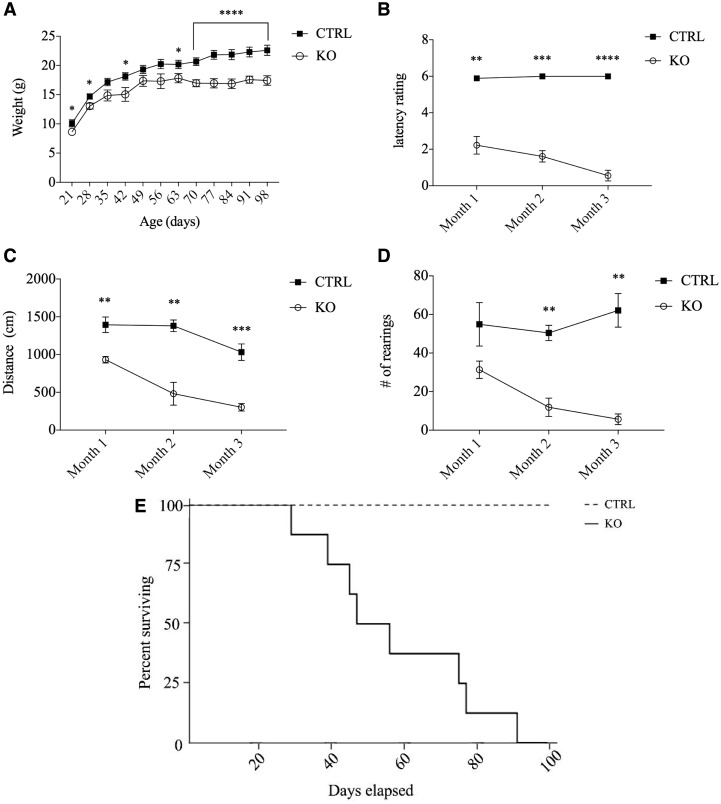
The Speg-KO mice displayed significant size differences compared to the littermate controls by P21 when the mean weights were 10.1 ± 1.9 g for the CTRL and 8.6 ± 1.2 g for the Speg-KO mice (P < 0.05). At P70, the weights of Speg-KO mice were a mean of 17.0 ± 2.1 versus 20.7 ± 2.6 g for CTRL (P < 0.0005) (Fig. 2A).
Figure 2.
Phenotypic and activity findings of Speg-MCK mice. (A) Weight progression of KO (n = 18) and CTRL (n = 18) mice in first 3 months of age. (B) Inverted hanging grip data displaying strength performance of KO (n = 4) and CTRL (n = 4) mice. Latency rating based on minute criteria from related literature (<1: 00 = 1; 1: 00–2: 00 = 2; 2: 01–3: 00 = 3; 3: 01–4: 00 = 4; 4: 01–5: 00 = 5; >5: 00 = 6). (C and D) Typical acti-track activity data of distance travelled (cm) and average number of rearings for KO (n = 4) and CTRL (n = 4). (*P < 0.05; **P < 0.005; ***P < 0.0005; ****P < 0.0001). (E) Kaplan–Meir curve demonstrating survival of KO (n = 8) and CTRL (n = 8) mice during the first 3 months of age.
An inverted grid-hanging assessment was used to assess potential changes in muscle strength over the first 3 months of age. All control mice could maintain grip on the inverted screen for at least 5 min (latency score = 6) at all monthly sessions. In comparison, at month 1, the average Speg-KO mice withstood 1–2 min of hanging (latency score = 2; P < 0.005). By month 3, the average KO mouse could grip the inverted screen for less than a minute (latency score= <1; P < 0.00005) (Fig. 2B).
Activity assays were used to assess spontaneous physical activity and endurance. A photobeam tracking apparatus measured activity levels within an open field arena (Fig. 2C). At month 1, the Speg-KO mice traveled an average distance of 462.5 cm less during a 5 min assay than CTRLs. By month 2, the KO mice traveled 898.4 cm less than the CTRL and at month 3, the mean distances traveled were 367.1 ± 67.5 cm for KO and 1116.0 ± 90.2 cm for the CTRL mice (P < 0.0005). The tracking apparatus also measured the number of rearings, vertical activity of mice in the same group (Fig. 2D). In month 1, there was no significant difference between them, but by month 2, the Speg-KO mice had an average of 38.6 ± 6.2 fewer rearings than CTRL during the 5 min trials (P < 0.005). In the third month, the decline in exploratory activity of KO mice was most severe. The KO mice reared 18.8 ± 6.8 times while the CTRL reared 64.9 ± 8.8 (P < 0.005). The mean age of Speg-KO mice who died spontaneously was 57.4 ± 7.3 days (n = 8), and as shown in the Kaplan–Meir curve (Fig. 2E), all of them were dead by 3 months. Collectively, these results reveal obvious declines in body mass, muscle strength and endurance, spontaneous motor activity and early death in the Speg-KO mice.
Histopathological findings
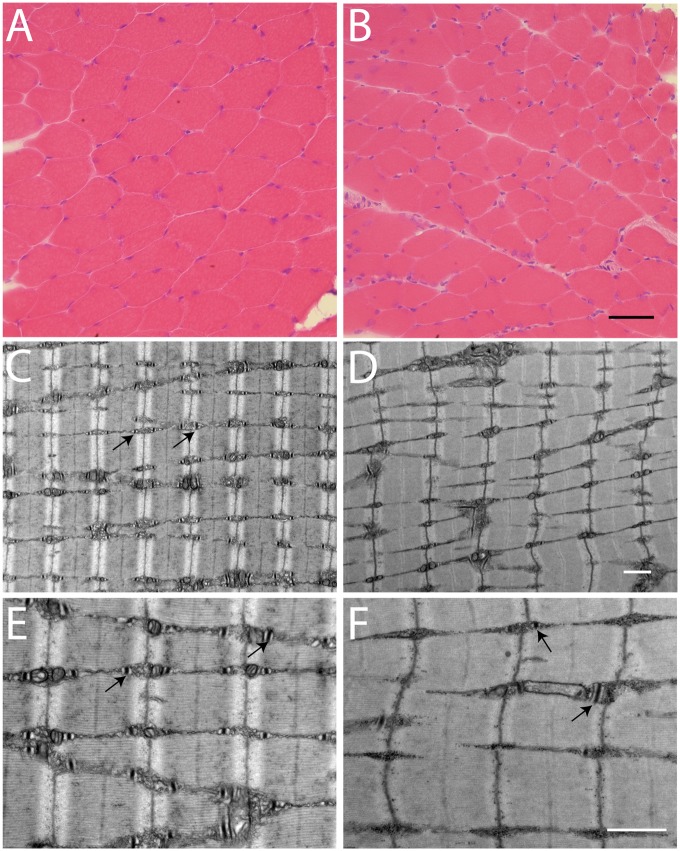
Skeletal muscle fibers from Speg-KO mice were significantly smaller and displayed marked fiber size variability on H&E staining compared with CTRLs at 3 months age (Fig. 3A–B). There was no obvious increase in central nuclei within the myofibers. Sections of quadriceps muscle were examined to evaluate myofibrils, T-tubules and sarcotubular structure using electron microscopy (EM). The EM images of KO muscle revealed structural triad abnormalities with regions of unusually small or absent triads (Fig. 3C–F). Quantitative analysis of five EM images at 3000× from two KO and two CTRL mice revealed that the total number of sarcomeres did not differ between the KO mice with an average of 186 ± 17.6 units per field and the CTRL mice with an average of 161.2 ± 8.0. However, the mean number of triads per field in KO was 176.4 ± 10.7, which was significantly fewer than 266.8 ± 14.8 seen in CTRL (P < 0.005). Additionally, the average number of triads flanking each sarcomere was significantly decreased in KO (0.94 ± 0.03) compared with CTRL (1.66 ± 0.21) (P < 0.0005). In summary, the fibers were significantly smaller and the integrity and quantity of the triads were adversely affected by the lack of SPEG.
Figure 3.
Histopathological findings in a mouse model of SPEG deficiency. (A–B) H&E staining of quadriceps cross-sections from CTRL (A) and Speg-KO mice (B). The myofibers are smaller and highly variable in size in the KO mice. Scale bar equals 50 μm. (C–F) Transmission EM in skeletal muscle (quadriceps) specimens obtained from CTRL (C, E) and Speg-KO mice (D, F). Abnormal and fewer triads are noted in the KO mice. Arrows indicate the triads. Scale bars equal 1 μm.
Contractility and muscle force
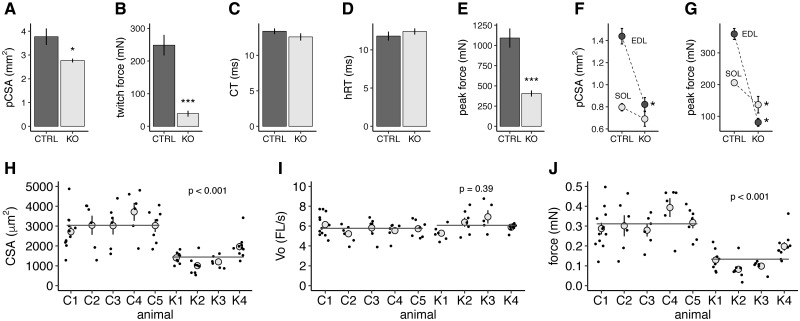
We evaluated the functional properties of the tibialis anterior (TA) muscles from CTRL and KO mice using an in situ preparation. Consistent with the histological results, the physiological cross-sectional area (pCSA) of TA muscle fibers from the KO animals was 27% less than that of the CTRL group (Fig. 4A).
Figure 4.
Reduction in CSA and contractility in hindlimb muscles of Speg-KO mice (A). Mean (±SE) pCSA of TA preparations, n = 5 for CTRL and n = 5 for KO mice. * indicates a significant difference, P < 0.05. (B) Mean (±SE) TA twitch force. *** indicates a significant difference between CTRL and KO means, P < 0.001. Number of muscles same as panel A. (C) Mean (±S.E.M.) TA twitch contraction time (CT). Number of muscles same as (A). (D) Mean (±SE) TA twitch half-relaxation time. Number of muscles same as (A). (E) Mean (±SE) TA peak force. *** indicates a significant difference between CTRL and KO means, P < 0.001. Number of muscles same as (A). (F) Mean (±SE) pCSA of EDL and soleus (SOL) muscles. A significant genotype by muscle interaction (P < 0.001) indicated that the absence of SPEG had significantly different effects on EDL versus SOL muscles. * indicates a significant difference from the corresponding CTRL mean, P < 0.05. Means based on 10 EDL CTRL, 6 EDL KO, 8 SOL CTRL and 5 SOL KO muscles. (G) Mean (±SE) peak force of EDL and SOL muscles. A significant genotype by muscle interaction (P < 0.01) indicated that the absence of SPEG had significantly different effects on EDL versus SOL muscles. * indicates a significant difference from the corresponding CTRL mean, P < 0.05. Number of muscles same as panel (F). (H) CSA of skinned TA muscle fibers. Individual CTRL animals are designated by C1–C5 and individual knock-out KO animals by K1–K4. Black points represent individual fibers within an animal, gray circles represent the mean (± SE) value for an animal, and the horizontal lines represent the overall CTRL and KO group means. P-value indicates significant difference between CTRL (N = 37 fibers) and KO (N = 32 fibers) means. (I) Unloaded shortening velocity (Vo) of Ca2+-activated TA fibers. Figure format same as (H). P-value indicates that no significant difference was detected between CTRL (N = 37 fibers) and KO (N = 27 fibers) means. (J) Peak force of Ca2+-activated TA fibers. Figure format same as (H). P-value indicates significant difference between CTRL (N = 37 fibers) and KO (N = 32 fibers) means.
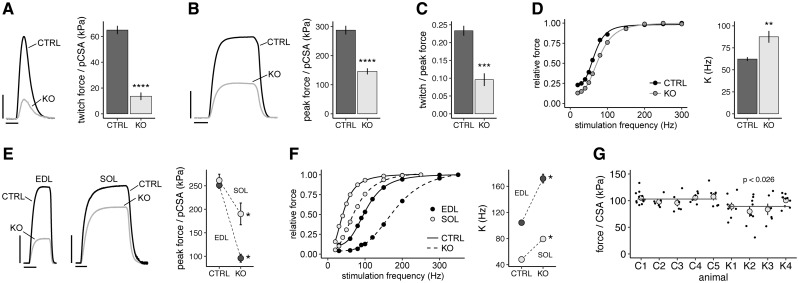
For KO mice, the isometric force response to a single supramaximal stimulus, or maximal twitch force, was very low (Fig. 4B). In order to reduce confounding due to group differences in muscle size, forces were also expressed relative to pCSA, and correcting for pCSA the twitch force was less than 25% of CTRL (Fig. 5A). The kinetics of the twitch, as assessed by contraction time (time from the onset of force to maximal twitch force) and half relaxation time (time required for force to decline from maximal to 50% of maximal), did not differ between CTRL and KO groups (Fig. 4C–D). During tetanic stimulation, TA muscles from KO mice attained significantly lower peak tension compared with control (Fig. 4E), and after correcting for pCSA achieved only 50% of normal peak tension (Fig. 5B). This peak force deficit was not as great as that noted for maximal twitch tension and examination of the ratio of twitch to peak force confirmed a disproportionate loss in twitch force (Fig. 5C). To further evaluate this selective force deficit, we studied force across a range of stimulation frequencies and fit the relationship with a sigmoidal curve (Fig. 5D). A significant increase in the average stimulation frequency at the inflection point of the relationship was noted for TA muscles from the KO mice, indicating a rightward shift in the force–frequency relationship. Overall, TA muscles from KO mice showed severe force deficits that were exacerbated at low to mid-stimulation frequencies.
Figure 5.
Contractile deficits in hindlimb muscles of Speg-KO mice corrected for CSA. (A) Left: Superimposed TA twitch force records from a representative CTRL and a Speg-KO mouse. Calibration bars represent 20 kPa and 20 ms. Right: Mean (±SE) twitch force per pCSA of CTRL and KO mice. **** indicates a significant difference between CTRL (N = 5) and KO (N = 5) means, P < 0.0001. (B) Superimposed peak force records obtained from TA preparations from a representative CTRL and Speg-KO mouse. Calibration bars represent 100 kPa and 50 ms. Right: Mean (±SE) peak TA force per pCSA of CTRL and KO mice. **** indicates a significant difference between CTRL (N = 5) and KO (N = 5) means, P < 0.0001. (C) Mean (±SE) ratio of TA twitch to peak force. *** indicates a significant difference between CTRL (N = 5) and KO (N = 5) means, P < 0.001. (D) Left: TA Force–frequency relationships for a representative CTRL and a KO TA muscle. Right: Mean (±SE) values of K, the parameter specifying the inflection point of the force-frequency relationship. ** indicates a significant difference between CTRL (N = 5) and KO (N = 5) means, P < 0.01. (E) Left: Superimposed peak force records of EDL and soleus (SOL) muscles obtained from a representative CTRL and KO mouse. Calibration bars represent 100 kPa and 100 ms. Right: Mean (±SE) peak force of EDL and SOL muscles of CTRL and KO mice. A significant genotype by muscle interaction (P < 0.01) indicated that the absence of SPEG had significantly different effects on EDL versus SOL muscles. * indicates a significant difference between CTRL and KO means, P < 0.05. Means based on 10 EDL CTRL, 6 EDL KO, 8 SOL CTRL and 5 SOL KO mice. (F) Left: Force–frequency relationships of EDL and SOL muscles from a representative CTRL and KO mouse. Right: Mean (±SE) value of K for EDL and SOL muscles. A significant genotype by muscle interaction (P < 0.001) indicated that the absence of SPEG had significantly different effects on EDL versus SOL muscles. * indicates a significant difference between CTRL and KO means, P < 0.05. Means based on 6 EDL CTRL, 6 EDL KO, 4 SOL CTRL and 5 SOL KO mice. (G) Ca2+-activated force of single TA muscle fiber segments. Individual CTRL animals are designated by C1-C5 and individual knock-out KO animals by K1–K4. Black points represent individual fibers within an animal, gray circles represent the mean (± SE) value for an animal and the horizontal lines represent the overall CTRL and KO group means. P-value indicates significant difference between CTRL (N = 37 fibers) and KO (N = 32 fibers) means.
The mouse TA is a predominately fast, glycolytic muscle. To investigate whether functional deficits were confined to this specific muscle type or whether oxidative muscles were also affected, we dissected the fast, glycolytic extensor digitorum longus (EDL) and the mixed fiber type, oxidative soleus (SOL) from CTRL and KO mice and directly compared their functional properties using an in vitro preparation. The pCSA of the EDL, but not the SOL, was significantly less in KO mice (Fig. 4F). The peak tetanic force was significantly reduced in both KO muscles (Fig. 4G), and when expressed relative to pCSA, the EDL force deficit was twice that observed for the SOL (Fig. 5E). The inflection point of the force–frequency relationship was shifted to higher frequencies for the KO EDL and SOL muscles, with the EDL affected significantly more than the SOL (Fig. 5F). In summary, both the oxidative SOL and glycolytic EDL from KO mice demonstrated contractile deficits, but the oxidative muscle was affected considerably less by the lack of SPEG.
We prepared chemically permeabilized, or ‘skinned’, muscle fiber segments in which the sarcolemma and the normal processes of excitation–contraction coupling were disrupted. By activating these fiber segments with a saturating concentration of Ca2+, we tested whether cross-bridge mechanisms of contraction were impaired by the absence of SPEG. To confirm that we were studying fibers of similar physiological type, we assayed fiber unloaded shortening velocity and found no significant difference between CTRL and KO groups (Fig. 4I). TA-skinned fibers from KO animals were significantly smaller in cross-sectional area (CSA) (Fig. 4H) and produced significantly less Ca2+-activated force in comparison with CTRL animals (Fig. 4J). However, when Ca2+-activated force was normalized to fiber CSA, the KO force deficit averaged only 15% with roughly two-thirds of the KO fibers producing force within the normal force range (Fig. 5G). This Ca2+-activated force deficit at the single fiber level can account for only a fraction of the force losses observed in our in situ TA muscle measurements (Fig. 5B) suggesting that mechanisms occurring prior to Ca2+-activation of the cross-bridges are largely responsible for the strength deficits of KO animals.
Calcium handling
Ca2+ current through the dihydropyridine receptor (DHPR) and SR Ca2+ release was simultaneously measured in CTRL and KO fibers in response to 0.5 s long depolarizing voltage steps of increasing amplitude starting at −80 mV. Illustrative Ca2+ current traces from a CTRL and a KO fiber and the mean voltage dependence of peak Ca2+ current are shown in Figure 6A–B. Fitting the peak current versus voltage values in each fiber with the appropriate function (16) showed that the maximal conductance (Gmax) was reduced by 53% in the KO fibers while the mid-activation voltage (V0.5) was 6 mV more negative than the CTRL fibers. SPEG deficiency was thus associated with a severe depression of the Ca2+ current function of the voltage sensor of E–C coupling.
Figure 6.
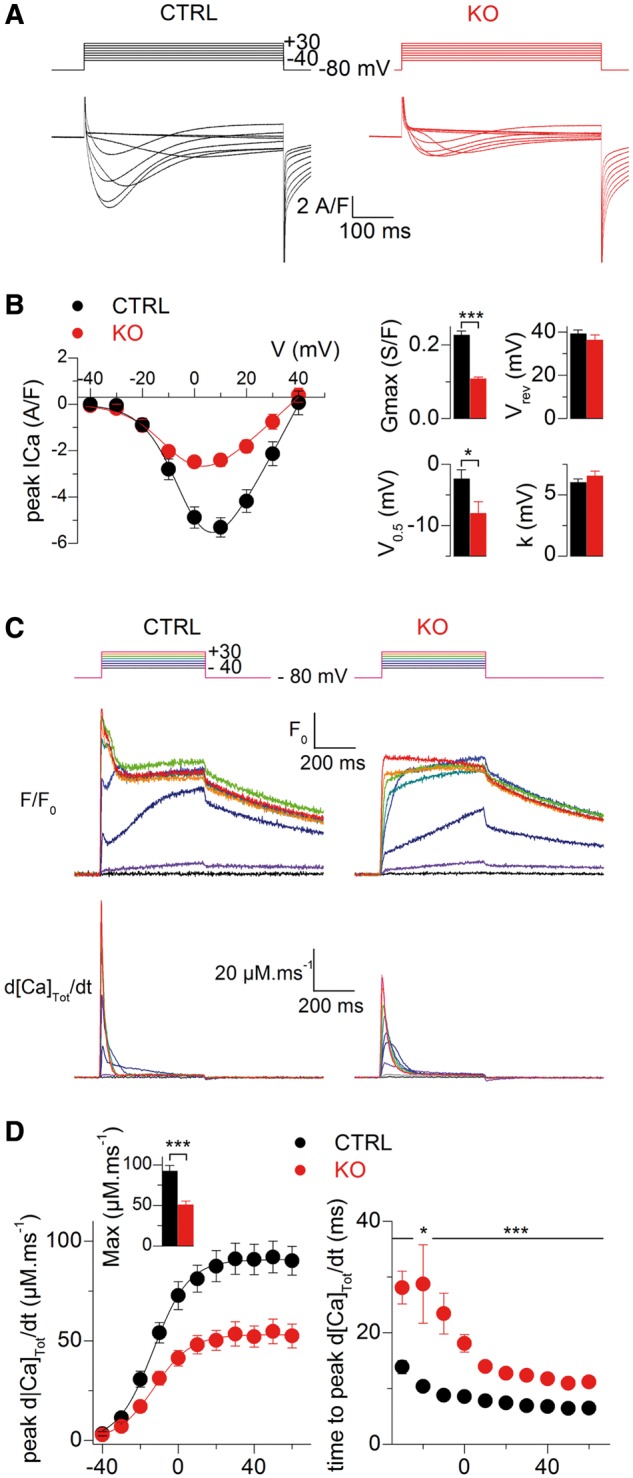
DHPR Ca2+ current and SR Ca2+ release in CTRL and SPEG-deficient muscle fibers. (A) Ca2+ current traces in response to the indicated depolarizing steps in a CTRL (left) and in a SPEG-deficient fiber (right). (B) Mean voltage-dependence of peak Ca2+ current in CTRL (black symbols, n = 24) and SPEG-deficient muscle fibers (red symbols, n = 24). Graphs on the right show mean values for the maximal conductance (Gmax), reversal potential (Vrev), mid-activation voltage (V0.5) and steepness (k) in the two groups. (C–D) Altered SR Ca2+ release in SPEG-deficient muscle fibers. (C) Changes in rhod-2 fluorescence (F/F0) and corresponding calculated rate of Ca2+ release (d[Ca]Tot/dt) in response to the pulse protocol shown on top in a CTRL (left) and in a Speg-KO muscle fiber (KO, right). F/F0 traces correspond to the average change in fluorescence over the scanned line. (D) Left, voltage dependence of the peak rate of Ca2+ release in CTRL (black symbols) and KO muscle fibers (red symbols). The inset shows the corresponding mean values for maximum rate of Ca2+ release. Right, voltage dependence of the mean time-to-peak rate of Ca2+ release in CTRL and KO fibers.
SR Ca2+ release was also profoundly affected in the KO fibers as shown in Figure 6C: the figure shows examples of line-averaged rhod-2 Ca2+ transients from a CTRL and from a KO fiber and the corresponding calculated SR Ca2+ release fluxes (bottom traces). Transients were calculated from the changes in fluorescence averaged throughout the entire scanned line. Although rhod-2 signals exhibited overall similar kinetic features in the two groups, the initial rate of rise of the transients was slower in the KO fibers, which translated into a reduced peak SR Ca2+ release in response to the pulses. The left graph in Figure 6D shows the mean voltage dependence of the peak amplitude of Ca2+ release from 25 CTRL fibers and 24 KO fibers. From fitting a Boltzmann function to the voltage dependence in each fiber, maximum Ca2+ release was depressed by a factor of 1.8 in the KO fibers (inset in Fig. 6D) with no concurrent change in the mid-activation voltage (−13.2 ± 1.5 mV in the CTRL fibers versus −15.2 ± 2.1 mV in the KO fibers) and in the steepness factor (8.7 ± 0.4 mV in the CTRL fibers versus 7.25 ± 0.45 mV in the KO fibers). In addition, the time to reach peak Ca2+ release from the beginning of the pulse was larger in the KO fibers, by ∼15 ms for pulses from −40 to −10 mV and by ∼5 ms for the largest pulses (Fig. 6D, graph on the right). Thus, both the amplitude and the kinetics of macroscopic ryanodine receptor-mediated SR Ca2+ release were affected by the Speg-KO condition in a similar way to what was reported with the myotubularin deficiency (17). One additional feature of Ca2+ release in myotubularin-deficient muscle fibers was severe spatial variability of amplitude and kinetics. This was also the case in the SPEG deficiency situation, but to a much lesser extent. Indeed, although three of the tested Speg-KO fibers did exhibit a large region of profoundly depressed Ca2+ release (Fig. 7), overall, the majority of Speg-KO fibers did not present the frequent severe local alterations of Ca2+ release that were unambiguously identified in Mtm1-KO fibers (17).
Figure 7.
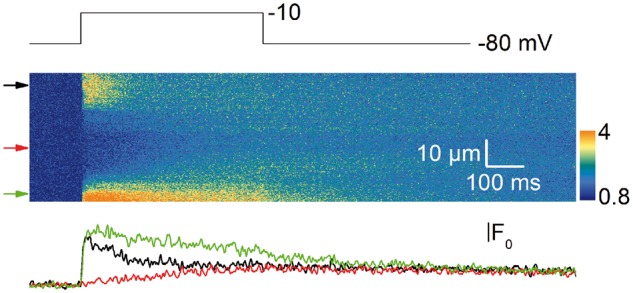
Line-scan image of Ca2+ transient from a KO fiber. Example of line-scan image of rhod-2 Ca2+ transient from a KO fiber yielding a large region of severely depressed Ca2+ release. Traces on the bottom show the changes in fluorescence at the positions indicated by the arrows on the left side of the rhod-2 image.
In order to compare the spatial variability of Ca2+ release between CTRL and KO fibers we used the analysis illustrated in Figure 8. Figure 8B shows a color-coded portion of representative line-scan rhod-2 fluorescence images from a CTRL and a KO fiber, taken while a voltage step from −80 to −10 mV was applied (Fig. 8A). Figure 8C and D shows the corresponding time derivative images and the time to peak of the derivative along the line, respectively. Whereas time-to-peak values were very uniform along the line in the CTRL fiber, there was more dispersion in the KO fiber. Figure 8E shows mean values for the standard deviation of time-to-peak of the derivative in CTRL (n = 16) and KO fibers (n = 23), for a pulse from −80 to −10 mV and for a pulse from −80 to +10 mV. There was significantly increased spatial variability in the KO fibers, especially for the lower amplitude pulse, but the amount of increase was much less (∼3 times increase at + 10 mV) than what was reported in myotubularin-deficient muscle fibers (more than 10 times increase) (18).
Figure 8.
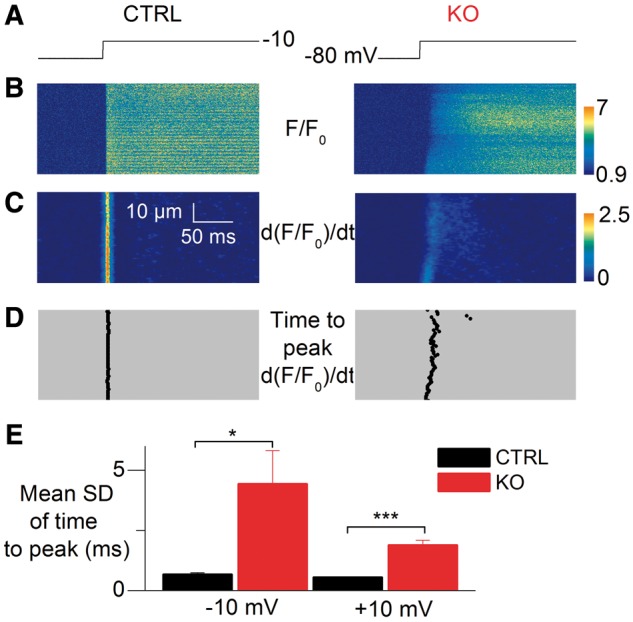
Spatial variability of SR Ca2+ release in SPEG-deficient muscle fibers. (A) Voltage pulse protocol. (B) Line-scan rhod-2 F/F0 images in a CTRL fiber (left) and in a SPEG-deficient fiber (right). (C) Corresponding images of the rate of change in F/F0 (dF/F0/dt). (D) Corresponding distribution of the time-to-peak rate of change in F/F0 along the line. (E) Mean standard deviation (SD) of the time-to-peak rate of change in F/F0 in CTRL (n = 16) and KO fibers (n = 23) for pulses from −80 to −10 and +10 mV.
Discussion
This study identifies SPEG to be a critical protein in triad maintenance, calcium release and E-C coupling. We had previously identified three patients with CNM due to SPEG deficiency (1). Since then, additional CNM patients carrying SPEG mutations have been reported (2). As constitutive Speg KO mice die early, often as late embryos, we created conditional KO mice and bred them with striated muscle-specific cre-expressing mice (MCK-cre) with delayed cre expression to prevent early lethality. Those striated muscle-specific Speg-KO mice exhibited drastic reductions in body mass, physical activity, muscle strength and endurance. Their muscle function progressively worsened until their early demise by 3 months of age.
Examination of muscle samples from striated muscle-specific Speg-KO mice did not reveal an increase in the frequency of central nuclei as described in human patients and constitutive Speg-KO mice (1). This may be due to the delayed excision of Speg in the current mouse model although this needs to be explored further. Our EM studies revealed markedly abnormal and fewer triads which suggests defective excitation–contraction coupling and consequent contractile dysfunction. This was confirmed using in situ and in vitro skeletal muscle preparations, which revealed that weakness was more apparent at low stimulation frequencies and in muscles expressing predominately fast myosin isoforms. Subsequent mechanistic studies conducted on Speg-KO fast type 2 fibers revealed only a mild loss of function at the level of cross-bridge formation but profound reductions in the Ca2+ current function of the voltage-sensor and in Ca2+ release from the SR. Taken together, these results suggest that correcting or enhancing SR Ca2+ release or increasing the sensitivity of the thin filament regulatory proteins to Ca2+ may be a promising therapeutic approach for individuals with SPEG mutations.
A recent study has described the role of SPEG in cardiac muscle wherein SPEG deficiency results in loss of T-tubules in the cardiac muscle leading to downstream calcium mishandling and heart failure (18). Our study shows similar triad defects in the skeletal muscle, abnormal calcium release from the SR and consequent skeletal muscle dysfunction. Together these studies suggest that SPEG performs similar functions in cardiac and skeletal muscles, and ways to augment calcium release or increase Ca2+-sensitivity may benefit both systems.
While less severe, the amplitude and kinetics of SR Ca2+ release from SPEG-deficient fibers resembled the defect reported in myotubularin-deficient fibers (17). This is interesting as defects in both proteins cause CNM and we have previously reported that myotubularin interacts with SPEG (1). In contrast, while SPEG deficiency causes both cardiac and skeletal muscle dysfunction, myotubularin deficiency essentially spares the cardiac muscle. The underlying mechanism of cardiac sparing in myotubularin deficiency is poorly understood and there may be underlying compensatory mechanisms yet to be deciphered.
In summary, elimination of SPEG from postnatal mouse skeletal muscle produces a myopathy characterized by fewer and defective triads, affecting Ca2+ current function of the voltage-sensor and calcium release from the SR and consequent reduced contractility. Approaches that include augmentation of calcium release from the SR or increasing the Ca2+-sensitivity of the regulatory proteins may benefit such patients.
Materials and Methods
Animal studies
All studies were performed with approval from the institutional animal care and use committee at Boston Children's Hospital (Boston, MA, USA) and at the University Claude Bernard—Lyon 1, France.
Gene targeting, generation of Speg-conditional KO and Speg-KO mice
Speg-conditional KO mouse generation was performed by inGenious Targeting Laboratory (Ronkonkoma, NY, USA) and exons 14-17 of the Speg gene were targeted. Detailed procedures are presented in Supplementary Material, Materials and Methods.
The homozygous Speg-conditional KO mice (Spegfl/fl) were bred with male transgenic mice (MCK-Cre+) who have the Cre recombinase driven by muscle creatine kinase promoter, with Cre activity observed in skeletal and cardiac muscle. These mice [B6.FVB(129S4)-Tg(Ckmm-cre)5Khn/J] were imported from Jackson Laboratories (Bar Harbor, Maine, USA) and screened for MCK-cre transgene using the primers described previously (19). Spegfl/fl: MCK-cre+ mice were the Speg-KO mice that were utilized for further experiments.
RT-PCR analysis
RNA was extracted from various muscle groups. QRT–PCR analysis was performed as described previously (19). The relative amount of target gene expression in Speg−/− animals was calculated as fold changes relative to CTRL that were normalized to GAPDH. Further details are described in SI Materials and Methods.
Western blot analysis
At three months of age, tissues from various muscles and organs were dissected, frozen and stored at −80°C until analysis. Protein isolation and western blot procedures were performed as described previously (19). Further details are described in SI Materials and Methods.
Histopathological studies and electron microscopy
Light microscopy, H&E staining and EM were performed as described previously (19) and further details are in SI Materials and Methods.
Activity tracking
ActiTrack software used photobeam tracking to evaluate locomotor and behavioral activity within open-field arenas (ACTITRACK V2.7, Panlab, S.L.U., Barcelona, Spain). ActiTrack tracking software utilized Panlab IR actimeters (up to 32 IR frames). The experiment provides measures of general physical motor abilities. Specific parameters (distance and number of rearings) were evaluated to assess muscle function. Mice were allowed to freely explore the chamber for the duration of the 5 min session. Each line crossed or photocell beam break was scored as one unit of activity.
Inverted grip hanging test
An inverted screen assessment was used to evaluate grip strength. The mice were placed on a wire screen and slowly inverted 180 degrees to hang upside down at roughly 8 in. above padded table. Upon inversion, the mice were timed (seconds) on hanging duration, with the maximum time set for 300 s. Latency rating based on minute criteria (<1:00 = 1; 1:00-2:00 = 2; 2:01–3:00 = 3; 3:01–4:00 = 4; 4:01–5:00 = 5; >5:00 = 6). Two trials with rest periods in between were performed on each mouse every other day over 1 week (total of 3 days). The weeklong trial spans were conducted monthly for the first 3 months of age.
Muscle contractility
TA, EDL and soleus (SOL) muscles were studied using physiological preparations as described previously (20,21). Force measurements in relation to stimulation frequency was performed as described previously (22). Detailed procedures are presented in SI Materials and Methods.
Skinned muscle fiber contractility
The basic procedures, including the composition of the EGTA-buffered relaxing (pCa 9.0, where pCa is the −log[Ca2+]) and Ca2+-activating (pCa 4.5) solutions, have been described previously (23,24). Detailed procedures are presented in SI Materials and Methods.
Electrophysiology and Ca2+ release
DHPR Ca2+ current and confocal measurements of intracellular Ca2+ were performed in single isolated, voltage-clamped muscle fibers from mouse, following previously described procedures (15,23,24). The holding voltage was set to −80 mV. Detailed procedures are presented in SI Materials and Methods.
Data analysis and statistics
Results are expressed as mean ± S.E.M. unless indicated otherwise. Student t-test was used to determine statistically significant differences between KO and CTRL groups for behavioral/muscle performance, ultra-structural quantification, contractility of slow- and fast-fiber muscles and calcium-handling experiments.
Supplementary Material
Supplementary Material is available at HMG online.
Conflict of Interest statement. None declared.
Supplementary Material
Funding
This work was supported by the National Institute of Arthritis and Musculoskeletal and Skeletal Diseases of National Institute of Health (NIH) [R01 AR068429 to P.B.A., R01 AR044345 to A.H.B], the National Institute of Child Health and Human Development (NICHD) [R01 HD075802 to A.H.B], and National Human Genome Research Institute of NIH [U19 HD077671 to P.B.A. and A.H.B.], and the Muscular Dystrophy Association [MDA383249 to A.H.B.]. V.J. was supported by grants from the National Center of Scientific Research, France, the National Institute for Health and Medical Research (INSERM) France, Université Claude Bernard Lyon 1, and AFM-Téléthon (MyoNeurALP program). C.K. was recipient of a Ph.D. fellowship from AFM-Téléthon.
References
- 1. Agrawal P.B., Pierson C.R., Joshi M., Liu X., Ravenscroft G., Moghadaszadeh B., Talabere T., Viola M., Swanson L.C., Haliloğlu G.. et al. (2014) SPEG interacts with myotubularin, and its deficiency causes centronuclear myopathy with dilated cardiomyopathy. Am. J. Hum. Genet., 95, 218–226. [DOI] [PMC free article] [PubMed] [Google Scholar]
- 2. Wang H., Castiglioni C., Kacar Bayram A., Fattori F., Pekuz S., Araneda D., Per H., Erazo R., Gumus H., Zorludemir S.. et al. (2017) Insights from genotype-phenotype correlations by novel SPEG mutations causing centronuclear myopathy. Neuromuscul. Disord., 27, 836–842. [DOI] [PubMed] [Google Scholar]
- 3. North K.N., Wang C.H., Clarke N., Jungbluth H., Vainzof M., Dowling J.J., Amburgey K., Quijano-Roy S., Beggs A.H., Sewry C.. et al. (2014) Approach to the diagnosis of congenital myopathies. Neuromuscul. Disord., 24, 97–116. [DOI] [PMC free article] [PubMed] [Google Scholar]
- 4. Bevilacqua J.A., Monnier N., Bitoun M., Eymard B., Ferreiro A., Monges S., Lubieniecki F., Taratuto A.L., Laquerriere A., Claeys K.G.. et al. (2011) Recessive RYR1 mutations cause unusual congenital myopathy with prominent nuclear internalization and large areas of myofibrillar disorganization. Neuropathol. Appl. Neurobiol., 37, 271–284. [DOI] [PubMed] [Google Scholar]
- 5. Bitoun M., Maugenre S., Jeannet P.Y., Lacene E., Ferrer X., Laforet P., Martin J.J., Laporte J., Lochmuller H., Beggs A.H.. et al. (2005) Mutations in dynamin 2 cause dominant centronuclear myopathy. Nat. Genet., 37, 1207–1209. [DOI] [PubMed] [Google Scholar]
- 6. Nicot A.S., Toussaint A., Tosch V., Kretz C., Wallgren-Pettersson C., Iwarsson E., Kingston H., Garnier J.M., Biancalana V., Oldfors A.. et al. (2007) Mutations in amphiphysin 2 (BIN1) disrupt interaction with dynamin 2 and cause autosomal recessive centronuclear myopathy. Nat. Genet., 39, 1134–1139. [DOI] [PubMed] [Google Scholar]
- 7. Laporte J., Hu L.J., Kretz C., Mandel J.L., Kioschis P., Coy J.F., Klauck S.M., Poustka A., Dahl N. (1996) A gene mutated in X-linked myotubular myopathy defines a new putative tyrosine phosphatase family conserved in yeast. Nat. Genet., 13, 175–182. [DOI] [PubMed] [Google Scholar]
- 8. Ceyhan-Birsoy O., Agrawal P.B., Hidalgo C., Schmitz-Abe K., Dechene E.T., Swanson L.C., Soemedi R., Vasli N., Iannaccone S.T., Shieh P.B.. et al. (2013) Recessive truncating titin gene, TTN, mutations presenting as centronuclear myopathy. Neurology, 81, 1205–1214. [DOI] [PMC free article] [PubMed] [Google Scholar]
- 9. Al-Qusairi L., Weiss N., Toussaint A., Berbey C., Messaddeq N., Kretz C., Sanoudou D., Beggs A.H., Allard B., Mandel J.L.. et al. (2009) T-tubule disorganization and defective excitation-contraction coupling in muscle fibers lacking myotubularin lipid phosphatase. Proc. Natl. Acad. Sci. U. S. A., 106, 18763–18768. [DOI] [PMC free article] [PubMed] [Google Scholar]
- 10. Amoasii L., Hnia K., Chicanne G., Brech A., Cowling B.S., Muller M.M., Schwab Y., Koebel P., Ferry A., Payrastre B.. et al. (2013) Myotubularin and PtdIns3P remodel the sarcoplasmic reticulum in muscle in vivo. J. Cell Sci., 126, 1806–1819. [DOI] [PubMed] [Google Scholar]
- 11. Dowling J.J., Vreede A.P., Low S.E., Gibbs E.M., Kuwada J.Y., Bonnemann C.G., Feldman E.L. (2009) Loss of myotubularin function results in T-tubule disorganization in zebrafish and human myotubular myopathy. PLoS Genet., 5, e1000372.. [DOI] [PMC free article] [PubMed] [Google Scholar]
- 12. Hsieh C.M., Fukumoto S., Layne M.D., Maemura K., Charles H., Patel A., Perrella M.A., Lee M.E. (2000) Striated muscle preferentially expressed genes alpha and beta are two serine/threonine protein kinases derived from the same gene as the aortic preferentially expressed gene-1. J. Biol. Chem., 275, 36966–36973. [DOI] [PubMed] [Google Scholar]
- 13. Liu X., Hall S.R., Wang Z., Huang H., Ghanta S., Di Sante M., Leri A., Anversa P., Perrella M.A. (2015) Rescue of neonatal cardiac dysfunction in mice by administration of cardiac progenitor cells in utero. Nat. Commun., 6, 8825.. [DOI] [PMC free article] [PubMed] [Google Scholar]
- 14. Liu X., Ramjiganesh T., Chen Y.H., Chung S.W., Hall S.R., Schissel S.L., Padera R.F. Jr, Liao R., Ackerman K.G., Kajstura J.. et al. (2009) Disruption of striated preferentially expressed gene locus leads to dilated cardiomyopathy in mice. Circulation, 119, 261–268. [DOI] [PMC free article] [PubMed] [Google Scholar]
- 15. Bruning J.C., Michael M.D., Winnay J.N., Hayashi T., Horsch D., Accili D., Goodyear L.J., Kahn C.R. (1998) A muscle-specific insulin receptor knockout exhibits features of the metabolic syndrome of NIDDM without altering glucose tolerance. Mol. Cell, 2, 559–569. [DOI] [PubMed] [Google Scholar]
- 16. Weiss N., Andrianjafiniony T., Dupre-Aucouturier S., Pouvreau S., Desplanches D., Jacquemond V. (2010) Altered myoplasmic Ca(2+) handling in rat fast-twitch skeletal muscle fibres during disuse atrophy. Pflugers Arch., 459, 631–644. [DOI] [PubMed] [Google Scholar]
- 17. Kutchukian C., Lo Scrudato M., Tourneur Y., Poulard K., Vignaud A., Berthier C., Allard B., Lawlor M.W., Buj-Bello A., Jacquemond V. (2016) Phosphatidylinositol 3-kinase inhibition restores Ca2+ release defects and prolongs survival in myotubularin-deficient mice. Proc. Natl. Acad. Sci. U. S. A., 113, 14432–14437. [DOI] [PMC free article] [PubMed] [Google Scholar]
- 18. Quick A.P., Wang Q., Philippen L.E., Barreto-Torres G., Chiang D.Y., Beavers D., Wang G., Khalid M., Reynolds J.O., Campbell H.M.. et al. (2017) SPEG (striated muscle preferentially expressed protein kinase) is essential for cardiac function by regulating junctional membrane complex activity. Circ. Res., 120, 110–119. [DOI] [PMC free article] [PubMed] [Google Scholar]
- 19. Agrawal P.B., Joshi M., Savic T., Chen Z., Beggs A.H. (2012) Normal myofibrillar development followed by progressive sarcomeric disruption with actin accumulations in a mouse Cfl2 knockout demonstrates requirement of cofilin-2 for muscle maintenance. Hum. Mol. Genet., 21, 2341–2356. [DOI] [PMC free article] [PubMed] [Google Scholar]
- 20. Alexander M.S., Casar J.C., Motohashi N., Vieira N.M., Eisenberg I., Marshall J.L., Gasperini M.J., Lek A., Myers J.A., Estrella E.A.. et al. (2014) MicroRNA-486-dependent modulation of DOCK3/PTEN/AKT signaling pathways improves muscular dystrophy-associated symptoms. J. Clin. Invest., 124, 2651–2667. [DOI] [PMC free article] [PubMed] [Google Scholar]
- 21. Tabebordbar M., Zhu K., Cheng J.K.W., Chew W.L., Widrick J.J., Yan W.X., Maesner C., Wu E.Y., Xiao R., Ran F.A.. et al. (2016) In vivo gene editing in dystrophic mouse muscle and muscle stem cells. Science, 351, 407–411. [DOI] [PMC free article] [PubMed] [Google Scholar]
- 22. Chan S., Head S.I., Morley J.W. (2007) Branched fibers in dystrophic mdx muscle are associated with a loss of force following lengthening contractions. Am. J. Physiol. Cell Physiol., 293, C985–C992. [DOI] [PubMed] [Google Scholar]
- 23. Choi S.J., Widrick J.J. (2010) Calcium-activated force of human muscle fibers following a standardized eccentric contraction. Am. J. Physiol. Cell Physiol., 299, C1409–C1417. [DOI] [PubMed] [Google Scholar]
- 24. Lawlor M.W., Armstrong D., Viola M.G., Widrick J.J., Meng H., Grange R.W., Childers M.K., Hsu C.P., O'Callaghan M., Pierson C.R.. et al. (2013) Enzyme replacement therapy rescues weakness and improves muscle pathology in mice with X-linked myotubular myopathy. Hum. Mol. Genet., 22, 1525–1538. [DOI] [PMC free article] [PubMed] [Google Scholar]
Associated Data
This section collects any data citations, data availability statements, or supplementary materials included in this article.


