

Abstract
Developmental deconvolution of complex organs and tissues at the level of individual cells remains challenging. Non-invasive genetic fate mapping1 has been widely used, but the low number of distinct fluorescent marker proteins limits its resolution. Much higher numbers of cell markers have been generated using viral integration sites2, viral barcodes3, and strategies based on transposons4 and CRISPR/Cas9 genome editing5; however, temporal and tissue-specific induction of barcodes in situ has not been achieved. Here we report the development of an artificial DNA recombination locus (termed Polylox) that enables broadly applicable endogenous barcoding based on the Cre-loxP recombination system6,7. Polylox recombination in situ reaches a practical diversity of several hundred thousand barcodes, allowing tagging of single cells. We have used this experimental system, combined with fate mapping, to assess haematopoietic stem cell (HSC) fates in vivo. Classical models of haematopoietic lineage specification assume a tree with few major branches. More recently, driven in part by the development of more efficient single-cell assays and improved transplantation efficiencies, different models have been proposed, in which unilineage priming may occur in mice and humans at the level of HSCs8–10. We have introduced barcodes into HSC progenitors in embryonic mice, and found that the adult HSC compartment is a mosaic of embryo-derived HSC clones, some of which are unexpectedly large. Most HSC clones gave rise to multilineage or oligolineage fates, arguing against unilineage priming, and suggesting coherent usage of the potential of cells in a clone. The spreading of barcodes, both after induction in embryos and in adult mice, revealed a basic split between common myeloid-erythroid development and common lymphocyte development, supporting the long-held but contested view of a tree-like haematopoietic structure.
To take advantage of available mutants expressing inducible Cre recombinase in specific cell types or developmental stages, we designed a DNA cassette, Polylox, for endogenous barcoding. Polylox is composed of ten loxP sites in alternating orientations spaced 178 base pairs (bp) apart11, thus allowing excisions and inversions (Fig. 1a). The intervening nine DNA blocks have unique sequences based on the AT2G21770 gene from Arabidopsis thaliana, serving as the barcode ‘alphabet’ (Fig. 1a; Supplementary Data). We reasoned that random partial recombination could generate large combinatorial diversity in this substrate. Incubation of the Polylox DNA with Cre recombinase in vitro resulted in incomplete recombination, yielding fragments of five lengths containing nine, seven, five, three, or one DNA segments (Fig. 1b) with extensive shuffling (Supplementary Table 1). We targeted the non-expressed Polylox DNA cassette into the Gt(ROSA)26Sor (also known as Rosa26) locus in embryonic stem (ES) cells (Extended Data Fig. 1a). Rosa26Polylox/+ ES cells were transfected with a plasmid encoding a tamoxifen-inducible version of Cre (MerCreMer) (Methods). Treatment of these cells with 4-hydroxy-tamoxifen (4-OHT) yielded all five DNA fragments already after 3 hours, followed by increasing appearance of shorter fragments (Extended Data Fig. 1b). In pulse-chase experiments with 4-OHT, loxP site recombinations remained incomplete (Extended Data Fig. 1c), demonstrating that Cre does not strictly act processively.
Figure 1. Polylox: A Cre recombinase-driven artificial DNA recombination substrate.

a, Structure of the Polylox cassette with loxP sites (triangles; black and white split symbolizes recombination site). Colored linkers represent DNA segments ‘1’-‘9’. Examples for recombination products resulting from one Cre-mediated excision, and one Cre-mediated inversion are shown. The original code segments (‘letters’) are abbreviated ‘1’-‘9’, and their inversions ‘A’-‘I’. b, In vitro digestion of Polylox DNA insert in pWP-AG vector by Cre recombinase, and size resolution of recombination products by gel electrophoresis (Supplementary Fig. 1a).
For in vivo barcoding, we generated Rosa26Polylox/+ C57BL/6 mice. We crossed the Rosa26Polylox allele into mice with ubiquitously expressed, tamoxifen-dependent Cre (Rosa26Polylox/CreERT2 mice) and, for endogenous barcoding of HSC, into mice that express tamoxifen-inducible Cre from the Tek (also known as Tie2) locus14 (Rosa26PolyloxTie2MCM mice). Barcodes are retrieved from purified cells by single molecule real time (SMRT) sequencing across the entire locus (Extended Data Fig. 1d). Owing to the large sequence differences between the individual DNA segments (Supplementary Table 2), we uniquely mapped 99% of all intact Polylox reads to barcodes (example in Extended Data Fig. 2a, b; Supplementary Methods). Endogenous barcoding strictly depended on the presence of tamoxifen in Rosa26PolyloxTie2MCM mice (Extended Data Fig. 2c, Supplementary Table 3).
We mathematically examined the diversity of Polylox barcodes as a function of the number of recombinations. We generated all possible Polylox barcodes in silico, finding 1.866.868 distinct codes (Supplementary Methods). Considering only the first four loxP sites for simplicity, Fig. 2a depicts a small subset of codes connected by recombinations. Computing all possible barcode connections, one excision or one inversion can generate 45 distinct codes from the unrecombined sequence ‘123456789’, a second recombination event adds a further 630 codes, and so on; all ~1.8 million codes can be reached by 10 events (Fig. 2b). The probability of barcode generation (Pgen) was calculated by considering all paths that lead from the unrecombined Polylox cassette to a given final barcode. Next we assigned Pgen to each barcode for given numbers of recombination events within the experimentally observed range (Extended Data Fig. 3a-d, Supplementary Methods). Barcodes reached by a small number of long paths (e.g., involving multiple inversions) have very low generation probabilities.
Figure 2. Combinatorics of Polylox barcoding.

a, Illustration of stepwise recombinations, considering only the DNA segments and loxP sites in the red box. The decreasing green shades indicate an increase in the minimum number of recombination events required to generate a given barcode. b, Calculation of theoretical numbers of barcodes reached with increasing recombination events in the Polylox locus, with a maximum barcode number of > 1.8 million.
To assess barcode diversity experimentally, we induced Polylox recombination in a Rosa26Polylox/CreERT2 mouse, and 18 hours later analyzed the acutely generated barcodes in 30,000 splenic B cells. 52% of the recovered reads were recombined, indicating recombination in about half of the cells. We identified 849 different barcodes (Fig. 3a), which require up to six recombination events for their generation (Extended Data Fig. 3e). With this number of recombinations, the model predicts a diversity of 611,260 barcodes, (Fig. 2b), of which 2,920 ± 35 (mean ± s.d.) distinct barcodes should be generated in 15,000 cells (Extended Data Fig. 3f). Hence, we measured nearly one third (849) of the expected number of barcodes. Their computed Pgen spanned more than 10 orders of magnitude (Fig. 3a). Of note, CRISPR/Cas9 barcoding also yields rare and abundant barcodes 5,12. To experimentally probe the Pgen calculations, we compared barcodes from three mice (Fig. 3b). About 50% of the barcodes were unique in each mouse, consistent with theoretical expectation (Extended Data Fig. 3f), and the observed unique barcodes had low generation probabilities (Fig. 3c). On this basis, we used Pgen to filter for uniquely induced barcodes in fate mapping experiments (specifically, barcodes with Pgen < 10−4 will be induced with near certainty only once when labeling 1,000 stem cells). In summary, Polylox allows for large barcode diversity in vivo and unique labeling of individual cells.
Figure 3. Polylox barcoding in vivo.

a, Barcodes in splenic B cells isolated 18 hours after induction of recombination by tamoxifen in Rosa26Polylox/CreERT2 mice. Barcodes were ranked according to their generation probability, considering inversions (Pinv) equally likely as excisions (Pexc) (black line), or half as likely (blue line), or twice as likely (red line). Barcode examples are shown with inversions (blue numbers) and deletions (red numbers) underlying barcode generation. The decadic logarithm is used here and throughout the paper. b, Venn diagrams indicating unique and shared barcodes in three independent samples (mice # 1, 2, 3; Extended Data Table 1). c, Generation probabilities of barcodes shared between all mice (n=177 barcodes) (‘All’), between two mice (n=255) (‘2’), and unique barcodes occurring only in one mouse (n=1042) (‘unique’) in the Venn diagrams shown in b (red line, median; box ends, 25% and 75% percentiles).
HSC arise beginning at embryonic day (E) 9.5 in the mouse embryo13, and colonize the bone marrow around birth. To study the origin and clonal composition of HSC in the adult bone marrow after embryonic barcode induction, we treated Rosa26PolyloxTie2MCM embryos at E9.5 with a single tamoxifen dose given to the mother. At 9-11 months after birth, we removed the bone marrow from two mice (Extended Data Table 1), and determined the barcodes of sorted single HSC (Fig. 4a). In both experiments, > 95% of adult HSC had recombined barcodes. Hence, Tie2-driven barcoding covers essentially all cells in the midgestation embryo that later form the adult HSC compartment in the bone marrow. We then focused on barcodes induced with high confidence in single embryonic HSC progenitors (Pgen < 10−4), obtaining 14 such barcodes (Fig. 4b). Their adult clone sizes ranged from 0.2% – 3.8% (Fig. 4b, Extended Data Fig. 4), and included in both experiments remarkably large clones (e.g., ‘CFG4E89’, ‘7456A’, ‘I61’ and ‘561’, all being above 1.5%). Thus, by extrapolation to the whole adult HSC population (~15,000 HSCs), single HSC progenitors in the embryo can give rise to individual HSC clones in the bone marrow that possess several hundred members. The ready detection of such large clones suggests that they are a major ‘structure’ in adult bone marrow.
Figure 4. Polylox barcoding in embryonic mice and HSC fate mapping.

a, Barcode induction in emerging HSC in embryonic mice, and analysis of barcodes in single HSC and the indicated populations in adult mice at nine (Exp. 1) and eleven (Exp. 2) months of age. HSC sites (yolk sac, aorta-gonad-mesonephros (AGM), fetal liver and bone marrow) are depicted. b, Frequency distributions of barcodes found in 382 recombined HSC (Exp. 1), and in 427 recombined HSC (Exp. 2) (for numbers of unique barcodes see Extended Data Fig. 4). Redundant length ‘1’ barcodes are not displayed. Light blue, barcodes with Pgen > 10–4; other colors mark clones with Pgen < 10–4; there were five such clones in Exp. 1, and nine in Exp. 2. c, Barcode overlay of independent samples from Exp. 1. Venn diagrams indicate numbers of shared and non-shared barcodes between repeat samples of indicated populations. d, Heatmap of barcodes in HSCs (first lane) and the indicated erythroid, myeloid and lymphoid lineages in Exp. 1 (Gr, granulocytes; BM, bone marrow; Sp, spleen; PEC, peritoneal exudate cells; numbers in parentheses indicate independent samples from the same lineage). e, Heatmap of individual HSC clones satisfying embryonic single cell barcode induction criteria, and their lineage output in Exp. 1 and Exp. 2. CMP and GMP were isolated and analyzed only in Exp. 2 (N.D., not done). f, Heatmap of peripheral barcodes (Pgen < 10–4, and detected in two independent samples of the same population) sorted according to lineage output (Exp. 1). Frequencies of barcodes are represented by color-coded scales on the right for d and e, or for f.
To analyze barcode propagation from HSC to peripheral lineages, we sorted from the mice investigated for adult HSC (Fig. 4a,b) erythrocyte progenitor (EryP) stages (EryP I-IV) from bone marrow (BM), granulocytes (Gr) from bone marrow and spleen (Sp), B1a, B1b and conventional B (B2) cells from the peritoneal cavity, and B2 cells, CD4 T cells and CD8 T cells from the spleen (Extended Data Fig. 5) (1 - 4 x10⁴ cells per sample). These sorted populations were then analyzed for barcodes. Many barcodes overlapped in sample repeats (Fig. 4c). Nevertheless, barcodes may be missed in samples, and hence the range of fates acquired by particular clones may sometimes be underestimated. Many embryonically marked HSC produced output14, including short-lived granulocytes and EryP (Fig. 4d). Focusing on the barcodes which most likely originate from single HSC progenitors and hence represent HSC clones, we found evidence for multipotent clones (Fig. 4e). While these clones underwent multilineage differentiation, we cannot formally conclude that individual cells within a clone did. However, some HSC clones produced oligolineage, myeloid-erythroid output (‘CFG4E89’, ‘7456A’,’E87’, ‘561’). Such lineage-restricted fates suggest that individual cells within an HSC clone show coherent usage of their developmental potential. To gain broader insights into HSC fates realized in vivo, we considered all barcodes obtained from the peripheral lineage samples in the two experiments (Fig. 4, Extended Data Fig. 6). Barcodes that arose in single embryonic HSC progenitors and propagated to the periphery identified productive HSC clones (for further validation of the Pgen threshold, see Extended Data Fig. 3g). To guard against undersampling, we considered only clonal HSC codes that were detected in both repeat samples of at least one lineage. We obtained 117 barcodes, of which nearly half (54) were represented in all assayed lineages, and a further 44 were found in several lineages (Fig. 4f, Extended Data Fig. 6b). Thus the majority of embryonic HSC progenitors give rise to several mature cell types in the adult.
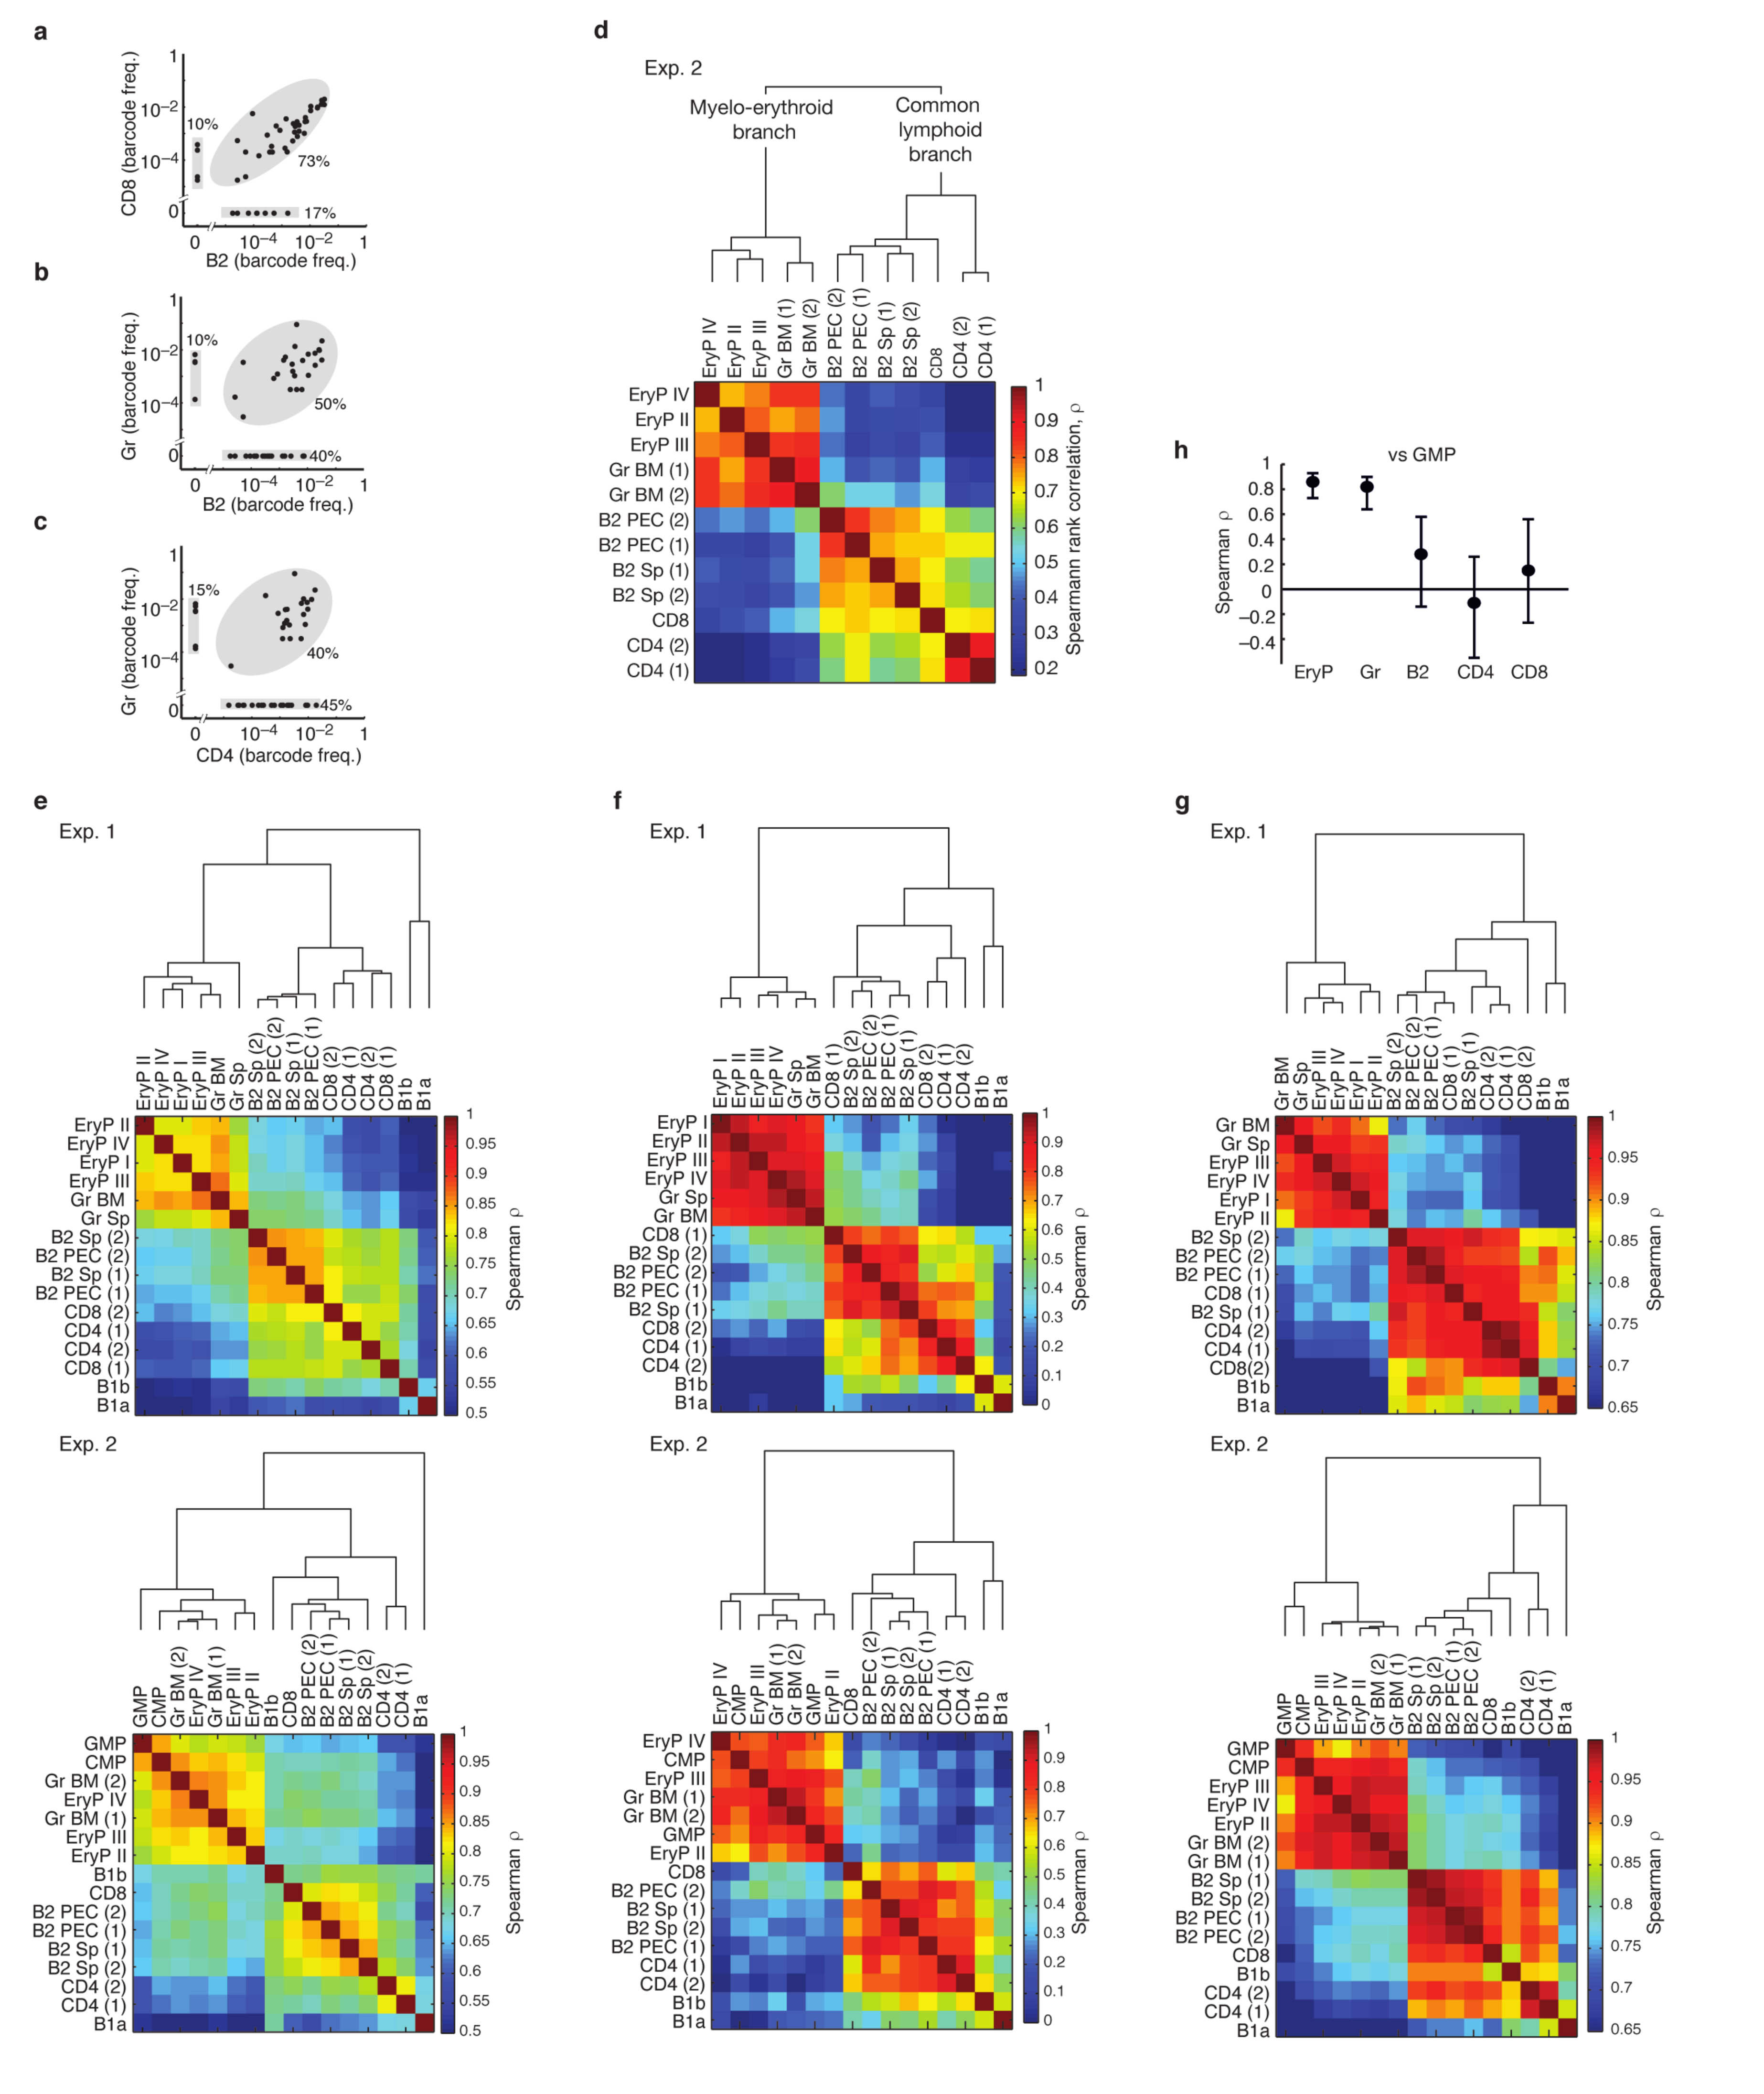
The emergence of barcodes from HSC into peripheral lineages is also informative regarding lineage pathways. If two peripheral lineages share many barcodes at similar frequencies they are likely to have arisen from a common developmental pathway; if not, they probably developed more independently. Barcodes found in EryP and granulocytes were highly concordant (Fig. 5a), whereas EryP and B2 lymphocytes shared many fewer barcodes, and, even when shared, their frequencies were poorly correlated (Fig. 5b; for further populations see Extended Data Fig. 7a-c). The Spearman rank correlation coefficient (ρ) quantifies the degree of barcode concordance (Fig. 5c). Clustering all assayed lineages by rank correlation revealed clearly distinct myelo-erythroid and common lymphoid branches (Fig. 5d, Extended Data Fig. 7d). The lack of a clear split between the T and B lymphocyte sub-lineages implies intimate linkage of T and B cell development. The dichotomy of myelo-erythroid and lymphoid branches was not disturbed when all barcodes were analyzed, hence it remained evident even in the presence of non-clonal barcode ‘background’ (Extended Data Fig. 7e). The two major branches cannot only be explained by lineage-restricted HSC output because distinct myelo-erythroid and lymphoid pathways also emerged from multipotent HSC clones (Extended Data Fig. 7f). Of note, erythrocytes have a ~40fold longer lifespan than granulocytes, yet both populations cluster tightly together according to barcode representation. This finding indicates that the different lifetimes of mature lineages do not prevent barcode correlations, and hence that the separation of the common lymphoid branch is not solely due to the longer lifetime of lymphocytes compared to myeloid cells. This notion is further supported by cluster analysis of barcodes from adult HSC clones (Extended Data Fig. 7g). Notably, the B1a sublineage of B cells was a distinct lineage within the common lymphoid branch, clearly separate from B2 cells and T cells; in most but not all cases, the B1b sublineage co-segregated with B1a cells (Fig. 5e, Extended Data Fig. 7e-g).
Figure 5. Hierarchical clustering of barcode frequencies in mice induced at embryonic or adult stages.

a, b, Barcode frequencies in erythrocyte progenitors (EryP) versus granulocytes (a), and in EryP versus B lymphocytes (B2) (b) (further population comparisons in Extended Data Fig. 7a-c); data from Exp. 1; each dot represents an individual barcode with n=33 (a) and n=60 (b). c, Spearman rank correlation coefficients ρ, for the comparisons shown in a, b and Extended Data Fig. 7a-c; error bars indicate 95% confidence bounds computed by non-parametric bootstrap (n=33-60 barcodes). d, Hierarchical clustering of rank correlations for the indicated populations analyzed in Exp. 1 (n=60 barcodes, rare and reliably sampled). e, Hierarchical clustering of rank correlations reveals distinct T/B2 and B1 branches (Exp. 1). f, g, Barcode frequency correlations comparing CMP versus EryP (f), and CMP versus granulocytes (g), n=41 barcodes. h, Summary of Spearman rank correlations (mean and 95% confidence bounds) of CMP versus the indicated lineages; data are from Exp. 2, n=34-44 barcodes (for GMP, see Extended Data Fig. 7h). i-k, Barcode induction in adult mice (see Extended Data Fig. 8a). i, Hierarchical clustering of rank correlations of barcodes from the indicated populations (Exp. 5, n=355 barcodes). j, Summary of barcode frequency rank correlations comparing CMP + GMP versus the indicated populations (Exp. 3, n=29-106 barcodes). k, Heatmap of rank correlations comparing barcodes in the indicated lineage-restricted progenitors and mature cells (Exp. 3, n=164 barcodes). All analyses done with rare barcodes (Pgen < 10–4).
The original definition of CMP (common myeloid progenitors) as myelo-erythroid restricted has largely rested on transplantation and colony assays, yet, it is unclear whether CMP function in this capacity physiologically15–18. Remarkably, all CMP barcodes were found in both EryP and granulocytes, with highly correlated frequencies (Fig. 5f, g), implying that CMP clones are in vivo precursors of both lineages. However, about 1/3 of barcodes in EryP and granulocytes were undetected in CMP (Fig. 5f, g), raising the possibility of myelo-erythroid differentiation independent of CMP. CMP barcodes were poorly correlated with lymphoid lineages (Fig. 5h), placing CMP downstream from the split towards lymphocytes. Further barcode comparison places the granulocyte-monocyte progenitors (GMP) also within the myelo-erythroid branch (Extended Data Fig. 7h).
Finally, we studied output from adult HSC by treating three Rosa26PolyloxTie2MCM mice with tamoxifen at around 8 weeks of age, followed by barcode analysis at 11 to 13 months of age (Extended Data Fig. 8a). Here, we also included short-term HSC (ST-HSC), multipotent progenitors (MPP), common lymphoid progenitors (CLP), T and B cell progenitors, and monocytes (Extended Data Fig. 5). Unlike in fluorescent reporter Rosa26YFPTie2MCM mice14, barcode induction was not exclusively restricted to HSC but occurred to a lesser extent also in ST-HSC, MPP and CMP (Extended Data Fig. 8b), probably owing to higher sensitivity of Polylox to Cre recombination versus deletion of the stopper in the Rosa26YFP locus. The distribution of rare barcodes (Pgen < 10−4) again indicated multilineage, oligolineage and unilineage fates (Extended Data Fig. 8c). However, sizable fractions of barcodes in HSC and progenitors were not found in mature lineages (Extended Data Fig. 8c, d). Sampling repeats showed lower overlap in adult mice (Extended Data Fig. 8e), indicating overall smaller clone sizes. While this is compatible with rare output of adult HSC compared to embryonic HSC14, the quantitative output of adult HSC is controversial 19–21. Nevertheless, the retrieved barcodes revealed relatedness of granulocyte, monocyte and erythroid lineages on the one hand, and T and B lymphocytes on the other hand (Extended Data Fig. 8f); 3-4 times deeper sampling of four populations (granulocytes, EryP, B2 cells and CD4 T cells) yielded an even clearer split (Fig. 5i). Likewise, CMP and GMP were more closely related to erythrocytes and myeloid lineages than to lymphocytes (Fig. 5j). The paucity of barcodes in CLP (Extended Data Fig. 8c) precluded robust correlation analysis; however T and B cell progenitors clustered in their respective lineages, apart from erythroid and myeloid lineages (Fig. 5k).
We have induced Polylox recombination in diverse tissues of ectodermal (brain), mesodermal (muscle, spleen, thymus) and endodermal (liver, lung) origins (Extended Data Fig. 9). Thus, non-invasive Polylox barcoding may aid studies into cellular deconvolution of complex organs and whole organisms at a high resolution. Recently, a Cre-based recombination cassette, similar but not identical to Polylox, was conceived for high resolution cellular barcoding but has not been tested experimentally22. Polylox is based on the idea that Cre operates incompletely when confronted with many loxP sites in cis under conditions of limited enzyme activity. The barcode diversity offered by Polylox is superior to the diversity of existing fluorescent color-based endogenous fate mapping tools 23, and, for practical purposes, similar to that of transposon insertion site (TIS) barcoding4; compared to TIS, Polylox has the advantage of a defined genomic location of the barcode (Supplementary Table 3). Our high-resolution fate mapping experiments of embryonic HSC progenitors and adult HSC both support a bifurcating tree model of hematopoiesis, which was proposed in the 1980s24, but has not been tested under physiological conditions. The quantitative output of adult HSC data imply a hematopoietic architecture with major myelo-erythroid and common lymphoid pathways, while not ruling out additional routes25. Further refinement of precursor-product relationships will require inducible Cre-driven barcoding in progenitor stages downstream of HSC.
Methods
Mice
Rosa26Polylox knock-in mice (B6-Gt(ROSA)26Sortm1(Polylox)Hrr) were generated by gene targeting as described below. For in vivo barcoding experiments, we bred Rosa26Polylox/Polylox and Tie2MCM/+ (Tektm1.1(icre/Esr1*)Hrr)14 mice to generate double heterozygous Rosa26Polylox/+Tie2MCM/+ mice (termed Rosa26PolyloxTie2MCM), and we bred Rosa26Polylox and Rosa26CreERT2 (B6.129-Gt(ROSA)26Sortm1(cre/ESR1)Tyj/J) mice26 to generate hemizygous Rosa26Polylox/CreERT2 mice. Mice were kept in IVC cages under SPF conditions in the animal facility at the German Cancer Research Center (DKFZ, Heidelberg). Male and female mice were used, no randomization was done, no blinding was done and no animals were excluded from the analysis. No statistical methods were used to predetermine sample size. For mouse sample sizes, see Extended Data Table 1. All animal experiments were performed in accordance with institutional and governmental regulations, and were approved by the Regierungspräsidium (Karlsruhe, Germany).
Polylox recombination cassette
A step-by-step protocol describing the use of Polylox barcoding can be found at Protocol Exchange27.We generated a recombination cassette (DNA sequence shown in Supplementary Data), consisting of 5’ and 3’ anchor regions with PCR primer binding sites, flanking nine unique DNA segments, intersected by ten loxP sites with identical recognition sequences but in alternating orientations. The nine segments were chosen from a natural DNA from a plant gene, the cell wall synthase AT2G21770 gene of Arabidopsis thaliana. To maximize physiological nucleotide distribution, T/A repeats, splice sites and certain restriction sites were removed from the AT2G21770 sequence. The loxP sites were inserted at fixed distances of 178 bp apart. This distance was calculated according to the optimal closest distance of 94 bp11, plus an extension of eight DNA windings of ~10.5 bp each. The Polylox DNA cassette was synthetized by Eurofins Genomics, Germany, and cloned into the Rosa26 gene targeting vector pWP-AG.
Generation of Rosa26Polylox/+ knock-in mice
We inserted the Polylox cassette by conventional gene targeting via homologous recombination into the Rosa26 locus in murine ES cells (JM8A328 from C57BL/6N, and E14.129 from 129/Ola). ES cell authentication was achieved via ES cell-derived coat color of chimeric mice and by germ line transmission capability. Cell stocks were tested negative for mycoplasma. The targeting strategy is shown in Extended Data Fig. 1a. The targeting vector (pWP-AG) consists of a homologous ‘short’ arm (~1.1 kb), a neomycin resistance gene (preceded by an adenovirus splice acceptor site and followed by polyadenylation sites from the bovine growth hormone gene30), the synthetic Polylox cassette, a homologous ‘long’ arm (~4.3 kb), and the diphtheria toxin subunit A along with a PGK1 promoter (DT-A) for screening against random insertion. Parts of the vector were kindly provided by H. J. Fehling31. Targeted clones were screened by PCR using an external forward primer HL16 (5’-CCTAAAGAAGAGGCTGTGCTTTGG-3’) located 5’ of the expected integration site, and a vector specific reverse primer HL15 (5’-AAGACCGCGAAGAGTTTGTCC-3’)31. PCR-positive clones were further analyzed by Southern blot using a biotinylated 820 bp probe located upstream of the first exon and the short arm of homology. The probe was obtained by PCR amplification from genomic C57BL/6 DNA using the primers #2424: 5'-GCAAAGGCGCCCGATAGAATAA-3' and #2425: 5'-CCGGGGGAAAGAAGGGTCAC-3'31. Probe labeling, hybridization and detection were done with the North2South Biotin Random Prime Labeling Kit, and the North2South Chemiluminescent Hybridization and Detection Kit (Thermo Scientific). Rosa26Polylox/+ knock-in ES cells (targeted JM8A3 clone) were injected into C57BL/6 blastocysts at E3.5 days post conception (dpc), and chimeric males were backcrossed to C57BL/6N females to transmit the Rosa26Polylox knock-in allele through the germline. For genotyping of the offspring, the same PCR primers were used as described for the targeted ES cell clone screen. Heterozygous Rosa26Polylox/+ and homozygous Rosa26Polylox/Polylox mice are viable, fertile, and do not show any obvious phenotype.
Cell-free Polylox recombination assay
The vector pWP-AG (1 μg) was digested with SacII and AscI (NEB), and the mixture was incubated with four units of Cre recombinase (NEB) overnight at 37 °C. The reaction was terminated by heating at 70 °C for 10 min. Products were analyzed by gel electrophoresis. After Cre recombination, band sizes released from the SacII-AscI fragment were 5176bp, 4752bp, 4328bp, 3904bp, and 3480bp in length (Fig. 1b).
Cellular in-vitro assay of Polylox recombination
The pAN-MerCreMer-puro expression plasmid carrying the tamoxifen-inducible MerCreMer32 (kindly provided by M. Reth) under the control of human ACTB promoter was transfected into Rosa26Polylox knock-in ES cells (targeted E14.1 clone) to enable the induction of intracellular recombination. Transfected ES cells were selected with puromycin and screened for stable integration by PCR using primer #2456 (5'-CCATGGGAGATCCACGAAATG-3') and primer #2457 (5'-CCTGGTATCTTTATAGTCCTG-3'). For the induction of cellular recombination, a MerCreMer-transfected Polylox ES cell clone was incubated with 100 nM 4-hydroxy-tamoxifen (800 μM 4-OHT stock in EtOH) for the indicated times shown in Extended Data Fig. 1b. For the pulse-chase study of 4-OHT induction, MerCreMer-transfected Polylox ES cells were treated with 100 nM 4-OHT for three hours, then washed, and cultured in 4-OHT free medium for up to 34 days (Extended Data Fig. 1c). Cell aliquots were harvested at the indicated time points, and genomic DNA was purified by phenol-chloroform extraction and isopropanol precipitation. The Polylox cassette was amplified by PCR using 1 μg template and the Expand Long Template PCR System (Roche) for 5 min at 95 °C; (30 s at 95 °C, 30 s at 62 °C, 5 min at 72 °C) 35 times; 10 min at 72 °C with primers #493 (5'-GCAAGCACGTTTCCGACTTGAG-3') and #2427 (5'-CATACCTTAGAGAAAGCCTGTCGAG-3') annealing 5’ and 3’ of the Polylox cassette, respectively.
Induction of Polylox recombination in vivo
For induction of barcodes in adult mice, Rosa26Polylox/CreERT2 mice were injected intraperitoneally once, and Rosa26PolyloxTie2MCM mice once per day on five consecutive days with 1 mg tamoxifen or peanut oil for vehicle control. Tamoxifen stock solution was prepared by dissolving 1 g tamoxifen (Sigma) in 4 ml absolute ethanol and 36 ml peanut oil (Sigma) at 55 °C. For in utero labeling, timed matings were set up between Rosa26Polylox/Polylox and Tie2MCM/+ mice. Nine days after the day of the plug (day 0.5), pregnant mice were treated by oral gavage with a single dose of 2.5 mg tamoxifen to induce barcoding in the developing embryos at E9.5, together with 1.25 mg progesterone (Sigma) to sustain pregnancy. The pups were delivered on E20.5 by caesarean section, raised by foster mothers and genotyped for the Tie2MCM allele as described14.
Fluorescence-activated cell sorting (FACS)
Bone marrow (BM) cells were released from the bones by crashing femura, tibiae, pelvis and spine in FACS buffer, and cells were harvested from the flow-through of a 40-μm filter (BD Falcon). Spleens (Sp) were dissociated directly by passing the cells through a 40-μm filter. Peritoneal exudate cells were obtained by lavage of the peritoneal cavity with FACS buffer (PBS supplemented with 5% fetal bovine serum). Cell suspensions were incubated for 15 min with 300 μg/ml whole mouse IgG (Jackson ImmunoResearch Laboratories) for blocking Fc receptors, and stained for 45 min with titrated concentrations of fluorescent dye-labeled antibodies in FACS buffer on ice. Dead cells were stained with Sytox Blue (Invitrogen). Antibodies used were: CD3ε-FITC (17A2), CD4-FITC (H129.19), CD8a-FITC, CD8a-BV421 and CD8a-PE (53-6.7), CD11b-FITC (M1/70), CD19-FITC and CD19-APC (1D3), CD25-PE-Cy7 (PC61), CD43-APC (S7), CD93-BV421 (AA4.1), CD117-APC (2B8), Gr1-FITC (RB6-8C5), Ly6C-APC-Cy7 (AL-21), Ly6G-PerCP-Cy5.5 (1A8), NK1.1-FITC (PK136), Ter119-PE (Ter119) and Streptavidin-APC-Cy7 from BD Pharmingen, CD3ε-APC-eFluor 780 (17A2), CD4-PerCP-Cy5.5 (RM4-5), CD5-APC (53-7.3), CD11b-PE and CD11b-PE-Cy7 (M1/70), CD16/32-PE-Cy7 (93), CD19-PerCP-Cy5.5 (1D3), CD21-biotin (8D9), CD23-PE-Cy7 (B3B4), CD24-APC-eFluor 780 (M1/69), CD34-eFluor660 (RAM34), CD45-AlexaFluor700 (30-F11), B220-PerCP-Cy5.5 (RA3-6B2), CD48-FITC and CD48-PE (HM48-1), CD117-APC-eFluor780 (2B8), CD127-PE-Cy7 (A7R34), CD135-APC (A2F10), IgM-FITC (121-15F9), MHCII-APC (M5/114.15.2) Sca1-PerCP-Cy5.5 (D7), Ter119-FITC (Ter119) from eBiosciences, CD4-Qdot605 (RM4.5) from Life Technologies, CD4-BV421 (GK1.5), CD8a-BV421 (53-6.7), CD11b-BV421 (M1/70), CD11c-BV785 (N418), CD19-BV421 (6D5), CD44-BV605 (IM7), CD71-PE-Cy7 (RI7217), CD115-BV605 (AFS98), CD117-BV711 (2B8), CD150-PE and CD150-BV605 (TC15-12F12.2), Gr1-BV421 (RB6-8C5), NK1.1-BV421 (PK136) and Ter119-BV421 (Ter119) from BioLegend. HSCs and progenitors were enriched by lineage depletion prior to fluorescent staining and sort. Therefore, bone marrow cells were incubated with a cocktail of the lineage markers including CD3ε, CD4, CD8, CD11b, CD19, Gr-1, Ter119, NK1.1 (pro/pre B cell enrichment was done with a depletion cocktail not including CD19) and then separated with Dynabeads (Life Technologies) according to the manufacturer’s protocol. Cell populations were defined as follows: HSC (Lin−Sca+Kit+CD48−CD150+), ST-HSC (Lin−Sca+Kit+CD48−CD150−), MPP (Lin−Sca+Kit+CD48+CD150−), CMP (Lin−Sca−Kit+CD16/32loCD34lo), GMP (Lin−Sca−Kit+CD16/32+CD34+), CLP (Lin−KitloCD127+CD135+B220lo), pre B cells (pooled fractions B and C: Lin−CD43+B220+CD24+BP1− and BP1+), granulocytes (Gr) BM and Gr Sp (CD4−CD8−CD19−CD11b+Gr-1+), monocytes (CD4−CD8−CD19−Ter119−CD45+Ly6G−CD11b+CD115+MHCII−), CD4+ T cells (CD4+CD8−CD19−CD11b−Gr-1−), CD8+ T cells (CD4−CD8+CD19−CD11b−Gr-1−), B cells (CD4−CD8−CD19+CD11b−Gr-1−), B1a PEC (CD5+CD11b+CD19+CD21−CD23−CD93−IgM+), B1b PEC (CD5−CD11b+CD19+CD21−CD23−CD93−IgM+), and B2 PEC (CD5−CD11b−CD19+CD21−CD23+CD93−IgM+). Thymic pre T cells were sorted as lineage (CD11b, CD19, NK1.1, Gr1, Ter119, CD3, CD4, CD8)-negative CD44+CD25+ DN2 and CD44− CD25+ DN3 fractions. Nucleated erythroid progenitor (EryP) stages were defined as EryPI (proerythroblasts: Lin−Ter119lowCD71+CD44hiFSChi), EryPII (basophilic erythroblasts: Lin−Ter119+CD71+CD44+FSC+), EryPIII (polychromatic erythroblasts: Lin−Ter119+CD71+CD44medFSCmed, and EryPIV (orthochromatic erythroblasts: Lin−Ter119+CD71+CD44lowFSClow)33. For erythroblast isolations, lineage markers included CD3ε, CD11b, CD19, Gr1, and NK1.1. All cell populations were purified on a FACSAriaIII cell sorter (BD Biosciences) using BD FACSDiva software.
Barcode analysis by single molecule real-time (SMRT) sequencing
Genomic DNA from sorted cell populations was purified by phenol-chloroform extraction or proteinase K digestion only. The Polylox cassette was amplified from 100-200 ng template DNA (representing 1.7 - 3.5 x10⁴ cells) by PCR using primer #2450 (5'- TGTGGTATGGCTGATTATGATCAG-3') and primer #2427 (5'-CATACCTTAGAGAAAGCCTGTCGAG-3'), annealing at the 5’ and 3’ anchor regions of the Polylox cassette, respectively, using the following protocol: 5 min at 95 °C; (30 s at 95 °C, 30 s at 56 °C, 5 min at 72 °C) 35 times; 10 min at 72 °C. PCR products (2152, 1728, 1304, 880 and 456 bp in lengths) were purified and size-selected using the AMPure PB beads according to the manufacturer’s protocol, and libraries were prepared for single molecule real time (SMRT) sequencing using the SMRTbell Template Prep Kit (Pacific Biosciences). All samples were sequenced in separate SMRT cells using standard protocols on PacBio RSII, or Sequel instruments (Pacific Biosciences). Circular consensus sequence (CCS) reads for each sample were generated with the SMRT Analysis Software (Pacific Biosciences).
Polylox barcode recognition
DNA sequences in the recombined Polylox cassette were determined by SMRT sequencing. Starting from circular consensus sequencing (CCS) reads, we first determined the orientation of the Polylox cassette using the 5’- and 3’-ends of the barcode stretches by aligning the two anchor end sequences to the CCS reads (see “Sequence alignment” below). Only CCS reads containing both the 5’ and the 3’ anchor sequences were used for further processing. Anchor end sequences were then trimmed from the CCS reads, while the directionality of the whole sequence stretches was maintained. Next, barcode recognition was done by aligning each of the nine forward (‘1’-‘9’) and the nine reverse-complement (‘A’-‘I’) barcode segments to the trimmed CCS reads (see “Sequence alignment” below); if a segment, or its reverse-complement could be aligned to the trimmed read, its coordinate on the read with the orientation was recorded. By sorting positions for all aligned fragments on each read, the corresponding barcode was positively identified.
Sequence alignment
Mapping was done using bowtie2 (version 2.1.0), with parameters adjusted to recognize large DNA blocks of very different Hamming distances (Supplementary Table 2) based on PacBio reads (Supplementary Methods).
Single-cell HSC barcode analysis
For the isolation of single HSC, BM cells were stained as described above. During FACS sorting, individual cells were deposited into 8-tube PCR stripes containing in each well 25 μl lysis buffer (12.6 μg proteinase K (Thermo Fisher Scientific) in PCR buffer 1 (Roche)). Lysis was done for 1 h at 55 °C, terminated at 95 °C for 10 min, and cooled to 4 °C before adding the remaining PCR reagents to a final volume of 50 μl. The Polylox cassette was then amplified by nested PCR. First round PCR: primer #2450 (see above) and primer #494 (5′-AGCTACAGCCTCGATTTGTGGTG-3′) for 5 min at 95 °C; (30 s at 95 °C, 30 s at 56 °C, 5 min at 72 °C) 35 times; 10 min at 72 °C. Second round PCR: 1-2 μl of first PCR reaction was used as template and amplified with primers #2426 5′-CGACGACACTGCCAAAGATTTC-3′ and #2427 (see above) for 5 min at 95 °C; (30 s at 95 °C, 30 s at 62 °C, 5 min at 72 °C) 35 times; 10 min at 72 °C. The nested PCR products were purified by QIAquick PCR Purification Kit (Qiagen), analyzed by gel electrophoresis for product length, and analyzed by Sanger sequencing (GATC Biotech). Barcodes were decoded for each of these sequences.
Computational analysis of barcode diversity
We iteratively created a library of all barcodes and the adjacency matrix linking the barcodes by all possible excisions and inversions. On this basis, we computed barcode generation probabilities (Pgen) using a Markov chain model and factoring in the numbers of Cre recombination events inferred from the experimentally observed barcodes (Supplementary Methods).
Computer code and the datasets generated during and/or analysed during the current study are available from the corresponding author on reasonable request.
Extended Data
Extended Data Fig. 1. Generation of the Rosa26Polylox locus and experimental procedures for barcode detection and analysis.
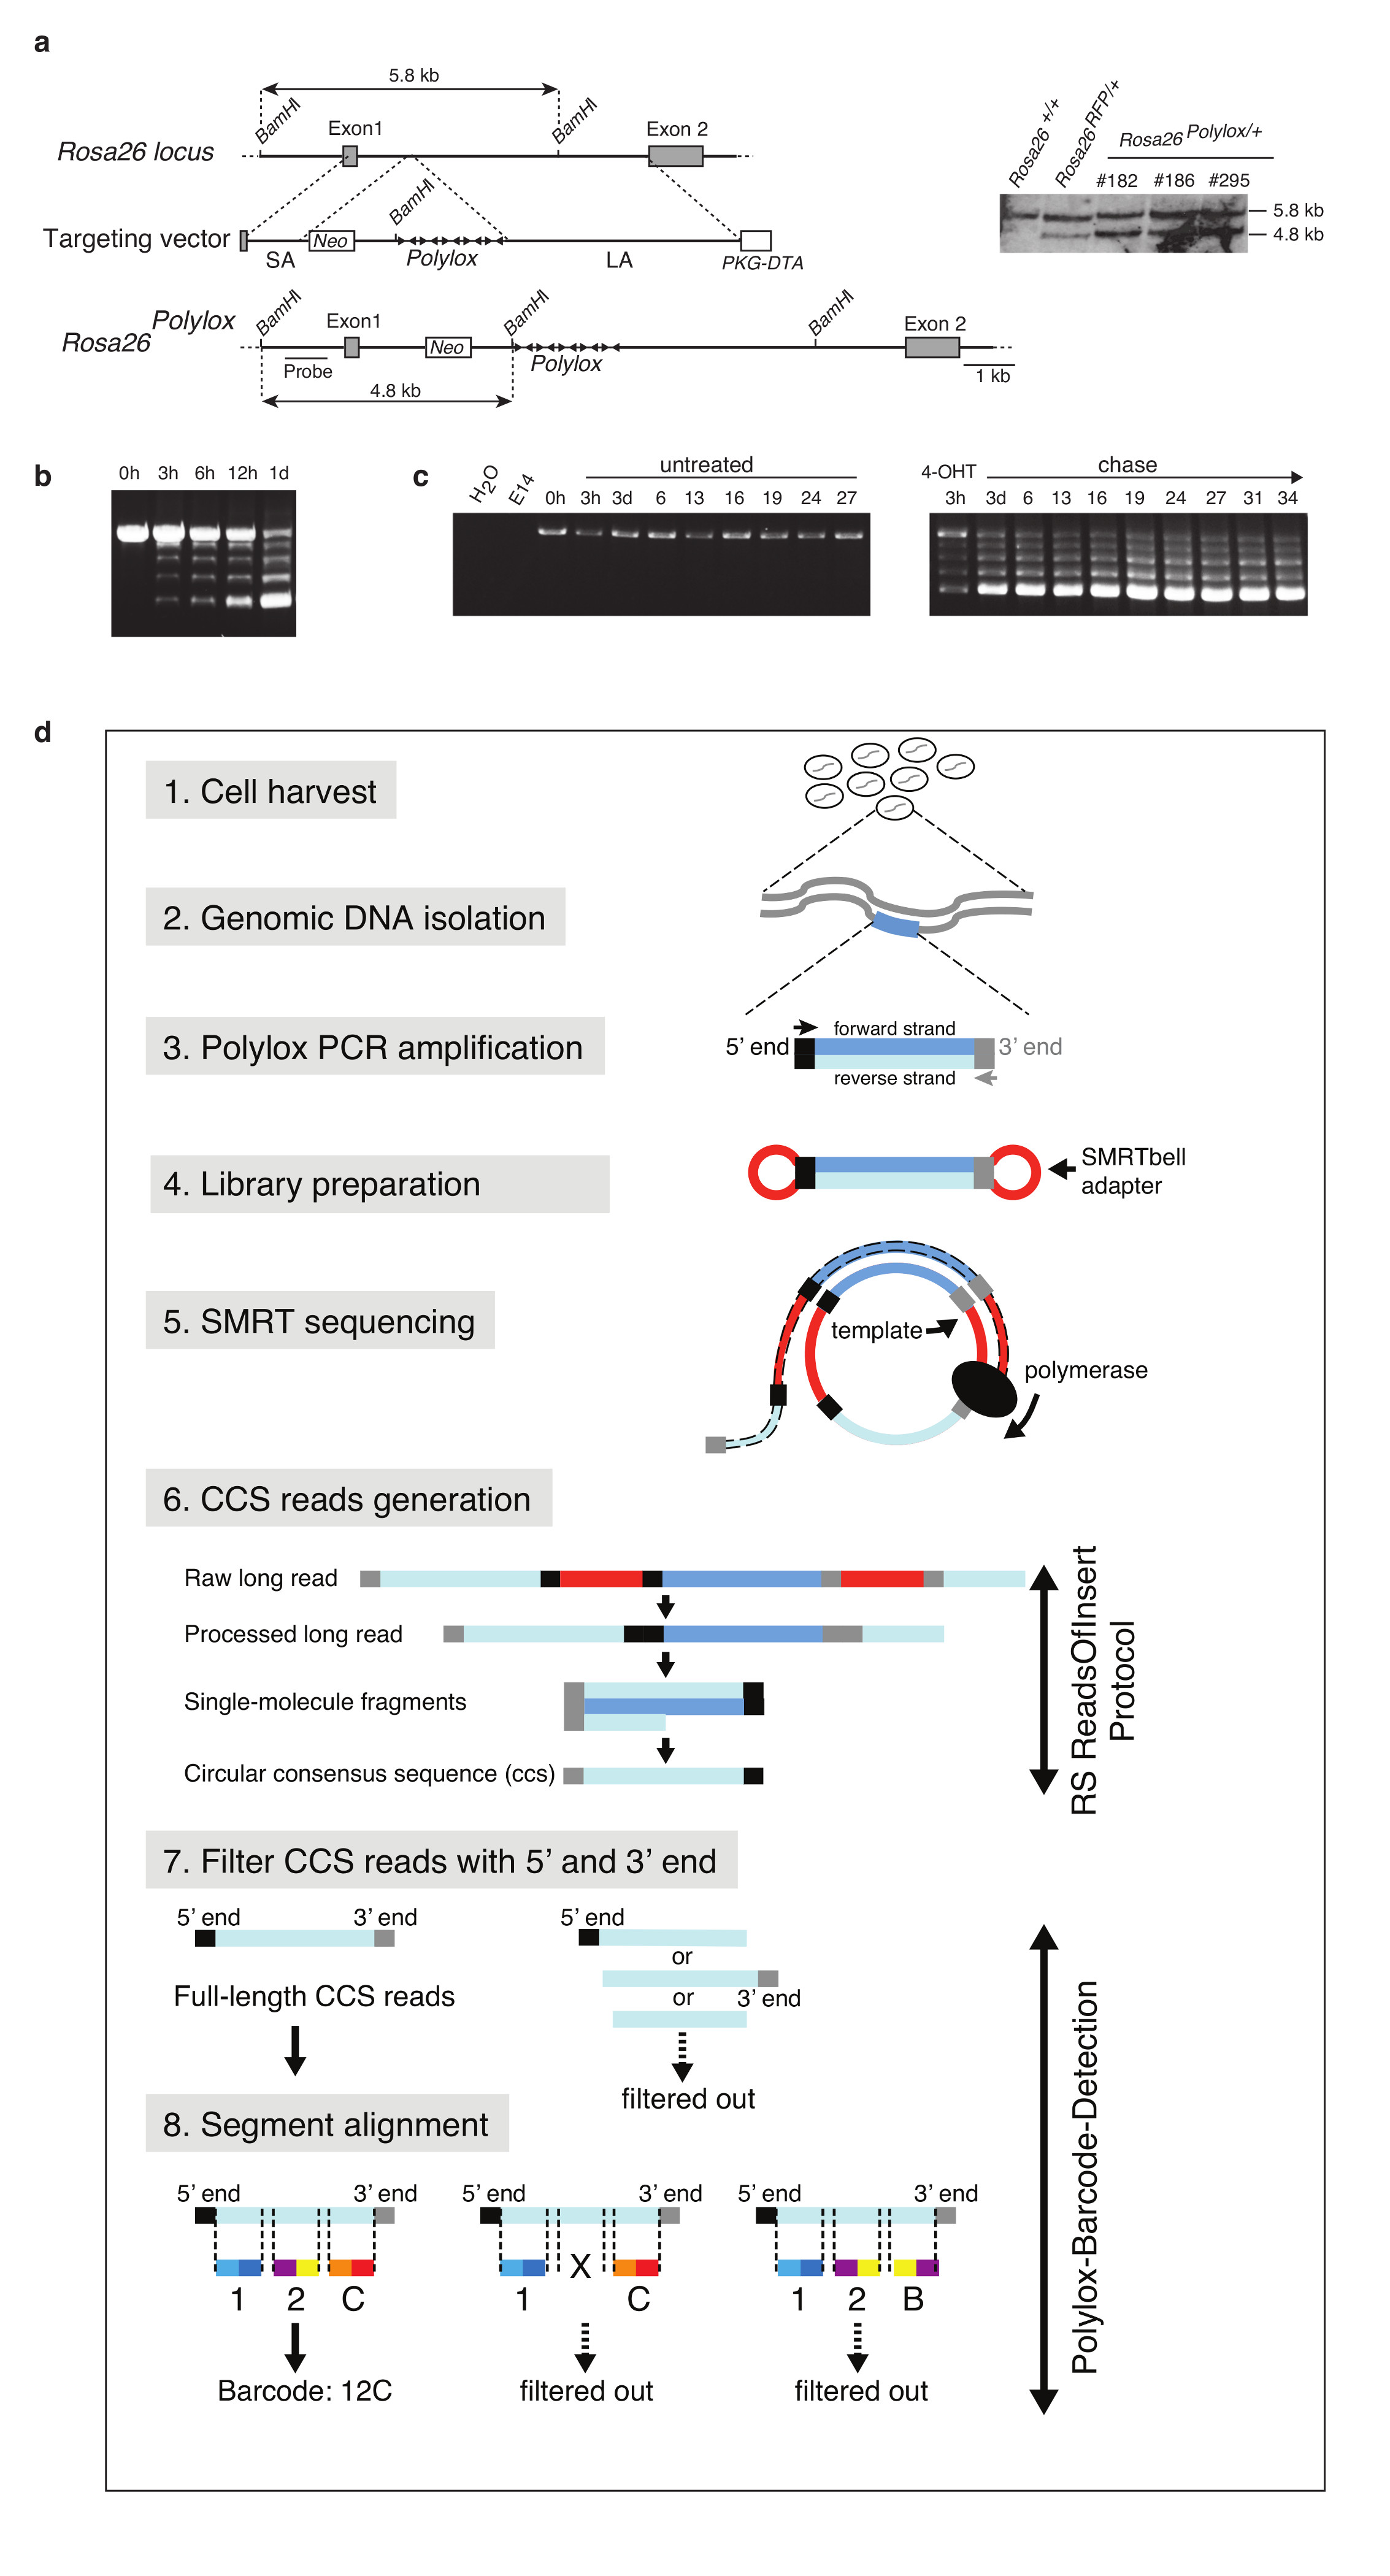
a, Gene targeting of Polylox DNA into the Rosa26 locus in ES cells; shown are the wild type Rosa26 locus (top), targeting vector (middle) and targeted Rosa26Polylox locus (bottom). Southern blot (insert) (Supplementary Fig. 1b) from genomic tail DNA of control Rosa26+/+ and Rosa26RFP/+ (ref. 31) mice, and from three Rosa26Polylox/+ ES cell clones shows restriction fragments corresponding to wild-type (5.8 kb) or targeted (4.8 kb) loci. b, Kinetics of Polylox locus recombination after treatment of Rosa26Polylox MerCreMer ES cells with 4-OH tamoxifen (4-OHT) at 0 h (Supplementary Fig. 1c). c, Rosa26Polylox MerCreMer ES cells were left untreated and followed for 27 days (left panel), or pulsed with 4-OHT for 3 hours and chased over 34 days (right panel) (Supplementary Fig. 1d). d, Workflow from cell isolation to Polylox barcode detection. Cell populations of interest were isolated by cell sorting, genomic DNA was purified and the Polylox cassette was amplified by PCR, and the fragments (see Methods) were sequenced by single molecule real time (SMRT) sequencing using Pacific Biosciences instruments. Raw data was processed with the accompanying software package to obtain the circular consensus sequences (CCS). Subsequently, CCS were filtered for reads containing complete Polylox sequences. Next, we aligned the barcode segments to the CCS reads and determined the order and orientation of the segments to retrieve the recombined Polylox barcodes (see Methods). Finally, CCS with incomplete segment alignment (X), or illegitimate segment orders (e.g. segment duplications) were filtered out and removed from the further analysis.
Extended Data Figure 2. Example of a complex CCS DNA sequence and its corresponding Polylox barcode.

a, Schematic drawing of the unrecombined Polylox cassette, and an experimentally found recombined barcode. b, Full nucleotide sequence of one CCS read. In 5’ to 3’ orientation, the DNA sequence is organized into intervening loxP sites and the annotated barcode blocks (‘barcode alphabet’). Numbers and letters refer to the segments shown in a. c, Proportions of unrecombined (blue) and recombined (red) sequence reads in granulocytes (Gr), B cells (B2), CD4 T cells (CD4), and CD8 T cells (CD8) from adult Rosa26PolyloxTie2MCM mice without tamoxifen (TAM) treatment (top row), adult Rosa26Polylox (middle row) and adult Rosa26PolyloxTie2MCM (bottom row) mice, each treated as embryos with tamoxifen.
Extended Data Figure 3. Barcode generation probabilities and number of Polylox recombination events in acutely labeled B cells.

a, Barcode generation probabilities were computed for a set of barcodes found experimentally (mouse #3, Extended Data Table 1, n=506 barcodes) with and without length dependence of recombination rate, as described in Supplementary Methods. b, To compare the frequencies of individual barcode segments (‘letters’) generated by the model with experimental data, we focused on data from a Rosa26Polylox/CreERT2 mouse treated with tamoxifen (see Figure 3a, mouse #1), from which about 15,000 acutely barcoded B cells were analyzed. To simulate barcode generation in 15,000 cells, 15,000 barcodes were drawn (with the frequencies of recombination events shown in e below). This procedure was repeated 500 times to obtain standard deviations. c, Measured and computed distributions of fragment lengths are shown (experimental data and simulations as in b). d, The observed and measured distributions of the 180 possible pairs of adjacent segments are shown (experimental data and simulations as in b); the unrecombined pairs are particularly abundant. The PacBio instrument loads longer fragments less efficiently than shorter ones. Because of this bias, we restricted the analysis in b-d to fragments with 1, 3 and 5 segments. e, For all barcodes found in B cells from the mouse in b we computed the minimal number of recombination events (excisions or/and inversions) needed to generate the barcode. All barcodes can be generated with six or fewer recombination events. The cumulative distribution of event frequencies is shown. Similar distributions were obtained in the reported barcoding experiments with Rosa26PolyloxTie2MCM mice. f, Barcodes generated once or multiple times in a simulated sample of 15,000 cells (as described in b). On average, 2,920 ± 35 (mean ± s.d.) different barcodes were generated with 15,000 draws. g, Measured barcode frequencies versus computed generation probabilities. For all barcodes retrieved in adult mice after barcode induction in embryonic HSC progenitors (Fig. 4, Exp. 1 and 2), we binned total barcode frequencies according to generation probabilities and calculated boxplot statistics of observed barcode frequencies for each bin (red line, median; box ends, 25% and 75% percentiles; bars, most extreme data points not considered outliers; red dots, outliers, n = 4, 95, 175, 97, 73, 28, 11 barcodes (left) and n = 4, 102, 180, 75, 42, 31, 14 barcodes (right)). From generation probabilities of 0.1 to 10–4, observed median frequency and probability of generation were overall correlated, showing that barcodes generated with higher probability are recovered more frequently. By contrast, for barcodes with generation probabilities ≤ 10–4, their median frequency of observation was independent of the probability of generation, indicating that these barcodes have each been generated in the smallest possible unit, a single embryonic HSC progenitor.
Extended Data Figure 4. Histogram of apparent HSC clone sizes.

For the single HSC sequencing data (Fig. 4, Exp. 1 and 2) we show separately the histogram of apparent clone sizes. An apparent clone is defined by all HSC that contain the same barcode. These apparent clones are unlikely to all be biological clones, due to the inclusion of abundant barcodes that may have been generated in more than one embryonic HSC progenitor. For the analysis of rare barcodes that are highly likely to define true clones generated from single HSC progenitors see Figure 4b and e.
Extended Data Figure 5. Overview of FACS gating strategies.
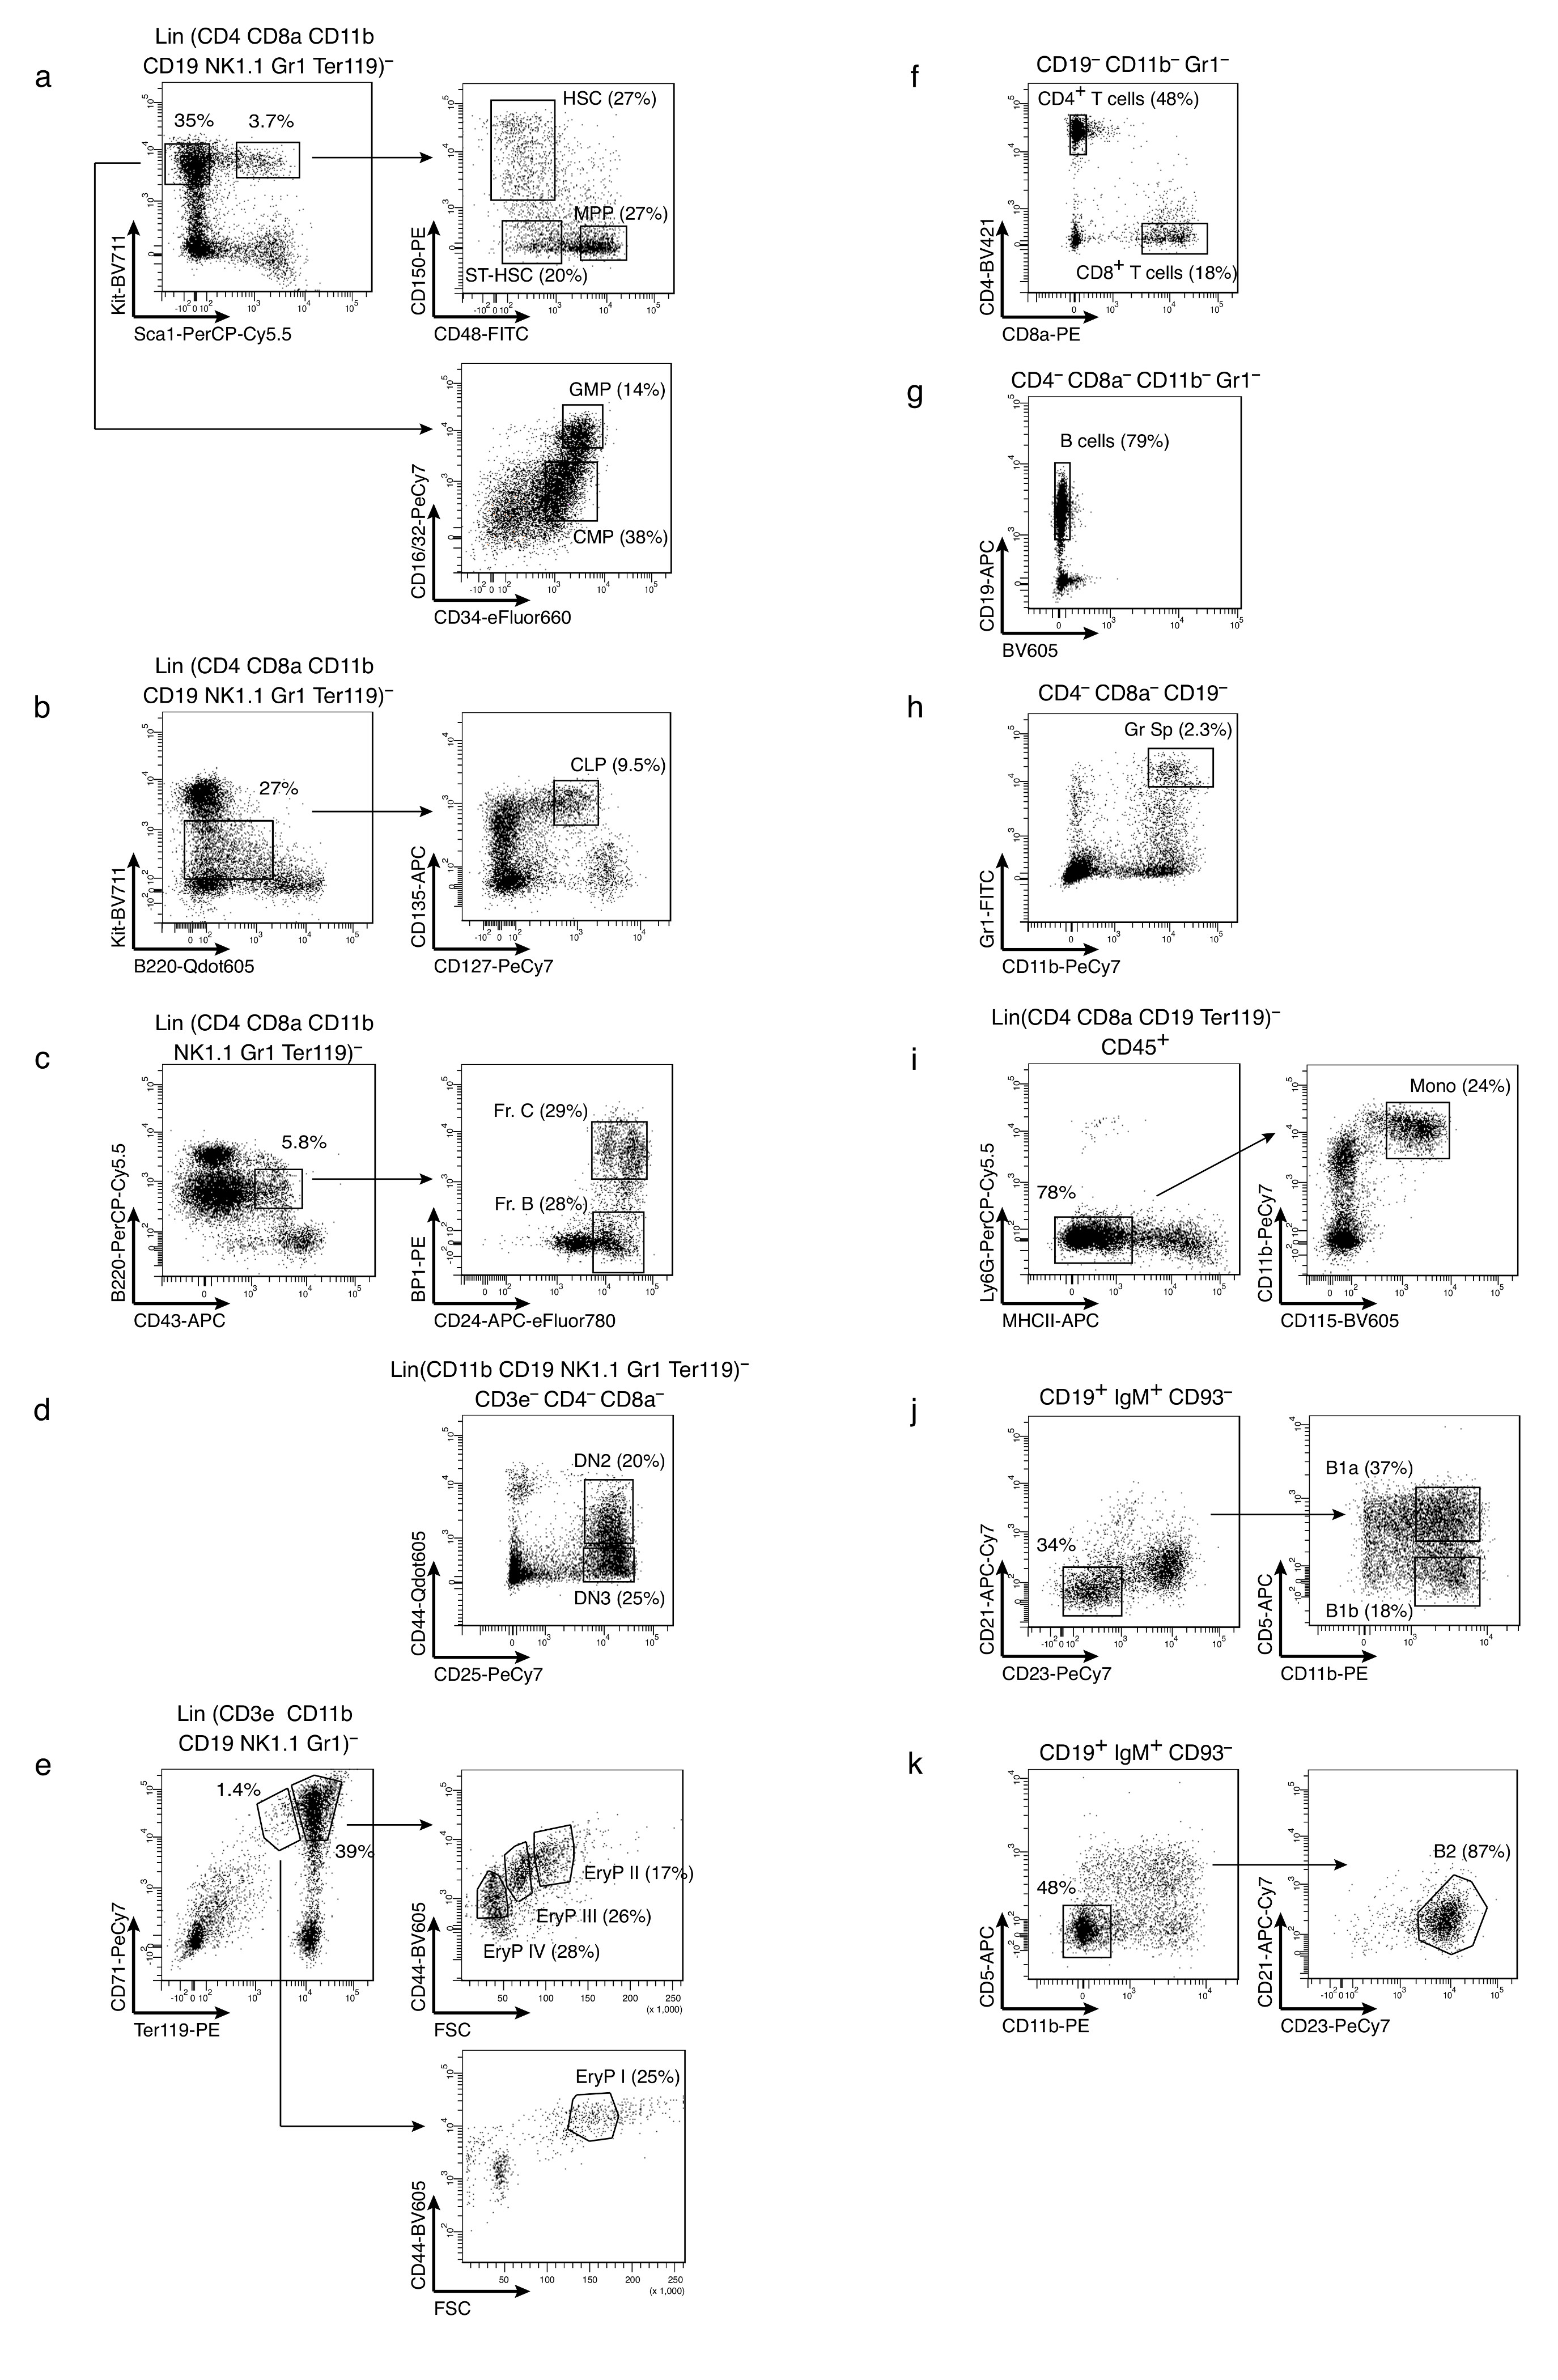
a-k, Distinctive surface marker combinations applied for the isolation of specific cell populations are depicted. Pre-gated lineage markers are indicated above the first plot of each panel. Not shown is the additional gating of all populations for size (FSC, SSC) and viability (Sytox blue–). For the complete listing of antibodies and marker phenotypes, see also methods section. a, Isolation of Kit+Sca1+ stem cells (HSC and ST-HSC) and multipotent progenitors (MPP), upper right, and Kit+Sca1– myeloid progenitors (CMP and GMP), lower right, from bone marrow. b, Characterization of bone marrow CLP. c, Definition of pre-B cells (Fr. B and Fr. C) in bone marrow. d, Thymic pre T cells (DN2 and DN3). e, Gating of nucleated erythrocyte progenitors in the bone marrow (EryP II-IV, upper right, and EryP I, lower right). f, CD4 or CD8 single-positive T cells from spleen. g, Classical CD19+ splenic B cells. h, Neutrophilic granulocytes from the spleen. i, Splenic monocytes. j, Non-classical B cells (B1a and B1b) from the peritoneal cavity. k, Classical CD19+ B2 cells from peritoneal cavity.
Extended Data Figure 6. Adult barcode distributions in embryonically induced mice (Fig. 4a, Exp. 2).

a, Heatmap of all barcodes found in HSC (first lane) and the indicated erythroid, myeloid and lymphoid lineages in Exp. 2. b, Heatmap of peripheral barcodes (Pgen < 10–4, and detected in two independent samples of the same population) sorted according to lineage output in Exp. 2. Frequencies of barcodes are represented by color-coded scales on the right.
Extended Data Figure 7. Clustering of cell types according to all mutual correlations reveals robust dichotomy between common myelo-erythroid and common lymphoid development (all data from adult mice with embryonically induced barcodes) (Fig. 4a, Exp. 2).
a-c, Barcode frequencies in CD8 T cells versus B lymphocytes (B2) (a), in granulocytes (Gr) versus B lymphocytes (B2) (b) and granulocytes (Gr) versus CD4 T cells (c). Data in a-c are from Exp. 1, and each dot is an individual rare barcode with n=48 (a) and n=49 (b) and N = 53 (c). d, Hierarchical clustering (with distance 1 – Spearman rank correlation coefficient, as described in Fig. 5d) applied to rare and reliably sampled barcodes found in indicated populations in Exp. 2 (n=50). e, Hierarchical clustering as described in d but applied to all barcodes found in peripheral cells in Exp. 1 (n=506) and Exp. 2 (n=496). The inclusion of redundant barcodes reduces differences in correlations, yet the split between common myelo-erythroid and common lymphoid is evident. f, Clustering as described in d but applied to rare multilineage barcodes (found in at least one erythroid, granulocyte and lymphocyte population, analogous to Fig. 4f; Exp.1, n = 16 and Exp. 2, n = 25). g, Clustering as described in d but applied only to barcodes found in adult HSC, including redundant ones (shown in Fig. 4d; Exp.1, n=54 and Exp. 2, n=56). h, Summary of Spearman rank correlations (mean and 95% confidence bounds computed by non-parametric bootstrap) of GMP versus the indicated lineages (for CMP, see Fig. 5h); rare barcodes are from Exp. 2, n=30-44.
Extended Data Figure 8. Polylox barcoding of hematopoiesis in adult mice (all data from adult mice with barcodes induced as adults).

a, Barcodes were induced by tamoxifen treatment of adult Rosa26PolyloxTie2MCM mice, and the indicated cell populations were analyzed at 11 to 13 months of age. b, Tamoxifen treatment of adult Rosa26PolyloxTie2MCM mice (Extended Data Table 1) induced Polylox recombination in HSC and, to a lesser extent, also in downstream stem and progenitor cells, ST-HSC, MPP and CMP (Supplementary Fig. 1e) c, Heatmaps of barcodes satisfying single-cell induction criteria (at the time of labeling) recovered in the indicated stem and progenitor cells, and mature cells in Exp. 3 (left panel), and Exp. 4 (right panel). Frequencies of barcodes are represented by color code (scale on the left). d, Heatmaps for individual HSC, satisfying adult single-cell barcode induction criteria, and their lineage output in Exp. 3 (top panel) and Exp. 4 (bottom panel). Pgen for the multilineage barcodes were as follows: ‘1F92G45H3’, 1.3 x 10⁻⁹; ‘123FG45’, 2 x 10⁻⁵. e, The barcode overlap between two samples of the same cell population (granulocytes and CD4 T cells isolated from the peripheral blood; 30,000 cells per sample) was smaller than for embryonically labeled mice (cf. Fig. 4c). f, Hierarchical clustering of rank correlations of barcodes from the indicated populations (Exp. 3, n = 129). The color scale (not shown) for rank correlations is identical to the scale bar shown in Fig. 5i.
Extended Data Figure 9. Induction of Polylox recombination in tissues of all three germ layers.
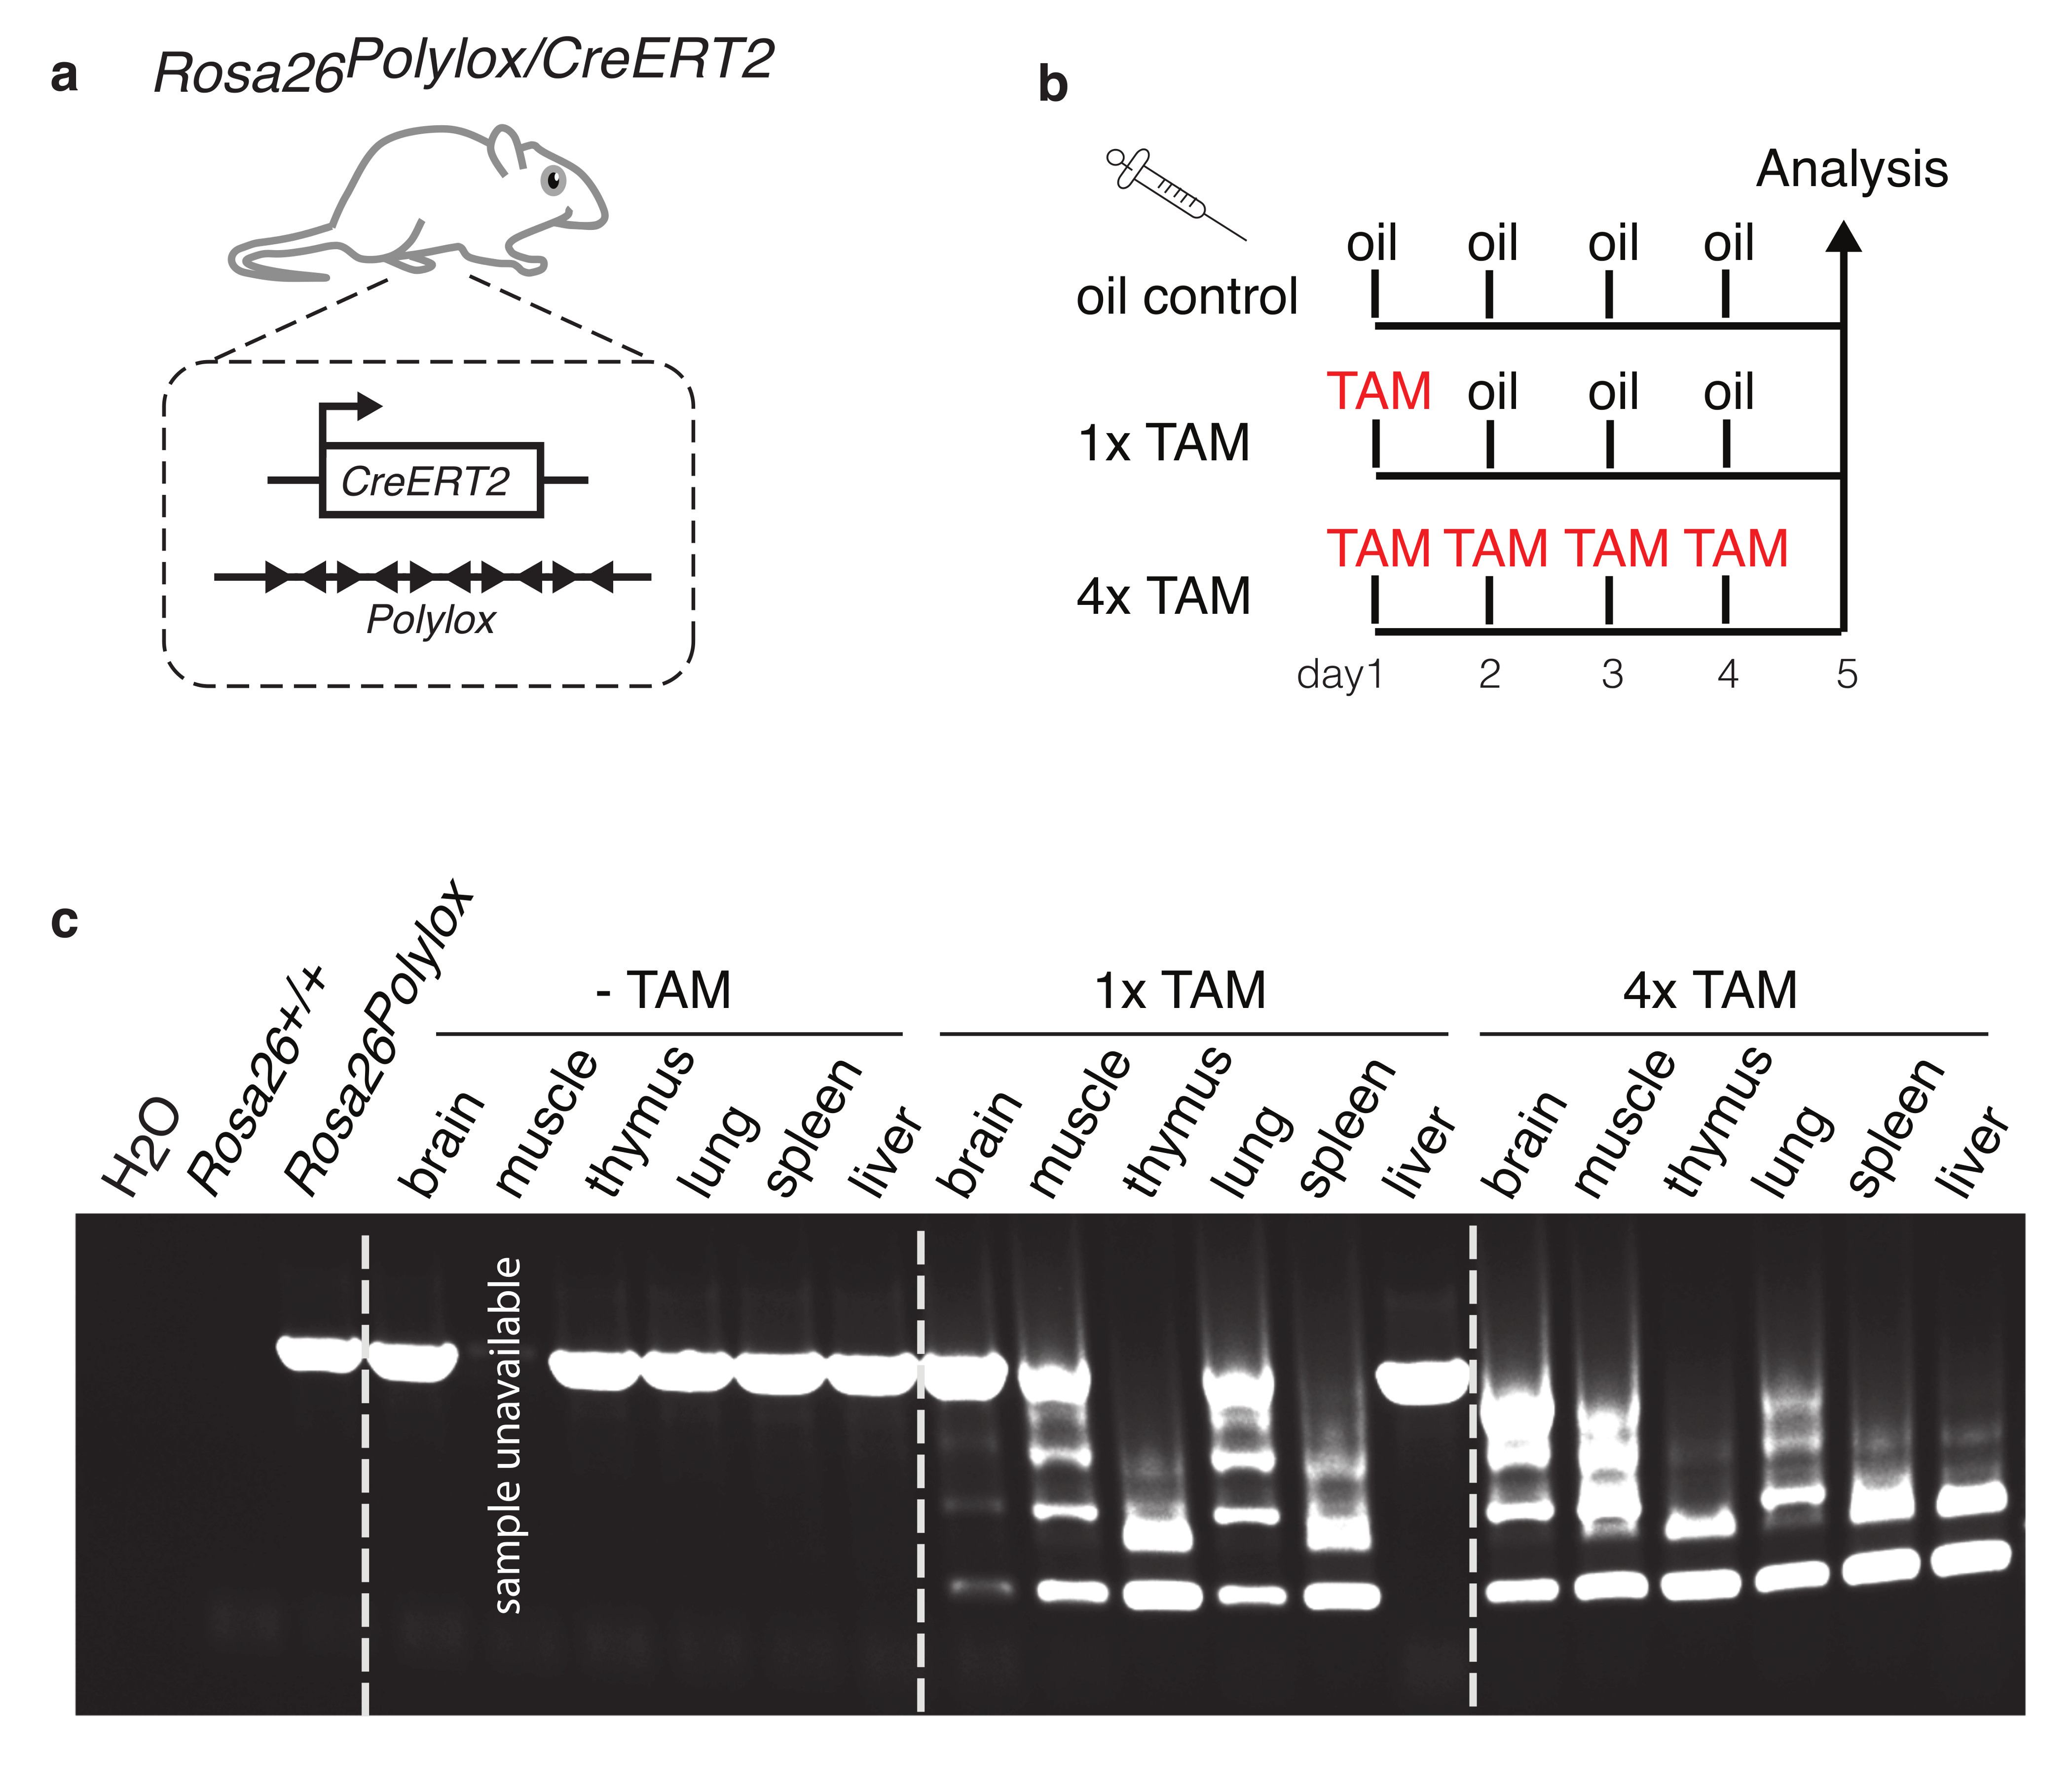
a, To induce Polylox recombination in different tissues in vivo, we crossed the Rosa26Polylox allele into mice bearing the Rosa26CreERT2 allele, which encodes ubiquitously expressed, tamoxifen-regulated Cre, yielding Rosa26Polylox/CreERT2. b, Adult Rosa26Polylox/CreERT2 mice were injected with tamoxifen, or with oil only (vehicle control) according to the depicted schedule, and were analyzed on day 5. c, Genomic DNA was prepared from indicated organs that represent developmental derivatives of all three germ layers: brain (ectoderm), muscle, spleen, and thymus (mesoderm), and liver and lung (endoderm). The Polylox cassette was amplified by PCR, and recombination in each tissue and for all time points was visualized by separating DNA fragments by gel electrophoresis (Supplementary Fig. 1f). The first lane is the PCR water control, the second lane is from Rosa26+/+ DNA template, and the third lane is from Rosa26Polylox (no Cre) template; all other lanes show data from Rosa26Polylox/CreERT2 mice for the indicated organs and conditions. The DNA sample and PCR result from the muscle oil control were not available.
Extended Data Table 1. Overview of mice used in individual experiments.
In-utero labeling for embryonic treatment (E9.5, E10.5) was done by oral gavage to the mother. Labeling of adult mice was done by intraperitoneal (i.p.) tamoxifen injection at the age indicated. Time after treatment is given as the time span between first treatment and the day of analysis.
|
| |||||
|---|---|---|---|---|---|
| Mouse number | Genotype | Sex | Treatment (Age) | Analysis (time after treatment) | |
|
| |||||
| Fig. 3a | #1 | Rosa26Polylox/CreERT2 | f | 1x TAM i.p. (15wks) | 18 hours |
|
| |||||
| Fig. 3b, c | #1 | Rosa26Polylox/CreERT2 | f | 1x TAM i.p. (15wks) | 18 hours |
| #2 | Rosa26Polylox/CreERT2 | f | 1x TAM i.p. (6mo) | 6 weeks | |
| #3 | Rosa26PolyloxTie2MCM | m | 1x TAM (E9.5) | 9 months | |
|
| |||||
| Fig. 4b | #3 | Rosa26PolyloxTie2MCM | m | 1x TAM (E9.5) | 9 months (= Exp. 1) |
| #6 | Rosa26PolyloxTie2MCM | m | 1x TAM (E9.5) | 11 months (= Exp. 2) | |
|
| |||||
| Fig. 4c, d | #3 | Rosa26PolyloxTie2MCM | m | 1x TAM (E9.5) | 9 months (= Exp. 1) |
|
| |||||
| Fig. 4e | #3 | Rosa26PolyloxTie2MCM | m | 1x TAM (E9.5) | 9 months (= Exp. 1) |
| #6 | Rosa26PolyloxTie2MCM | m | 1x TAM (E9.5) | 11 months (= Exp. 2) | |
|
| |||||
| Fig. 4f | #3 | Rosa26PolyloxTie2MCM | m | 1x TAM (E9.5) | 9 months (= Exp. 1) |
|
| |||||
| Fig. 5a-e | #3 | Rosa26PolyloxTie2MCM | m | 1x TAM (E9.5) | 9 months (= Exp. 1) |
|
| |||||
| Fig. 5f-h | #6 | Rosa26PolyloxTie2MCM | m | 1x TAM (E9.5) | 11 months (= Exp. 2) |
|
| |||||
| Fig. 5 i | #10 | Rosa26PolyloxTie2MCM | f | 5x TAM i.p. (7wks) | 11 months (= Exp. 5) |
|
| |||||
| Fig. 5j, k | #8 | Rosa26PolyloxTie2MCM | f | 5x TAM i.p. (8wks) | 9 months (= Exp. 3) |
|
| |||||
| Ext Data Fig. 2c | #4 | Rosa26PolyloxTie2MCM | f | No treatment | 7 months |
| #5 | Rosa26Polylox | f | 1x TAM (E10.5) | 8 months | |
| #6 | Rosa26PolyloxTie2MCM | m | 1x TAM (E9.5) | 11 months | |
|
| |||||
| Ext Data Fig. 3a | #3 | Rosa26PolyloxTie2MCM | m | 1x TAM (E9.5) | 9 months (= Exp. 1) |
|
| |||||
| Ext Data Fig. 3b-e | #1 | Rosa26Polylox/CreERT2 | f | 1x TAM i.p. (15wks) | 18 hours |
|
| |||||
| Ext Data Fig. 3g | #3 | Rosa26PolyloxTie2MCM | m | 1x TAM (E9.5) | 9 months (= Exp. 1) |
| #6 | Rosa26PolyloxTie2MCM | m | 1x TAM (E9.5) | 11 months (= Exp. 2) | |
|
| |||||
| Ext Data Fig. 4 | #3 | Rosa26PolyloxTie2MCM | m | 1x TAM (E9.5) | 9 months (= Exp. 1) |
| #6 | Rosa26PolyloxTie2MCM | m | 1x TAM (E9.5) | 11 months (= Exp. 2) | |
|
| |||||
| Ext Data Fig. 5a-h | #8 | Rosa26PolyloxTie2MCM | f | 5x TAM i.p. (8wks) | 9 months (= Exp. 3) |
|
| |||||
| Ext Data Fig. 5 j, k | #3 | Rosa26PolyloxTie2MCM | m | 1x TAM (E9.5) | 9 months (= Exp. 1) |
|
| |||||
| Ext Data Fig. 6 a, b | #6 | Rosa26PolyloxTie2MCM | m | 1x TAM (E9.5) | 11 months (= Exp. 2) |
|
| |||||
| Ext Data Fig. 7 a-c | #3 | Rosa26PolyloxTie2MCM | m | 1x TAM (E9.5) | 9 months (= Exp. 1) |
|
| |||||
| Ext Data Fig. 7 d | #6 | Rosa26PolyloxTie2MCM | m | 1x TAM (E9.5) | 11 months (= Exp. 2) |
|
| |||||
| Ext Data Fig. 7 e-g | #3 | Rosa26PolyloxTie2MCM | m | 1x TAM (E9.5) | 9 months (= Exp. 1) |
| #6 | Rosa26PolyloxTie2MCM | m | 1x TAM (E9.5) | 11 months (= Exp. 2) | |
|
| |||||
| Ext Data Fig. 7 h | #6 | Rosa26PolyloxTie2MCM | m | 1x TAM (E9.5) | 11 months (= Exp. 2) |
|
| |||||
| Ext Data Fig. 8 b | #7 | Rosa26PolyloxTie2MCM | f | 5x TAM i.p. (28wks) | 2 weeks |
|
| |||||
| Ext Data Fig. 8 c, d | #8 | Rosa26PolyloxTie2MCM | f | 5x TAM i.p. (8wks) | 9 months (= Exp. 3) |
| #9 | Rosa26PolyloxTie2MCM | f | 5x TAM i.p. (8wks) | 11 months (= Exp. 4) | |
|
| |||||
| Ext Data Fig. 8 e, f | #8 | Rosa26PolyloxTie2MCM | f | 5x TAM i.p. (8wks) | 9 months (= Exp. 3) |
|
| |||||
| Ext Data Fig. 9 c | #11 | Rosa26Polylox/CreERT2 | f | 4x oil i.p. | 4 days |
| #12 | Rosa26Polylox/CreERT2 | f | 1x TAM, 3x oil i.p. | 4 days | |
| #13 | Rosa26Polylox/CreERT2 | f | 4x TAM i.p. | 4 days | |
|
| |||||
Supplementary Material
Acknowledgements
We thank J. Muehling, S. Oh, C. Heiner, P. Lobb, R. Lleras and C. Koenig (Pacific Biosciences), E. Hobeika (Ulm), S. Schäfer, T. Grünzinger (DKFZ), K. Reifenberg, M. Socher, A. Frenznick (Animal Facility DKFZ), F. v. der Hoeven, U. Kloz (Transgenic Service DKFZ), and N. Diessl, C. Previti and S. Wiemann (Genomics & Proteomics Core Facilities DKFZ) for help, and R. Hoess, H. Glimm and K. Rajewsky for discussions. TH is supported by CellNetworks, DKFZ core funding and e:Bio BMBF project FKZ 0316182B (SB-Epo); TF and HRR are supported by Transregio 156-A07; HRR is supported by SFB 873-B11, ERC Advanced Grant 742883, and DKFZ core funding.
Footnotes
Author contributions WP, TF, DP, KB, KK and ND performed experiments, WP and TF generated Polylox, XW and DP decoded Polylox, JR and TH performed barcode calculations and mathematical modeling, KB generated mice, IR suggested in vitro barcode testing, CQ sequenced barcodes, supported by WC and SS, SW provided sequencing considerations, TH and HRR supervised the study, and wrote the paper, with input from TF, and HRR conceived the study.
Author information Reprints and permissions information is available at www.nature.com/reprints.
The authors declare no competing financial interest. The German Cancer Research Center has filed an international patent application entitled “Genetic random DNA barcode generator for in vivo cell tracing” (PCT/EP2016/065932). HR Rodewald, TB Feyerabend and W. Pei are listed as inventors.
References
- 1.Kretzschmar K, Watt FM. Lineage tracing. Cell. 2012;148:33–45. doi: 10.1016/j.cell.2012.01.002. [DOI] [PubMed] [Google Scholar]
- 2.Keller G, Paige C, Gilboa E, Wagner EF. Expression of a foreign gene in myeloid and lymphoid cells derived from multipotent haematopoietic precursors. Nature. 1985;318:149–154. doi: 10.1038/318149a0. [DOI] [PubMed] [Google Scholar]
- 3.Gerrits A, et al. Cellular barcoding tool for clonal analysis in the hematopoietic system. Blood. 2010;115:2610–2618. doi: 10.1182/blood-2009-06-229757. [DOI] [PubMed] [Google Scholar]
- 4.Sun J, et al. Clonal dynamics of native haematopoiesis. Nature. 2014;514:322–327. doi: 10.1038/nature13824. [DOI] [PMC free article] [PubMed] [Google Scholar]
- 5.McKenna A, et al. Whole organism lineage tracing by combinatorial and cumulative genome editing. Science. 2016 doi: 10.1126/science.aaf7907. [DOI] [PMC free article] [PubMed] [Google Scholar]
- 6.Sternberg N, Hamilton D. Bacteriophage P1 site-specific recombination. I. Recombination between loxP sites. J Mol Biol. 1981;150:467–486. doi: 10.1016/0022-2836(81)90375-2. [DOI] [PubMed] [Google Scholar]
- 7.Rajewsky K, et al. Conditional gene targeting. J Clin invest. 1996;98:600–603. doi: 10.1172/JCI118828. [DOI] [PMC free article] [PubMed] [Google Scholar]
- 8.Yamamoto R, et al. Clonal analysis unveils self-renewing lineage-restricted progenitors generated directly from hematopoietic stem cells. Cell. 2013;154:1112–1126. doi: 10.1016/j.cell.2013.08.007. [DOI] [PubMed] [Google Scholar]
- 9.Notta F, et al. Distinct routes of lineage development reshape the human blood hierarchy across ontogeny. Science. 2016;351:aab2116. doi: 10.1126/science.aab2116. [DOI] [PMC free article] [PubMed] [Google Scholar]
- 10.Velten L, et al. Human haematopoietic stem cell lineage commitment is a continuous process. Nat Cell Biol. 2017;19:271–281. doi: 10.1038/ncb3493. [DOI] [PMC free article] [PubMed] [Google Scholar]
- 11.Hoess R, Wierzbicki A, Abremski K. Formation of small circular DNA molecules via an in vitro site-specific recombination system. Gene. 1985;40:325–329. doi: 10.1016/0378-1119(85)90056-3. [DOI] [PubMed] [Google Scholar]
- 12.Junker JP, et al. Massively parallel clonal analysis using CRISPR/Cas9 induced genetic scars. 2017 http://biorxiv.org/content/early/2017/01/04/056499.
- 13.Rybtsov S, Ivanovs A, Zhao S, Medvinsky A. Concealed expansion of immature precursors underpins acute burst of adult HSC activity in foetal liver. Development. 2016;143:1284–1289. doi: 10.1242/dev.131193. [DOI] [PMC free article] [PubMed] [Google Scholar]
- 14.Busch K, et al. Fundamental properties of unperturbed haematopoiesis from stem cells in vivo. Nature. 2015;518:542–546. doi: 10.1038/nature14242. [DOI] [PubMed] [Google Scholar]
- 15.Akashi K, Traver D, Miyamoto T, Weissman IL. A clonogenic common myeloid progenitor that gives rise to all myeloid lineages. Nature. 2000;404:193–197. doi: 10.1038/35004599. [DOI] [PubMed] [Google Scholar]
- 16.Terszowski G, et al. Prospective isolation and global gene expression analysis of the erythrocyte colony-forming unit (CFU-E) Blood. 2005;105:1937–1945. doi: 10.1182/blood-2004-09-3459. [DOI] [PubMed] [Google Scholar]
- 17.Paul F, et al. Transcriptional Heterogeneity and Lineage Commitment in Myeloid Progenitors. Cell. 2015;163:1663–1677. doi: 10.1016/j.cell.2015.11.013. [DOI] [PubMed] [Google Scholar]
- 18.Perie L, Duffy KR, Kok L, de Boer RJ, Schumacher TN. The Branching Point in Erythro-Myeloid Differentiation. Cell. 2015;163:1655–1662. doi: 10.1016/j.cell.2015.11.059. [DOI] [PubMed] [Google Scholar]
- 19.Sawai CM, et al. Hematopoietic Stem Cells Are the Major Source of Multilineage Hematopoiesis in Adult Animals. Immunity. 2016;45:597–609. doi: 10.1016/j.immuni.2016.08.007. [DOI] [PMC free article] [PubMed] [Google Scholar]
- 20.Schoedel KB, et al. The bulk of the hematopoietic stem cell population is dispensable for murine steady-state and stress hematopoiesis. Blood. 2016 doi: 10.1182/blood-2016-03-706010. [DOI] [PubMed] [Google Scholar]
- 21.Sheikh BN, et al. MOZ (KAT6A) is essential for the maintenance of classically defined adult hematopoietic stem cells. Blood. 2016 doi: 10.1182/blood-2015-10-676072. [DOI] [PubMed] [Google Scholar]
- 22.Weber TS, et al. Site-specific recombinatorics: in situ cellular barcoding with the Cre Lox system. BMC Syst Biol. 2016;10:43. doi: 10.1186/s12918-016-0290-3. [DOI] [PMC free article] [PubMed] [Google Scholar]
- 23.Weissman TA, Pan YA. Brainbow: new resources and emerging biological applications for multicolor genetic labeling and analysis. Genetics. 2015;199:293–306. doi: 10.1534/genetics.114.172510. [DOI] [PMC free article] [PubMed] [Google Scholar]
- 24.Dick JE, Magli MC, Huszar D, Phillips RA, Bernstein A. Introduction of a selectable gene into primitive stem cells capable of long-term reconstitution of the hemopoietic system of W/Wv mice. Cell. 1985;42:71–79. doi: 10.1016/s0092-8674(85)80102-1. [DOI] [PubMed] [Google Scholar]
- 25.Kawamoto H, Ikawa T, Masuda K, Wada H, Katsura Y. A map for lineage restriction of progenitors during hematopoiesis: the essence of the myeloid-based model. Immunol Rev. 2010;238:23–36. doi: 10.1111/j.1600-065X.2010.00959.x. [DOI] [PubMed] [Google Scholar]
- 26.Ventura A, et al. Restoration of p53 function leads to tumour regression in vivo. Nature. 2007;445:661–665. doi: 10.1038/nature05541. [DOI] [PubMed] [Google Scholar]
- 27.Pei W, et al. Protocol for the use of Polylox—endogenous barcoding for high resolution in vivo lineage tracing. Protoc Exch. 2017 doi: 10.1038/protex.2017.092. [DOI] [Google Scholar]
- 28.Pettitt SJ, et al. Agouti C57BL/6N embryonic stem cells for mouse genetic resources. Nat Methods. 2009;6:493–495. doi: 10.1038/nmeth.1342. [DOI] [PMC free article] [PubMed] [Google Scholar]
- 29.Hooper M, Hardy K, Handyside A, Hunter S, Monk M. HPRT-deficient (Lesch-Nyhan) mouse embryos derived from germline colonization by cultured cells. Nature. 1987;326:292–295. doi: 10.1038/326292a0. [DOI] [PubMed] [Google Scholar]
- 30.Soriano P. Generalized lacZ expression with the ROSA26 Cre reporter strain. Nat Genet. 1999;21:70–71. doi: 10.1038/5007. [DOI] [PubMed] [Google Scholar]
- 31.Luche H, Weber O, Nageswara Rao T, Blum C, Fehling HJ. Faithful activation of an extra-bright red fluorescent protein in "knock-in" Cre-reporter mice ideally suited for lineage tracing studies. European journal of immunology. 2007;37:43–53. doi: 10.1002/eji.200636745. [DOI] [PubMed] [Google Scholar]
- 32.Zhang Y, et al. Inducible site-directed recombination in mouse embryonic stem cells. Nucleic acids research. 1996;24:543–548. doi: 10.1093/nar/24.4.543. [DOI] [PMC free article] [PubMed] [Google Scholar]
- 33.Chen K, et al. Resolving the distinct stages in erythroid differentiation based on dynamic changes in membrane protein expression during erythropoiesis. Proc Natl Acad Sci U S A. 2009;106:17413–17418. doi: 10.1073/pnas.0909296106. [DOI] [PMC free article] [PubMed] [Google Scholar]
Associated Data
This section collects any data citations, data availability statements, or supplementary materials included in this article.