Abstract
A clinical trial on the autofluorescence imaging of skin lesions comprising 16 dermatologically confirmed pigmented nevi, 15 seborrheic keratosis, 2 dysplastic nevi, histologically confirmed 17 basal cell carcinomas and 1 melanoma was performed. The autofluorescence spatial properties of the skin lesions were acquired by smartphone RGB camera under 405 nm LED excitation. The diagnostic criterion is based on the calculation of the mean autofluorescence intensity of the examined lesion in the spectral range of 515 nm–700 nm. The proposed methodology is able to differentiate seborrheic keratosis from basal cell carcinoma, pigmented nevi and melanoma. The sensitivity and specificity of the proposed method was estimated as being close to 100%. The proposed methodology and potential clinical applications are discussed in this article.
OCIS codes: (170.0170) Medical optics and biotechnology; (170.6280) Spectroscopy, fluorescence and luminescence
1. Introduction
Skin cancer is an increasing problem for light skinned populations worldwide. Depending on the melanin concentration, skin tumors are broadly classified into two types - malignant melanomas (MM) and non-melanoma skin cancer (NMSC). MM is the most aggressive skin cancer modality with the death rate 85% of all fatal skin cancer cases [1]. The most common NMSC are basal cell carcinoma (BCC, about 80% of new cases) and squamous cell carcinoma (SCC, about 20% of new cases) derived from the basal and squamous cells of the epidermis, respectively. BCC is characterized by very slow growth tendency, low mortality rate, and high risk of recurrence, while SCC is more aggressive and associated with the risk of metastasis [2]. Early detection and removal of skin cancer can significantly increase the 5-year survival rate.
Currently, the technique most widely used by dermatologists for the detection of skin cancer is visual examination in combination with dermoscope. A serious limitation of this technique is a large number of false positive results leading to unnecessary tumor removal, high direct costs of the treatment and negative cosmetic and psycho-emotional consequences for patients. In particular, the diagnostic accuracy of skin cancer mainly depends on dermatologist’s experience and can vary according to different estimates in range 29-88% [3]. According to the literature data, the most frequently misdiagnosed BCC’s have been confirmed as 21.7% squamous cell carcinoma (SCC), 21.7% seborrheic keratosis (SK), 13.0% actinic keratosis and 8.6% lichenoid reaction [4]. In comparison, misdiagnosed superficial spreading melanomas have been confirmed as 42% BCC, 19% SCC, 33% nevus and 23% seborrheic keratosis [3]. In accordance to the literature, the seborrheic keratosis (SK) often is suspected as cancerous lesion (BCC or MM), which is explained by SK color variabilities from white to black [5,6]. Development of non-invasive methods that could improve diagnostic accuracy of skin cancer is still a topical challenge for dermatology worldwide. The morphological and functional properties of skin cancer such as altered chromophore and fluorophore content, metabolic rate, melanin concentration, blood perfusion, as well as increased generation of reactive oxygen species should be determined with a higher accuracy [7–11]. From this point biophotonic techniques can contribute to improved non-invasive diagnostics and monitoring of skin cancer. Optical methods providing cellular level resolution, such as confocal reflectance microscopy or multiphoton fluorescence microscopy are expensive and therefore available mainly in large clinics and university hospitals [12,13]. Commercial devices exploiting skin multispectral reflectance and fluorescence features such as MelaFind, SIAscope, Velscope are suitable for non-invasive cancer diagnostics. However, their insufficient specificity is the main limiting factor for wide clinical implementation in routine clinical praxis [14,15]. Thanks to wide accessibility and rapid development of computing power and the integrated camera image quality, smartphone applications for skin cancer diagnostics is an emerging field of studies [16]. Wide clinical implementation of smartphones is still limited by several technical problems, such as non-polarized white light illumination, low infrared sensitivity, unalterable lens focal length, insufficient dynamic range of sensor brightness, insufficient resolution, etc [17]. These technical problems can be partially solved by attaching add-on devices to the smartphone. Such external devices can provide sufficient improvement of optical image quality and adequate imaging of in-vivo skin autofluorescence and multi-spectral diffuse reflectance by means of spectrally specific illumination [18,19].
The aim of the present study is to evaluate clinical efficiency of the smartphone add-on illumination device for acquisition of skin autoflorescence RGB images under 405 nm LED excitation [18]. Clinical results related to autofluorescence intensity spatial properties of skin benign and malignant lesions are presented; they illustrate the possibility to differentiate seborrheic keratosis from basal cell carcinoma, pigmented nevi and melanoma. Potential improvements of skin cancer diagnostics accuracy have been considered.
2. Materials and methods
In-vivo skin autofluorescence images under 405 nm LED excitation (model LED Engin LZ1-00UA00-U8, spectral band half-width 30 nm) were recorded and further analyzed. External LED illumination device ensured fixed 60 mm distance between the smartphone camera and the examined skin area (diameter 40 mm) which was evenly irradiated with average power density of 20 mW/cm2. A long pass filter (>515 nm) was placed in front of smartphone camera to prevent detection of the LED emission. The recorded RGB images were further separated to exploit R- and G-band signals for analysis of skin tissue AF intensity in the red and green spectral bands, respectively. The Nexus5 smartphone with integrated CMOS RGB image sensor with resolution of 13 MP was used for image acquisition. All images were taken using the following settings: ISO—100, white balance—daylight, focus—manual, exposure time—fixed 200 ms. The detailed description of the prototype device can be found in [18,19]. Referring to manufacturer's data (Sony LSI Design Incorporated, private correspondence) and with respect to the cut-off filter, the G-band sensitivity covered the spectral range ~515-650nm with maximum at 530 nm and the R-band sensitivity - the range ~570-700 nm with maximum at 600 nm. Due to the spectral cutoff by 515 nm long pass filter, the Blue- band image signal is close to sensor noise level and the resulting RGB image represents the sum of AF signal detected by Green and Red channels. For better color representation of skin AF color variabilities all images included to the study are showed in RGB mode. The G-band images represent a maximum of skin autofluorescence emission under 405 nm excitation and have been selected for the further analysis of autofluorescence intensity. R-band images mostly visualize red autofluorescence of skin attributed to endogenous porphyrins [20,21]. To avoid induced autofluorescence intensity decrease caused by photobleaching process [18], all images were taken during the first second of LED's exposure. Further the ROI of G-band images (visible lesion area) were manually selected, with subsequent calculation of the mean intensity of the selected area. The visible lesion area (ROI) was manually selected and defined as an internal part of area with substantially different AF intensity in comparison with healthy surrounding skin. The mean AF intensity was calculated from the whole lesion including areas of low and high fluorescence intensity. To obtain the mean AF intensities of healthy skin, an unpigmented skin area with uniform distribution of intensity values was selected outside the lesion. In cases where it was not possible to mark the healthy skin area in the same image, a separate healthy skin image was taken outside the lesion. The determination and selection of the lesion area with subsequent calculation of AF mean value was performed by the same person for all the clinical cases. Mean intensity of ROI is expressed as intensity sum of selected pixels divided by a number of pixels. Image processing as well as calculation of the mean intensity were enabled by the Matlab software. All RGB images presented in the paper represent the skin surface with the relevant size of 2x2cm.
This study was approved by the Ethics Committee of the University of Latvia. All involved volunteers were informed about the study and signed the required consent. The lesions were diagnosed by competent (clinical experience more than 20 years) oncologists of Oncology Center of Latvia, using a commercial dermoscope, Heine Delta 20, HEINE USA LTD. Overall 51 different skin lesion were included to the study: 16 dermatologically confirmed pigmented nevi, 15 dermatologically confirmed seborrheic keratosis, 2 dermatologically confirmed dysplastic nevi, 17 histologically basal cell carcinomas and 1 histologically confirmed melanoma.
3. Results and discussion
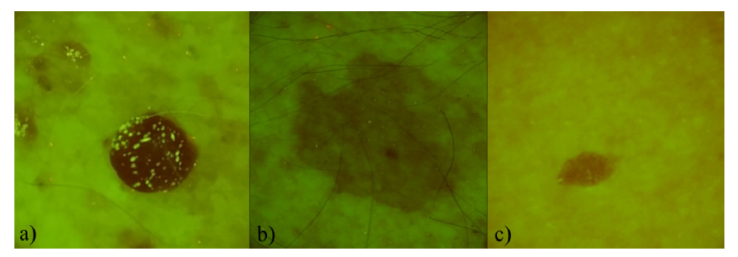
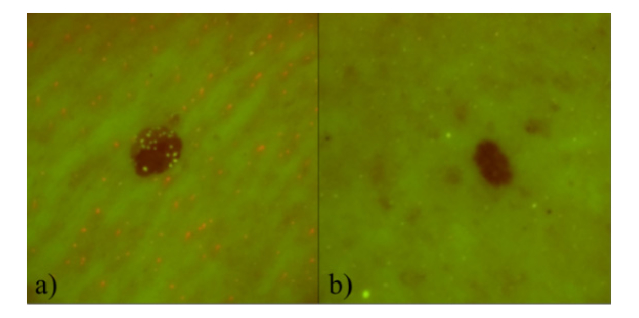
The RGB images presenting spatial distribution of autofluorescence intensity in the range 515-700 nm for pigmented and dysplastic nevi are shown in Fig. 1 and Fig. 2. Visually pigmented and dysplastic nevi show similar features - AF intensity in the lesion is lower in comparison with the surrounding healthy skin. Decreased autofluorescence intensity correlates mainly with the changes in the collagen structures [22,23]. Some of the nevi expressed shining inclusions, for example, 5 of 16 pigmented nevi cases (Fig. 1(a)) and 1 of 2 dysplastic nevi cases (Fig. 2(a). These inclusions might be associated with increased keratin content on the lesion’s surface [24]. In some cases (Fig. 2(a) evenly distributed red and green spots were observed on the skin surface. The red spots most probably represent porphyrins which are bacterial excretions that can become lodged in pores [20,21]. The G-band autofluorescence from surrounding skin mainly originates from endogenous fluorophores, such as elastin cross links, NADH, flavins, keratins [25].
Fig. 1.
Three examples of pigmented nevi AF signal in the filtered RGB images: a) 85 year-old male, left collar bone area, b) 81 year-old male, left shoulder, c) 56 year-old female, left side of the abdomen.
Fig. 2.
Filtered RGB autofluorescence images of dysplastic nevi: a) 67 year-old female, between the shoulder blades, b) 41 year-old male, back.
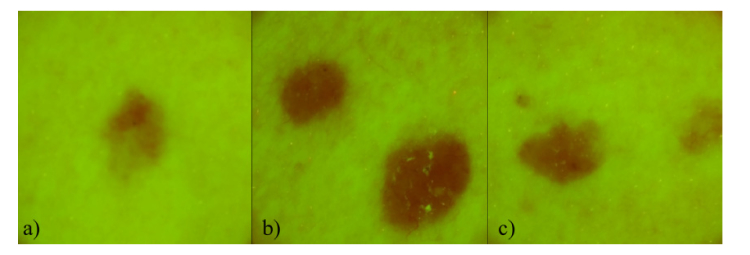
Filtered RGB autofluorescence images of multiple basal cell carcinomas from one patient are illustrated in Fig. 3. Visually it is not possible to distinguish BCC from the nevi groups (Fig. 1 and Fig. 2) - AF intensity from the lesion is always lower in comparison with the surrounding healthy skin.
Fig. 3.
Filtered AF images of multiple basal cell carcinoma of 44 y.o. male: a),b) and c), all located on the left breast.
Figure 4 shows the AF intensity spatial distribution of ulcerating malignant melanoma (MM). It has been noticed that intensity of the MM image is much lower than it has been observed in other groups of skin malformations.
Fig. 4.
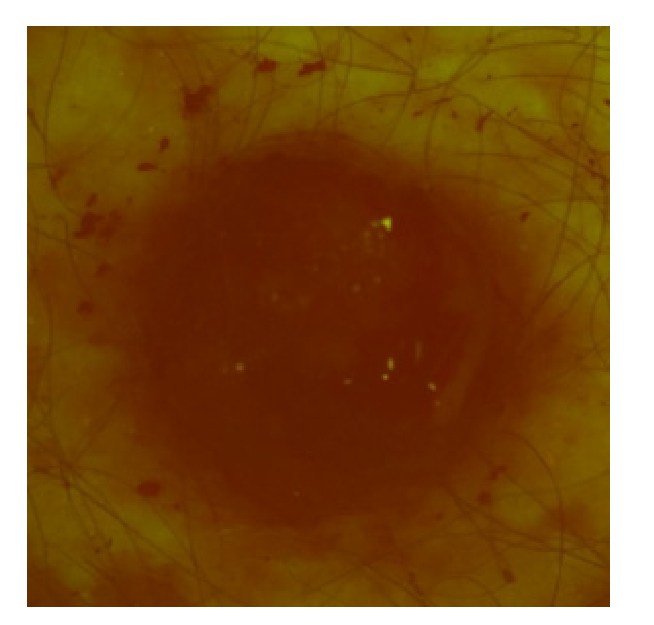
Filtered RGB image representing AF signal of malignant melanoma with ulceration, 52 year-old male, left blade.
Three examples of AF spatial distributions for seborrheic keratosis are shown in Fig. 5. All (15 of 15) seborrheic keratosis showed similar features - most of the lesion area emitted more intensive AF signal compared to other lesion groups.
Fig. 5.
Three examples of filtered RGB autofluorescence intensity images of seborrheic keratosis: a) 85 year-old male, left hip, b) 85 year-old male, back belt location, c) 81 year-old male, back belt location.
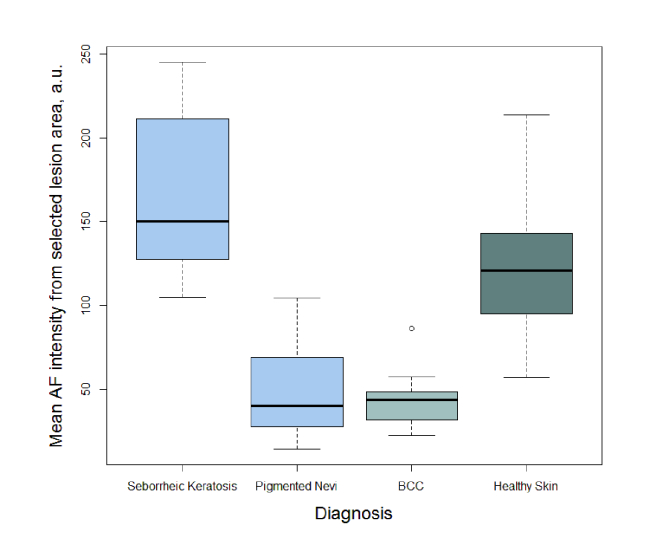
For quantitative assessment of the studied 5 lesion groups; the mean AF intensity was calculated within the visual area of the lesion. The box-of-whiskers plot of AF intensity mean values for seborrheic keratosis, pigmented nevi, BCC, and healthy skin has been depicted in Fig. 6. As the results include only 2 dysplastic nevi (mean value- 23.7 a.u. and 43.8 a.u.) and one melanoma (mean value- 8.9 a.u.) data, they are not depicted in box-of-whiskers plot (Fig. 6).
Fig. 6.
Distributions of the mean autofluorescence intensity for seborrheic keratoses, pigmented nevi, basal cell carcinomas, and healthy skin.
Using the analysis of the mean value calculations obtained from the lesion area, it was observed (Fig. 6) that it is possible to separate seborrheic keratosis from BCC and Nevi groups with sensitivity and specificity close to 100%, as all the measured mean AF intensities from seborrheic keratosis exceeded those from all the other lesions considered in this study. Testing the sensitivity and specificity of the method for seborrheic keratosis separation from other lesion groups, the following values have been obtained; true positives (TP) were 15, true negatives (TN) were 36, false positives (FP) were 0 and false negatives (FN) were 0. Respectively, the Sensitivity is TP / (TP + FN) = 15 / (15 + 0) = 100%, Specificity is TN / (TN + FP) = 36 / (36 + 0) = 100%. The obtained high diagnostic parameters are strictly theoretical, since the groups of SK and nevi do not overlap. On the other hand, the boundary values of those groups are very close, and the reliable specificity and sensitivity of the method most probably is in range of 90 - 100%. Our results also show that the only one melanoma case had a significantly lower AF intensity than all other lesion groups and it is possible to separate it from the other skin malformations. Since the number of melanoma and dysplastic nevi don't provide statistically reliable data, further study is necessary to collect more clinical cases. However, according to literature data, highly pigmented lesions, such as melanoma and dysplastic nevi are commonly characterized by low autofluorescence intensity under violet-blue excitation [7,9]. Therefore we can assume that the proposed method also may be valid for discrimination of seborrheic keratosis from melanoma and dysplastic nevi. Despite the high sensitivity/specificity of the proposed methodology, further studies including more clinical cases are required. Especially, cases of squamous cell carcinoma and keratoacanthoma that are characterized by increased autofluorescence intensity under violet-blue excitation [25] should be involved to the study. The obtained results represent absolute values of autofluorescence intensity captured by RGB image sensor under specific LED illumination. Besides, the evaluated diagnostics threshold is valid only for this particular case which is depending on a set of factors: LED intensity, exposition time, RGB sensor spectral sensitivity and illumination/detecting geometry. Another issue of further improvements should be focused on the development of algorithms for determination borders of the lesions, thereby reducing the variabilities of diagnostic values affected by subjective choice. Further studies are needed to determine the calibration algorithm eliminating the above mentioned factors. For example, LED illumination inhomogeneities as well as exposition time can be calibrated by a fluorescing etalon, which would allow the use of proposed diagnostics method for wide range of image sensors in combination with spectrally specific LED illumination.
4. Conclusions
The reported results demonstrate that sensitivity and specificity of the skin lesion diagnostics by smartphone-detected AF images can be very high. In particular, the analysis of 405 nm LED excited autofluorescences images captured by smartphone-integrated RGB camera enabled to discriminate seborrheic keratoses from BCC, MM, pigmented and dysplastic nevi with sensitivity and specificity close to 100%. In spite of the fact that seborrheic keratosis is benign, it is frequently mistakenly suspected as a malignant lesion during BCC and MM visual diagnostics, leading to unnecessary excision. The proposed approach further can be implemented as a routine method for increasing the diagnostic accuracy of suspicious lesions that is crucial in skin cancer diagnostics, as well as for full body examination for timely detection of tumor recurrence. Undoubtedly, additional studies are needed to collect more clinical data for determination of the diagnostic thresholds and for full automatization of the diagnostic algorithms.
Funding
Latvian National research program SOPHIS (No. 10-4/VPP-4/11); European Regional Development Fund (1.1.1.1/16/A/197, 1.1.1.2/16/1/001 agreement No. 1.1.1.2/VIAA/1/16/052).
Disclosures
The authors declare that there are no conflicts of interest related to this article.
References and links
- 1. American Cancer Society, “Cancer Facts and Figures 2017,” (American Cancer Society, 2017) http://www.cancer.org/acs/groups/content/@editorial/documents/document/acspc-048738.pdf. [Google Scholar]
- 2. Rigel D. S., Robinson J., Ross M., Friedman R., Cockerell C., Lim H., Kirkwood J., Cancer of the Skin: 2nd Edition (Saunders, 2011), Chap. 11. [Google Scholar]
- 3.Lin M. J., Mar V., McLean C., Wolfe R., Kelly J. W., “Diagnostic accuracy of malignant melanoma according to subtype,” Australas. J. Dermatol. 55(1), 35–42 (2014). 10.1111/ajd.12121 [DOI] [PubMed] [Google Scholar]
- 4.Mohammad E. A., Mansour M., Parichehr K., Farideh D., Amirhossein R., Ahmad S. A., “Assessment of clinical diagnostic accuracy compared with pathological diagnosis of basal cell carcinoma,” Indian Dermatol. Online J. 6(4), 258–262 (2015). 10.4103/2229-5178.160257 [DOI] [PMC free article] [PubMed] [Google Scholar]
- 5.Lin J., Han S., Cui L., Song Z., Gao M., Yang G., Fu Y., Liu X., “Evaluation of dermoscopic algorithm for seborrhoeic keratosis: a prospective study in 412 patients,” J. Eur. Acad. Dermatol. Venereol. 28(7), 957–962 (2014). 10.1111/jdv.12241 [DOI] [PubMed] [Google Scholar]
- 6. Oakley A., “Dermoscopy of seborrhoeic keratosis CME,” (DermNet NZ, 2008) https://www.dermnetnz.org/cme/dermoscopy-course/dermoscopy-of-seborrhoeic-keratosis/. [Google Scholar]
- 7.Zonios G., Dimou A., Bassukas I., Galaris D., Tsolakidis A., Kaxiras E., “Melanin absorption spectroscopy: new method for noninvasive skin investigation and melanoma detection,” J. Biomed. Opt. 13(1), 014017 (2008). 10.1117/1.2844710 [DOI] [PubMed] [Google Scholar]
- 8.Gerhäuser C., “Cancer cell metabolism, epigenetics and the potential influence of dietary components – A perspective,” Biomed. Res. 23(1), 1–21 (2012).22361880 [Google Scholar]
- 9.Borisova E. G., Angelova L. P., Pavlova E. P., “Endogenous and exogenous fluorescence skin cancer diagnostics for clinical applications,” IEEE J. Quantum Electron. 20(2), 7100412 (2014). [Google Scholar]
- 10.Liou G. Y., Storz P., “Reactive oxygen species in cancer,” Free Radic. Res. 44(5), 479–496 (2010). 10.3109/10715761003667554 [DOI] [PMC free article] [PubMed] [Google Scholar]
- 11.Platkov M., Tirosh R., Kaufman M., Zurgil N., Deutsch M., “Photobleaching of fluorescein as a probe for oxidative stress in single cells,” J. Photochem. Photobiol. B 140, 306–314 (2014). 10.1016/j.jphotobiol.2014.08.016 [DOI] [PubMed] [Google Scholar]
- 12.Carrera C., Puig S., Malvehy J., “In vivo confocal reflectance microscopy in melanoma,” Dermatol. Ther. (Heidelb.) 25(5), 410–422 (2012). 10.1111/j.1529-8019.2012.01495.x [DOI] [PubMed] [Google Scholar]
- 13.Balu M., Zachary C. B., Harris R. M., Krasieva T. B., König K., Tromberg B. J., Kelly K. M., “In Vivo Multiphoton Microscopy of Basal Cell Carcinoma,” JAMA Dermatol. 151(10), 1068–1074 (2015). 10.1001/jamadermatol.2015.0453 [DOI] [PMC free article] [PubMed] [Google Scholar]
- 14.March J., Hand M., Grossman D., “Practical application of new technologies for melanoma diagnosis: Part I. Noninvasive approaches,” J. Am. Acad. Dermatol. 72(6), 929–941 (2015). 10.1016/j.jaad.2015.02.1138 [DOI] [PubMed] [Google Scholar]
- 15.Ganga R. S., Gundre D., Bansal S., Shirsat P. M., Prasad P., Desai R. S., “Evaluation of the diagnostic efficacy and spectrum of autofluorescence of benign, dysplastic and malignant lesions of the oral cavity using VELscope,” Oral Oncol. 75, 67–74 (2017). 10.1016/j.oraloncology.2017.10.023 [DOI] [PubMed] [Google Scholar]
- 16.Hilgefort J. P., Fitzpatrick S., Lycans D., Wilson-Byrne T., Fisher C., Shuler F. D., “Smartphone mobile application to enhance diagnosis of skin cancer: A guide for the rural practitioner,” W. V. Med. J. 110(5), 40–44 (2014). [PubMed] [Google Scholar]
- 17.Chao J. T., Loescher L. J., Soyer H. P., Curiel-Lewandrowski C., “Barriers to mobile teledermoscopy in primary care,” J. Am. Acad. Dermatol. 69(5), 821–824 (2013). 10.1016/j.jaad.2012.10.039 [DOI] [PubMed] [Google Scholar]
- 18.Lihachev A., Derjabo A., Ferulova I., Lange M., Lihacova I., Spigulis J., “Autofluorescence imaging of basal cell carcinoma by smartphone RGB camera,” J. Biomed. Opt. 20(12), 120502 (2015). 10.1117/1.JBO.20.12.120502 [DOI] [PubMed] [Google Scholar]
- 19.Spigulis J., “Multispectral, fluorescent and photoplethysmographic imaging for remote skin assessment,” Sensors (Basel) 17(12), 1165 (2017). 10.3390/s17051165 [DOI] [PMC free article] [PubMed] [Google Scholar]
- 20.Seo I., Tseng S. H., Cula G. O., Bargo P. R., Kollias N., “Fluorescence spectroscopy for endogenous porphyrins in human facial skin,” Proc. SPIE 7161, 716103 (2009). 10.1117/12.811913 [DOI] [Google Scholar]
- 21.Wagnières G. A., Star W. M., Wilson B. C., “In vivo fluorescence spectroscopy and imaging for oncological applications,” Photochem. Photobiol. 68(5), 603–632 (1998). 10.1111/j.1751-1097.1998.tb02521.x [DOI] [PubMed] [Google Scholar]
- 22. Pratavieira S., Andrade C. T., Salvio A. G., Bagnato V. S., Kurachi C., “Optical Imaging as auxiliary tool in skin cancer diagnosis,” in Skin Cancers – Risk Factors, Prevention and Therapy, La Porta C. A. M., ed. (In tech, 2011). [Google Scholar]
- 23.Fang M., Yuan J., Peng C., Li Y., “Collagen as a double-edged sword in tumor progression,” Tumour Biol. 35(4), 2871–2882 (2014). 10.1007/s13277-013-1511-7 [DOI] [PMC free article] [PubMed] [Google Scholar]
- 24.Bliznakova I., Borisova E., Avramov L., “Autofluorescence spectroscopy of human skin in dependence on excitation wavelengths,” Acta Phys. Pol. A 112(5), 1131–1136 (2007). 10.12693/APhysPolA.112.1131 [DOI] [Google Scholar]
- 25.Ghervase L., Savastru D., Dontu S., Forsea A., Borisova E., “Characterization of human skin by fluorescence, exemplified by dermatofibroma, keratoacanthoma, and seborrheic keratosis,” Anal. Lett. 49(3), 342–349 (2016). 10.1080/00032719.2015.1036277 [DOI] [Google Scholar]


