

Today there are ~56 million horses worldwide, but nearly all of them are descendants of one stallion.
Abstract
Present-day domestic horses are immensely diverse in their maternally inherited mitochondrial DNA, yet they show very little variation on their paternally inherited Y chromosome. Although it has recently been shown that Y chromosomal diversity in domestic horses was higher at least until the Iron Age, when and why this diversity disappeared remain controversial questions. We genotyped 16 recently discovered Y chromosomal single-nucleotide polymorphisms in 96 ancient Eurasian stallions spanning the early domestication stages (Copper and Bronze Age) to the Middle Ages. Using this Y chromosomal time series, which covers nearly the entire history of horse domestication, we reveal how Y chromosomal diversity changed over time. Our results also show that the lack of multiple stallion lineages in the extant domestic population is caused by neither a founder effect nor random demographic effects but instead is the result of artificial selection—initially during the Iron Age by nomadic people from the Eurasian steppes and later during the Roman period. Moreover, the modern domestic haplotype probably derived from another, already advantageous, haplotype, most likely after the beginning of the domestication. In line with recent findings indicating that the Przewalski and domestic horse lineages remained connected by gene flow after they diverged about 45,000 years ago, we present evidence for Y chromosomal introgression of Przewalski horses into the gene pool of European domestic horses at least until medieval times.
INTRODUCTION
Present-day domestic horses are unique among livestock animals because of their almost complete lack of variability on the paternally inherited Y chromosome (1–5). In stark contrast to that, the maternally inherited mitochondrial DNA of horses shows huge variation (6–10). So far, only very few studies detected polymorphic Y chromosomal markers among modern horses, but these additional lineages seem to be derived from the ancestral domestic haplotype relatively recently (5) or were limited to a restricted geographical area (11).
The pattern of high maternal diversity combined with extremely reduced paternal variation is generally explained by unequal sex ratios at the beginning of domestication. Likely, a large number of mares but only few stallions contributed to founding the domestic horse population (2). However, further support for these discrepancies arose from continued sex-specific breeding enhancing the reproductive success of certain male lineages, particularly after the development of modern studs during the last few centuries (5). Recent ancient DNA (aDNA) analyses of paternal variation have detected the coexistence of multiple Y chromosomal haplotypes in pre–Iron Age and Iron Age domestic stallions, which suggests that Y chromosomal diversity was much larger in past than in present-day horse populations (12, 13). However, because of limited sampling efforts, these earlier studies could not capture the diachronical changes in paternal diversity.
To clarify how the domestication process of horses shaped the diversity of the Y chromosome, we genotyped 16 loci on the Y chromosome in 96 (out of a total of 350) archaeological remains (table S1), spread across Eurasia and spanning the last ~5000 years. This data set provides the first full time series of Y chromosomal variation from early domestication stages until the Middle Ages.
RESULTS AND DISCUSSION
To clarify how the domestication process of horses and the potential input of the Przewalski horse shaped the diversity of the horse Y chromosome, we successfully genotyped 16 single-nucleotide polymorphism (SNP) loci on the Y chromosome in 96 (out of a total of 350) archaeological horse remains (table S1), spread across Eurasia and spanning the last ~5000 years. In agreement with previous studies, the Y chromosome showed low genetic diversity, with only 4 of 16 SNPs being polymorphic, defining four haplotypes (table S2). In addition to the haplotypes exhibited by present-day domestic horses (Y-HT-1), we detected two new haplotypes (Y-HT-3 and Y-HT-4) characterized by two differences and one difference from the domestic haplotype, respectively (Fig. 1). Somewhat surprisingly, we also detected in several of the successfully genotyped aDNA samples the Przewalski horse haplotype (Y-HT-2), which differs at all four polymorphic positions from the present-day domestic haplotype.
Fig. 1. Stallion lineages through time.
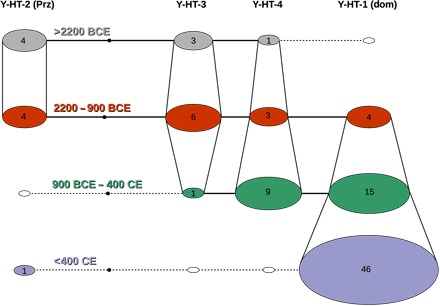
Temporal haplotype network of the four detected Y chromosome haplotypes. Age of the samples indicated by multiple layers separated by color; vertical lines connecting the haplotypes of consecutive layers/ages represent which haplotype was transferred into a later/younger period. Numbers constitute the respective number of individuals showing this particular haplotype for that period. Prz, Przewalski; Dom, domestic.
To detect patterns of temporal variation, we divided the samples into four different time bins based on archaeological periods (before 2200 BCE, 2200–900 BCE, 900 BCE–400 CE, and younger than 400 CE; Fig. 2). On the basis of these, we constructed a temporal haplotype network (Fig. 1) and simulated the haplotype frequencies over time (Fig. 3). All analyses show the reduction of Y chromosome variation through time, which is especially pronounced for haplotypes Y-HT-1 and Y-HT-4. Wild and early domestic horses from the Neolithic and Bronze Age (>900 BCE) display comparatively high variation, despite their smaller sample size (n = 9 and 17 in time bins 1 and 2 versus n = 24 and 46 in time bins 3 and 4; Fig. 2), with all four detected haplotypes occurring at relatively even frequency in the first two defined periods (~0.10 to 0.36; Fig. 3 and table S3). Moreover, among European horses, the haplotype representing modern Przewalski horses (Y-HT-2) was very abundant during the two older periods and even constitutes the most frequent one before 2200 BCE (oldest time bin). Haplotype Y-HT-1, on the other hand, which dominates in present-day stallions, was only detected later than 2200 BCE. Although its estimated age roughly correlates with the onset of domestication (3500 BCE; Fig. 4), this haplotype only started to become more frequent during later periods. All analyses indicate low Y-HT-1 frequency before 2200 BCE (fig. S1). However, the first time bin (>2200 BCE) only includes samples from Europe, with the easternmost samples falling on the longitude of the Black Sea (Fig. 2). Accordingly, Y-HT-1 could have been present with higher frequencies at that time in populations from further East. In the Iron Age (time bin 3, 900 BCE–400 CE), Y-HT-1 already represented the most frequent haplotype.
Fig. 2. Decline of paternal diversity began in Asia.
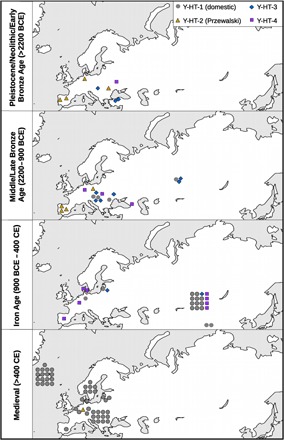
Maps displaying age, locality, and haplotype (different colors) of each successfully genotyped sample.
Fig. 3. The frequencies of Y chromosome haplotypes started to change during the Late Bronze Age (1600–900 BCE).
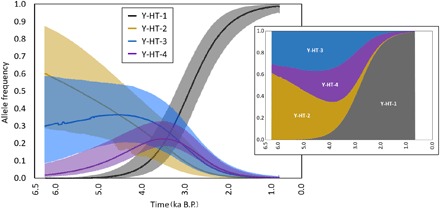
Inferred temporal trajectories of haplotype frequencies. Each haplotype is displayed by a different color. The shaded area represents the 95% highest-density region. The trajectories were constructed taking the median values across frequencies from the simulations of the Bayesian posterior sample. The small chart represents the stacked frequencies; the amplitude of each colored area is proportional to the median haplotype frequencies (normalized) at a given time. The x and y axes of the small chart match those in the large one. Ka, thousands of years.
Fig. 4. Positive selection for modern domestic haplotype leads to the decline of diversity.
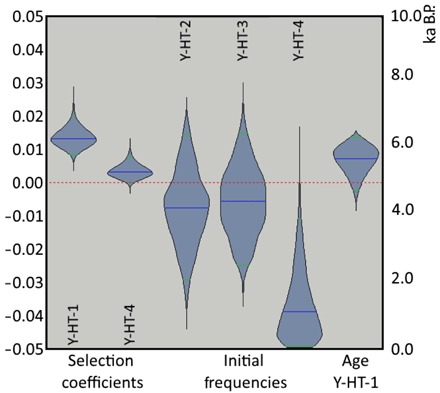
Violin plots of selection coefficients and initial haplotype frequencies, representing the posterior density functions of the selection coefficients of haplotypes Y-HT-1 and Y-HT-4, the age of Y-HT-1, and the initial haplotype frequencies of all haplotypes but Y-HT-1. The scale on the left is for the selection coefficients, whereas the scale on the right is for the age of Y-HT-1. The initial allele frequencies are on a scale from 0.0 (bottom) to 1.0 (top).
The first record of the modern domestic Y chromosome haplotype stems from two Bronze Age samples of similar age. Notably, both samples were found in two distantly located regions: present-day Slovakia (2000–1600 BCE, dated by archaeological context) and western Siberia (14C-dated: 1609–1436 cal. BCE). Although a very recent study proposes an oriental origin of this haplotype (14), we cannot determine the geographical origin of Y-HT-1 with certainty, because this haplotype has not been found thus far in predomestic or wild stallions. There are two possible scenarios: (i) Y-HT-1 emerged within the domestic population by mutation and (ii) Y-HT-1 was already present in wild horses and entered the domestic population either at the beginning of domestication (but initially restricted to Asian horses) or later by introgression (from wild Y-HT-1 carrying studs during the Iron Age). Crosses between domestic animals and their wild counterparts have been observed in several domestic species (15–18); thus, the simplest explanation would be that we missed Y-HT-1 in older samples because of limited geographical sampling. However, the estimated haplotype age is contemporary (Fig. 4) with the assumed starting point of horse domestication ~4000–3500 BCE (19), rendering it likely that Y-HT-1 originated within the domestic horse gene pool. Still, we cannot rule out definitively that it appeared before domestication.
Independent of its geographical origin, Y-HT-1 progressively replaced all other haplotypes—except for one additional lineage that is restricted to Yakutian horses (11). Considering our data, this trend in paternal diversity toward dominance of the modern lineage appears to start in the Bronze Age and becomes even more pronounced during the Iron Age. The Bronze Age was a time of large-scale human migrations across Eurasia (20–22), movements that were undoubtedly facilitated by the spread of horses as a means of transport and warfare. At that time, the western Eurasian steppes were inhabited by highly mobile cultures that largely relied on horses (20, 21, 23, 24). The genetic admixture of northern and central European humans with Caucasians/eastern Europeans did correlate with the spread of the Yamnaya culture from the Pontic-Caspian steppe (25), an area that has repeatedly been suggested as the center of horse domestication (19, 26, 27). Given the importance of domestic horses, it appears that deliberate selection/rejection of certain stallions by these people might have contributed to the loss of paternal diversity. The spread of humans out of this region might also have resulted in the spread of Y-HT-1 from Asia to Europe. This scenario also agrees with recent findings that the low male diversity of extant horses is not caused by recruiting only a limited number of stallions during early domestication (13).
To evaluate whether the observed changes in Y haplotype frequencies can be explained by drift or whether selection needs to be invoked, we applied several analyses. The different methods assumed different demographic scenarios. All methods consistently provided substantial statistical support for positive selection on Y-HT-1 (100% positive coefficients; Fig. 4 and fig. S3). Thus, it appears that deliberate breeding contributed to the loss of paternal diversity. This inference was also supported by our model choice analysis, which provided overwhelming support for the selection model (Bayes factor = 9.4 × 10¹¹) when compared to a pure drift model.
When we tested whether a temporally changing selection coefficient provided a better fit for the data, by assigning different coefficients to different periods, we found that one single coefficient for all periods obtained the best combined support of the Akaike information criterion (AIC) and the Bayesian information criterion (BIC) (fig. S4), suggesting that the selective forces acting upon haplotype Y-HT-1 did not change substantially over time.
In addition, we detected strong selection acting also on other Y chromosome haplotypes. Although values were highly positive for Y-HT-4 (98.2% of selection coefficients were positive), selection for Y-HT-2 and Y-HT-3 was significantly negative (100% of coefficients negative). Our analyses indicate that Y-HT-2 declined throughout the sampled time frame, Y-HT-3 initially remained constant and then declined, Y-HT-4 rose before 1500 BCE and subsequently decreased in frequency, and Y-HT-1 almost aggressively invaded the population until fixation (Fig. 3). The whole pattern, including the turnover of Y-HT-4, is best explained by positive selection on Y-HT-4 and even stronger positive selection on Y-HT-1 (Fig. 4).
Y-HT-1 rapidly replaced the already advantageous haplotype Y-HT-4, its most closely related lineage. With Y-HT-4 probably being older than Y-HT-1, it seems possible that the selective advantage of Y-HT-4 was retained in Y-HT-1, which then acquired its own additional advantageous mutations and, consequently, an even higher selective value. Such a situation, where younger haplotypes are under increasingly higher selection, could be a case of selective escalation. In this scenario, the Y-HT-1–specific mutations further improved the advantageous phenotype of Y-HT-4, allowing Y-HT-1 to invade the gene pool of domestic horses. The speed with which Y-HT-1 reached fixation supports this escalation hypothesis. Future research could focus on identifying genes that display nonsynonymous mutations shared only by Y-HT-1 and Y-HT-4 and investigating their phenotypic expression. Possible traits could well be phenotypically visible features because increasing evidence indicates that, in addition to spermatogenesis and male fertility, several diseases and physiological and behavioral traits in males are regulated by Y chromosomal genes (28); such Y-chromosome-associated traits could explain how early breeders chose the stallions they selected for breeding.
During the Iron Age, when Y-HT-1 started to obtain its dominating status, the Roman Empire was ruling Europe and its bordering regions. The Romans changed the mode of animal breeding in their territories by shifting the focus from female-based to male-based selective breeding (29). This change in animal husbandry should have raised the reproductive success of the few stallions selected for reproduction, increasing the frequency of their Y chromosomal lineages. Although we cannot exclude the possibility that animal husbandry and breeding lost their organization with the end of the Roman Empire, the fact that horses were basically fixed for Y-HT-1 already at the beginning of the Middle Ages would have prevented other haplotypes from rising again during medieval times.
The presence of the Y chromosome haplotype carried by present-day Przewalski horses (Y-HT-2) in early domestic stallions and a European wild horse (Pie05; table S2) could be the result of introgression of Przewalski stallions. Although the original distribution of the Przewalski horse is unknown, it was probably much larger than that of the relict population in Mongolia that produced modern Przewalski horses and might even have extended into Central Europe. However, it is also possible that either Przewalski horses were among the initially domesticated horses or that Y-HT-2 occurred both in Przewalski horses and in those wild horses that are the ancestors of domestic horses, based on autosomal DNA data (30). Regardless of how Y-HT-2 entered the domestic gene pool, it was eventually lost, as were all haplotypes except Y-HT-1. In our sample set, Y-HT-2 was undetectable as early as the third time bin. However, it is possible that Y-HT-2 may have been present during this time period, but with a frequency below 0.11 (with 95% probability). The inferred time trajectories for Y-HT-2 frequencies suggest that it could nevertheless have persisted at very low frequencies until the Middle Ages (Fig. 3). On the basis of these simulations, this finding could be interpreted as a relic of this haplotype’s formerly higher frequency in the domestic horse gene pool. It is also possible that the presence of this haplotype could be the result of mating a wild stallion with a domestic mare, a frequently reported breeding practice when wild horses were still widely distributed. However, a significant contribution of the Przewalski horse to the gene pool of modern domestic horses has been almost ruled out by recent genomic studies (13, 31, 32).
MATERIALS AND METHODS
Sample preparation, aDNA extraction, amplification, and sequencing
We analyzed 350 samples from China; Mongolia; Siberia; eastern, middle, and northern Europe; and the Iberian Peninsula (table S1). The ages of the samples range from the Neolithic/Copper Age to medieval times and were determined either by 14C-dating of the samples or by their archaeological context. DNA was extracted from 100- to 200-mg samples of bone or tooth in laboratories dedicated to aDNA analyses at the Leibniz Institute for Zoo and Wildlife Research (Ludwig Laboratory) in Berlin, Germany, following the standard procedures to avoid contamination. Independent replications were carried out in a different laboratory at the University of Potsdam (Hofreiter Laboratory), Germany. The tissue surfaces of all samples were removed by abrasion to minimize contamination. Samples were ground with a cryomill and incubated in 1 ml of extraction buffer [0.45 M EDTA, proteinase K (0.25 mg/ml) (pH 8.0)] overnight under rotation at 37°C. An initial scan for the sex of the samples was done by polymerase chain reaction (PCR) using sex-specific primers [see the study of Lippold et al. (12) for details] and subsequent visualization on an agarose gel. The following steps were conducted according to an optimized extraction protocol for short DNA fragments (33). All samples were analyzed for 16 previously published SNPs (12) amplified with 12 primer pairs (table S4). Multiplex PCRs were performed in 20-μl reactions using 4 μl of DNA extract and further containing 1× AmpliTaq Gold PCR buffer II (Applied Biosystems); 4 mM MgCl2; bovine serum albumin (1 mg/ml); 250 μM dATP (2′-deoxyadenosine 5′-triphosphate), dCTP (2′-deoxycytidine 5′-triphosphate), and dGTP (2′-deoxyguanosine 5′-triphosphate); 500 μM dUTP (deoxyuridine 5′-triphosphate); 150 nM of each primer; and 2 U of AmpliTaq Gold (Applied Biosystems). For each sample, one PCR was performed by adding 1 U of heat-labile uracil-DNA glycosylase and an initial incubation step of 15 min at 37°C to control for carryover contamination. Target regions were amplified with target-specific primer pairs that have been tagged with common sequence tags (CS1 and CS2, Fluidigm). After multiplex amplification, PCR products were sequenced using a combination of multiplexed Illumina MiSeq sequencing and traditional Sanger capillary electrophoresis. For Illumina sequencing, the amplicons were indexed using a maximum of 384 barcodes (containing Illumina adaptor sequences) in an additional amplification step and then pooled. To remove primer and adaptor dimers and other amplification products, we purified the multiplex PCR products using an AMPure PCR purification system (Agencourt) with a 1.8-fold ratio of SPRI (solid phase reversible immobilization) beads to reaction volume. The pooled and purified amplicon libraries were then sequenced on an Illumina MiSeq sequencer using CS1 and CS2 and their reverse complements as sequencing primers according to the manufacturer’s instructions. For a few samples, the PCR products were generated with the same target-specific primer pairs and then sequenced on the ABI 3130xl Genetic Analyzer by applying the BigDye Terminator v3.1 Cycle Sequencing Kit (Thermo Fisher Scientific).
Processing and alignment of sequencing data
Traditional Sanger sequences were edited and aligned in Geneious v8.1 (Biomatters). Illumina reads were automatically demultiplexed by the Illumina MiSeq software and further processed by applying the following steps. Illumina sequencing adaptors were cut from the reads using cutadapt (34), and reads were then filtered for quality with Trimmomatic 0.33 (35), discarding all reads that contain more than 8 base pairs (bp) with a Phred score below 20 and allowing only reads with a minimum length of 50 bp. The trimmed and filtered paired-end reads were merged to a single read with FLASH (36), improving the overall quality. Using Bowtie 2 (37) and SAMtools 0.1.19 (38), these merged reads were mapped to the reference sequences (G72335.1, G72336.1, G72338.1, G72339.1, and AB091794.1) for the respective target regions. For each sample and locus, a consensus sequence was generated in Geneious v8.1 (Biomatters) from which the genotype of the Y chromosomal SNPs could be deduced. With these, SNP haplotype frequencies were calculated using the R package “pegas” v0.8-1 (39). To visualize the detected haplotypes during the different time periods, we constructed a heterochronous parsimony network using the R-script TempNet (40). We also tested for temporal changes in haplotype frequencies among four time bins (before 2200 BCE, 2200–900 BCE, 900 BCE–400 CE, and younger than 400 CE) by means of a temporal test of allele frequencies (41).
Statistical analysis
We applied the sequential Markov Chain Monte Carlo (S-MCMC) method reported by Wutke et al. (42, 43) to estimate coefficients of selection that historically acted upon the Y chromosome haplotypes in horses. This method performs statistical inference by using computer simulations in a Bayesian MCMC framework. The use of simulations allowed taking into account the uncertainties associated to radiocarbon or stratigraphic ages of the ancient samples, sampling error, generation time, population sizes, and the change of generation, which was modeled by a Wright-Fisher model (42, 43). Following previous work (8, 10, 19), the simulations also incorporated a growth in the horse population that started with the onset of domestication as in the studies of Wutke et al. (42, 43), but effective population sizes (Ne’s) and generation time were considered noise variables because of limited information in the data for estimating them. We tested alternative demographic histories with no population growth and an ample range of Ne values. Therefore, the estimated parameters were the selection coefficients, the age of the Y-HT-1 haplotype, and, alternatively, its initial haplotype frequency (see below). The simulations incorporated two alternative models addressing the initial state of Y-HT-1: (i) It was forced to be present since the beginning of the simulated time frame at a frequency that was a parameter or (ii) it was allowed to occur, emulating its appearance by mutation, at some point between the beginning of the simulated time frame and its first detection (the age became the parameter here). Both models were compared by means of Bayes factors. The MCMC was run under a Metropolis-Hasting algorithm incorporating a Gibbs sampler. The priors and details of the S-MCMC procedure followed those by Wutke et al. (42, 43). We ran four chains, 500,000 steps each, with a burn-in of 50%. We also replicated the estimation of selection coefficients by means of approximate Bayesian computation (44) and the path augmentation method (45). The statistical significance of the selection coefficients was assessed by obtaining the proportion of positive or negative values in the Bayesian posterior sample, for example, >95% of coefficients being positive could be interpreted as “significant” in a one-tailed test, and the same for negative values. In addition, we obtained Bayes factors for comparing a model with no selection (changes provided only by gene drift) and the model with selection upon Y-HT-1. Because selective forces might have changed over time (46), we performed a model choice analysis for selecting the number of time bins (with different selection coefficient each) that best fitted our data in the S-MCMC analysis. We tested from one to six time bins by means of both the AIC and the BIC. Time bins were defined considering main historical ages and sample sizes. In addition, considering that other haplotypes could be under selection, we replicated the inference by S-MCMC in a multiallelic mode, in which Wright-Fisher simulations were performed by multinomial, rather than binomial, samplings and several haplotypes were allowed to show selection. We assessed the number of haplotypes with signs of selection by means of AIC and BIC. Finally, we reported the temporal trajectories of haplotype frequencies of the Bayesian posterior sample to assess the changes in frequencies over time. The simulations were programmed in the language Fortran by means of the platform Microsoft Visual Studio and Intel Parallel Studio, using the code reported by Wutke et al. (42, 43), which is available at www.dropbox.com/sh/uns1gsprj7xbbzo/AAAEr4hfya16P5nejpXVVnUfa?dl=0.
Supplementary Material
Acknowledgments
We thank J. H. Hallsson and A. H. Pálsdóttir for providing Icelandic samples, D. Lieckfeldt and M. Pruvost for laboratory assistance, and D. Lenz for helping with next-generation sequencing data analyses. Funding: This work was funded by the Deutsche Forschungsgemeinschaft (LU 852/7-4). A.M.-M.’s research benefited from funding by projects HAR2014-55722-P and HAR2017-88325-P of the Spanish Ministry of Economy, Industry, and Competitiveness. A.-S.M. was financed by European Research Council (starting grant) and the Swiss National Science Foundation (Ambizione grant). Author contributions: A.L. designed the study. A.L., M.H., N.B., and M.R. planned the project. A.L., M.R., and S.W. designed the experiments. S.W. conducted the experiments. J.G. and A.T. performed replications. H.-J.D., S.F., L.L., O.M., A.M.-M., and L.O. provided samples, data, and information about the archeological/historical context. E.S.-C. and A.-S.M. ran statistical analyses. A.L., E.S.-C., S.W., and M.H. wrote the draft. All authors contributed to writing the final manuscript. Competing interests: The authors declare that they have no competing interests. Data and materials availability: The code used for simulation calculations is available at www.dropbox.com/sh/uns1gsprj7xbbzo/AAAEr4hfya16P5nejpXVVnUfa?dl=0. All data needed to evaluate the conclusions in the paper are present in the paper and/or the Supplementary Materials. Additional data related to this paper may be requested from the authors.
SUPPLEMENTARY MATERIALS
Supplementary material for this article is available at http://advances.sciencemag.org/cgi/content/full/4/4/eaap9691/DC1
table S1. Additional information for all samples analyzed in this study.
table S2. Genotyping results of Y chromosomal SNPs for successfully genotyped samples.
table S3. Test of temporal changes in allele frequencies between the four time bins.
table S4. Settings and operators of the MCMC procedure used for the final inference of selection coefficients and other parameters.
fig. S1. Y-HT-1 showed very low allele frequency in early domestic horses.
fig. S2. The three simulation approaches concur regarding a low initial Y-HT-1 frequency.
fig. S3. All analyses yield strong support for positive selection of Y-HT-1.
fig. S4. One selection coefficient for Y-HT-1 across all time periods was mostly supported.
fig. S5. Several Y chromosome haplotypes were under selection.
REFERENCES AND NOTES
- 1.Wallner B., Brem G., Müller M., Achmann R., Fixed nucleotide differences on the Y chromosome indicate clear divergence between Equus przewalskii and Equus caballus. Anim. Genet. 34, 453–456 (2003). [DOI] [PubMed] [Google Scholar]
- 2.Lindgren G., Backström N., Swinburne J., Hellborg L., Einarsson A., Sandberg K., Cothran G., Vilà C., Binns M., Ellegren H., Limited number of patrilines in horse domestication. Nat. Genet. 36, 335–336 (2004). [DOI] [PubMed] [Google Scholar]
- 3.Wallner B., Piumi F., Brem G., Müller M., Achmann R., Isolation of Y chromosome-specific microsatellites in the horse and cross-species amplification in the genus Equus. J. Hered. 95, 158–164 (2004). [DOI] [PubMed] [Google Scholar]
- 4.Lau A. N., Peng L., Goto H., Chemnick L., Ryder O. A., Makova K. D., Horse domestication and conservation genetics of Przewalski’s horse inferred from sex chromosomal and autosomal sequences. Mol. Biol. Evol. 26, 199–208 (2009). [DOI] [PubMed] [Google Scholar]
- 5.Wallner B., Vogl C., Shukla P., Burgstaller J. P., Druml T., Brem G., Identification of genetic variation on the horse Y chromosome and the tracing of male founder lineages in modern breeds. PLOS ONE 8, e60015 (2013). [DOI] [PMC free article] [PubMed] [Google Scholar]
- 6.Vilà C., Leonard J. A., Götherström A., Marklund S., Sandberg K., Lidén K., Wayne R. K., Ellegren H., Widespread origins of domestic horse lineages. Science 291, 474–477 (2001). [DOI] [PubMed] [Google Scholar]
- 7.Jansen T., Forster P., Levine M. A., Oelke H., Hurles M., Renfrew C., Weber J., Olek K., Mitochondrial DNA and the origins of the domestic horse. Proc. Natl. Acad. Sci. U.S.A. 99, 10905–10910 (2002). [DOI] [PMC free article] [PubMed] [Google Scholar]
- 8.Cieslak M., Pruvost M., Benecke N., Hofreiter M., Morales A., Reissmann M., Ludwig A., Origin and history of mitochondrial DNA lineages in domestic horses. PLOS ONE 5, e15311 (2010). [DOI] [PMC free article] [PubMed] [Google Scholar]
- 9.Lippold S., Matzke N. J., Reissmann M., Hofreiter M., Whole mitochondrial genome sequencing of domestic horses reveals incorporation of extensive wild horse diversity during domestication. BMC Evol. Biol. 11, 328 (2011). [DOI] [PMC free article] [PubMed] [Google Scholar]
- 10.Achilli A., Olivieri A., Soares P., Lancioni H., Hooshiar Kashani B., Perego U. A., Nergadze S. G., Carossa V., Santagostino M., Capomaccio S., Felicetti M., Al-Achkar W., Penedo M. C. T., Verini-Supplizi A., Houshmand M., Woodward S. R., Semino O., Silvestrelli M., Giulotto E., Pereira L., Bandelt H.-J., Torroni A., Mitochondrial genomes from modern horses reveal the major haplogroups that underwent domestication. Proc. Natl. Acad. Sci. U.S.A. 109, 2449–2454 (2012). [DOI] [PMC free article] [PubMed] [Google Scholar]
- 11.Librado P., Der Sarkissian C., Ermini L., Schubert M., Jónsson H., Albrechtsen A., Fumagalli M., Yang M. A., Gamba C., Seguin-Orlando A., Mortensen C. D., Petersen B., Hoover C. A., Lorente-Galdos B., Nedoluzhko A., Boulygina E., Tsygankova S., Neuditschko M., Jagannathan V., Thèves C., Alfarhan A. H., Alquraishi S. A., Al-Rasheid K. A. S., Sicheritz-Ponten T., Popov R., Grigoriev S., Alekseev A. N., Rubin E. M., McCue M., Rieder S., Leeb T., Tikhonov A., Crubézy E., Slatkin M., Marques-Bonet T., Nielsen R., Willerslev E., Kantanen J., Prokhortchouk E., Orlando L., Tracking the origins of Yakutian horses and the genetic basis for their fast adaptation to subarctic environments. Proc. Natl. Acad. Sci. U.S.A. 112, E6889–E6897 (2015). [DOI] [PMC free article] [PubMed] [Google Scholar]
- 12.Lippold S., Knapp M., Kuznetsova T., Leonard J. A., Benecke N., Ludwig A., Rasmussen M., Cooper A., Weinstock J., Willerslev E., Shapiro B., Hofreiter M., Discovery of lost diversity of paternal horse lineages using ancient DNA. Nat. Commun. 2, 450 (2011). [DOI] [PubMed] [Google Scholar]
- 13.Librado P., Gamba C., Gaunitz C., Der Sarkissian C., Pruvost M., Albrechtsen A., Fages A., Khan N., Schubert M., Jagannathan V., Serres-Armero A., Kuderna L. F. K., Povolotskaya I. S., Seguin-Orlando A., Lepetz S., Neuditschko M., Thèves C., Alquraishi S., Alfarhan A. H., Al-Rasheid K., Rieder S., Samashev Z., Francfort H.-P., Benecke N., Hofreiter M., Ludwig A., Keyser C., Marques-Bonet T., Ludes B., Crubézy E., Leeb T., Willerslev E., Orlando L., Ancient genomic changes associated with domestication of the horse. Science 356, 442–445 (2017). [DOI] [PubMed] [Google Scholar]
- 14.Mona S., Catalano G., Lari M., Larson G., Boscato P., Casoli A., Sineo L., Di Patti C., Pecchioli E., Caramelli D., Bertorelle G., Population dynamic of the extinct European aurochs: Genetic evidence of a north-south differentiation pattern and no evidence of post-glacial expansion. BMC Evol. Biol. 10, 83 (2010). [DOI] [PMC free article] [PubMed] [Google Scholar]
- 15.Eriksson J., Larson G., Gunnarsson U., Bed’hom B., Tixier-Boichard M., Strömstedt L., Wright D., Jungerius A., Vereijken A., Randi E., Jensen P., Andersson L., Identification of the yellow skin gene reveals a hybrid origin of the domestic chicken. PLOS Genet. 4, e1000010 (2008). [DOI] [PMC free article] [PubMed] [Google Scholar]
- 16.Hanotte O., Bradley D. G., Ochieng J. W., Verjee Y., Hill E. W., Rege J. E. O., African pastoralism: Genetic imprints of origins and migrations. Science 296, 336–339 (2002). [DOI] [PubMed] [Google Scholar]
- 17.Verkaar E. L. C., Nijman I. J., Beeke M., Hanekamp E., Lenstra J. A., Maternal and paternal lineages in cross-breeding bovine species. Has wisent a hybrid origin? Mol. Biol. Evol. 21, 1165–1170 (2004). [DOI] [PubMed] [Google Scholar]
- 18.Outram A. K., Stear N. A., Bendrey R., Olsen S., Kasparov A., Zaibert V., Thorpe N., Evershed R. P., The earliest horse harnessing and milking. Science 323, 1332–1335 (2009). [DOI] [PubMed] [Google Scholar]
- 19.Wallner B., Palmieri N., Vogl C., Rigler D., Bozlak E., Druml T., Jagannathan V., Leeb T., Fries R., Tetens J., Thaller G., Metzger J., Distl O., Lindgren G., Rubin C.-J., Andersson L., Schaefer R., McCue M., Neuditschko M., Rieder S., Schlötterer C., Brem G., Y chromosome uncovers the recent oriental origin of modern stallions. Curr. Biol. 27, 2029–2035.e5 (2017). [DOI] [PubMed] [Google Scholar]
- 20.D. W. Anthony, The Horse, The Wheel, and Language: How Bronze-Age Riders from the Eurasian Steppes Shaped the Modern World (Princeton Univ. Press, 2007). [Google Scholar]
- 21.K. Kristiansen, T. B. Larsson, The Rise of Bronze Age Society: Travels, Transmissions and Transformations (Cambridge Univ. Press, 2005). [Google Scholar]
- 22.Gamba C., Jones E. R., Teasdale M. D., McLaughlin R. L., Gonzalez-Fortes G., Mattiangeli V., Domboróczki L., Kővári I., Pap I., Anders A., Whittle A., Dani J., Raczky P., Higham T. F. G., Hofreiter M., Bradley D. G., Pinhasi R., Genome flux and stasis in a five millennium transect of European prehistory. Nat. Commun. 5, 5257 (2014). [DOI] [PMC free article] [PubMed] [Google Scholar]
- 23.P. Kelekna, The Horse in Human History (Cambridge Univ. Press, 2009). [Google Scholar]
- 24.Kuznetsov P. F., The emergence of Bronze Age chariots in eastern Europe. Antiquity 80, 638–645 (2006). [Google Scholar]
- 25.Allentoft M. E., Sikora M., Sjogren K.-G., Rasmussen S., Rasmussen M., Stenderup J., Damgaard P. B., Schroeder H., Ahlström T., Vinner L., Malaspinas A.-S., Margaryan A., Higham T., Chivall D., Lynnerup N., Harvig L., Baron J., Della Casa P., Dąbrowski P., Duffy P. R., Ebel A. V., Epimakhov A., Frei K., Furmanek M., Gralak T., Gromov A., Gronkiewicz S., Grupe G., Hajdu T., Jarysz R., Khartanovich V., Khokhlov A., Kiss V., Kolář J., Kriiska A., Lasak I., Longhi C., McGlynn G., Merkevicius A., Merkyte I., Metspalu M., Mkrtchyan R., Moiseyev V., Paja L., Pálfi G., Pokutta D., Pospieszny Ł., Price T. D., Saag L., Sablin M., Shishlina N., Smrčka V., Soenov V. I., Szeverényi V., Tóth G., Trifanova S. V., Varul L., Vicze M., Yepiskoposyan L., Zhitenev V., Orlando L., Sicheritz-Pontén T., Brunak S., Nielsen R., Kristiansen K., Willerslev E., Population genomics of Bronze Age Eurasia. Nature. 522, 167–172 (2015). [DOI] [PubMed] [Google Scholar]
- 26.Warmuth V., Eriksson A., Bower M. A., Barker G., Barrett E., Hanks B. K., Li S., Lomitashvili D., Ochir-Goryaeva M., Sizonov G. V., Soyonov V., Manica A., Reconstructing the origin and spread of horse domestication in the Eurasian steppe. Proc. Natl. Acad. Sci. U.S.A. 109, 8202–8206 (2012). [DOI] [PMC free article] [PubMed] [Google Scholar]
- 27.S. L. Olsen, Early horse domestication on the Eurasian steppe, in Documenting Domestication, New Genetic and Archaeological Paradigms, M. A. Zeder, D. G. Bradley, E. Emshwiller, B. D. Smith, Eds. (University Presses of California, 2006), pp. 245–272. [Google Scholar]
- 28.Case L. K., Teuscher C., Y genetic variation and phenotypic diversity in health and disease. Biol. Sex Differ. 6, 6 (2015). [DOI] [PMC free article] [PubMed] [Google Scholar]
- 29.J. Peters, Römische Tierhaltung und Tierzucht: eine Synthese aus archäozoologischer Untersuchung und schriftlich-bildlicher Überlieferung (Leidorf, 1998), vol. 5. [Google Scholar]
- 30.Gaunitz C., Fages A., Hanghøj K., Albrechtsen A., Khan N., Schubert M., Seguin-Orlando A., Owens I. J., Felkel S., Bignon-Lau O., de Barros Damgaard P., Mittnik A., Mohaseb A. F., Davoudi H., Alquraishi S., Alfarhan A. H., Al-Rasheid K. A. S., Crubézy E., Benecke N., Olsen S., Brown D., Anthony D., Massy K., Pitulko V., Kasparov A., Brem G., Hofreiter M., Mukhtarova G., Baimukhanov N., Lõugas L., Onar V., Stockhammer P. W., Krause J., Boldgiv B., Undrakhbold S., Erdenebaatar D., Lepetz S., Mashkour M., Ludwig A., Wallner B., Merz V., Merz I., Zaibert V., Willerslev E., Librado P., Outram A. K., Orlando L., Ancient genomes revisit the ancestry of domestic and Przewalski’s horses. Science 360, 111–114 (2018). [DOI] [PubMed] [Google Scholar]
- 31.Der Sarkissian C., Ermini L., Schubert M., Yang M. A., Librado P., Fumagalli M., Jónsson H., Bar-Gal G. K., Albrechtsen A., Vieira F. G., Petersen B., Ginolhac A., Seguin-Orlando A., Magnussen K., Fages A., Gamba C., Lorente-Galdos B., Polani S., Steiner C., Neuditschko M., Jagannathan V., Feh C., Greenblatt C. L., Ludwig A., Abramson N. I., Zimmermann W., Schafberg R., Tikhonov A., Sicheritz-Ponten T., Willerslev E., Marques-Bonet T., Ryder O. A., McCue M., Rieder S., Leeb T., Slatkin M., Orlando L., Evolutionary genomics and conservation of the endangered Przewalski’s horse. Curr. Biol. 25, 2577–2583 (2015). [DOI] [PMC free article] [PubMed] [Google Scholar]
- 32.Goto H., Ryder O. A., Fisher A. R., Schultz B., Kosakovsky Pond S. L., Nekrutenko A., Makova K. D., A massively parallel sequencing approach uncovers ancient origins and high genetic variability of endangered Przewalski’s horses. Genome Biol. Evol. 3, 1096–1106 (2011). [DOI] [PMC free article] [PubMed] [Google Scholar]
- 33.Dabney J., Knapp M., Glocke I., Gansauge M.-T., Weihmann A., Nickel B., Valdiosera C., García N., Pääbo S., Arsuaga J.-L., Meyer M., Complete mitochondrial genome sequence of a Middle Pleistocene cave bear reconstructed from ultrashort DNA fragments. Proc. Natl. Acad. Sci. U.S.A. 110, 15758–15763 (2013). [DOI] [PMC free article] [PubMed] [Google Scholar]
- 34.Martin M., Cutadapt removes adapter sequences from high-throughput sequencing reads. EMBnet.journal 17, 10–12 (2011). [Google Scholar]
- 35.Bolger A. M., Lohse M., Usadel B., Trimmomatic: A flexible trimmer for Illumina sequence data. Bioinformatics 30, 2114–2120 (2014). [DOI] [PMC free article] [PubMed] [Google Scholar]
- 36.Magoč T., Salzberg S. L., FLASH: Fast length adjustment of short reads to improve genome assemblies. Bioinformatics 27, 2957–2963 (2011). [DOI] [PMC free article] [PubMed] [Google Scholar]
- 37.Langmead B., Salzberg S. L., Fast gapped-read alignment with Bowtie 2. Nat. Methods 9, 357–359 (2012). [DOI] [PMC free article] [PubMed] [Google Scholar]
- 38.Li H., Handsaker B., Wysoker A., Fennell T., Ruan J., Homer N., Marth G., Abecasis G., Durbin R. 1000 Genome Project Data Processing Subgroup , The sequence alignment/map format and SAMtools. Bioinformatics 25, 2078–2079 (2009). [DOI] [PMC free article] [PubMed] [Google Scholar]
- 39.Paradis E., pegas: An R package for population genetics with an integrated–modular approach. Bioinformatics. 26, 419–420 (2010). [DOI] [PubMed] [Google Scholar]
- 40.Prost S., Anderson C. N. K., TempNet: A method to display statistical parsimony networks for heterochronous DNA sequence data. Methods Ecol. Evol. 2, 663–667 (2011). [Google Scholar]
- 41.Sandoval-Castellanos E., Testing temporal changes in allele frequencies: A simulation approach. Genet. Res. 92, 309–320 (2010). [DOI] [PubMed] [Google Scholar]
- 42.Wutke S., Andersson L., Benecke N., Sandoval-Castellanos E., Gonzalez J., Hallsson J. H., Lõugas L., Magnell O., Morales-Muniz A., Orlando L., Pálsdóttir A. H., Reissmann M., Muñoz-Rodríguez M. B., Ruttkay M., Trinks A., Hofreiter M., Ludwig A., The origin of ambling horses. Curr. Biol. 26, R697–R699 (2016). [DOI] [PubMed] [Google Scholar]
- 43.Wutke S., Benecke N., Sandoval-Castellanos E., Döhle H.-J., Friederich S., Gonzalez J., Hallsson J. H., Hofreiter M., Lõugas L., Magnell O., Morales-Muniz A., Orlando L., Pálsdóttir A. H., Reissmann M., Ruttkay M., Trinks A., Ludwig A., Spotted phenotypes in horses lost attractiveness in the Middle Ages. Sci. Rep. 6, 38548 (2016). [DOI] [PMC free article] [PubMed] [Google Scholar]
- 44.Beaumont M. A., Approximate Bayesian computation in evolution and ecology. Annu. Rev. Ecol. Evol. Syst. 41, 379–406 (2010). [Google Scholar]
- 45.Schraiber J. G., Evans S. N., Slatkin M., Bayesian inference of natural selection from allele frequency time series. Genetics 203, 493–511 (2016). [DOI] [PMC free article] [PubMed] [Google Scholar]
- 46.Ludwig A., Reissmann M., Benecke N., Bellone R., Sandoval-Castellanos E., Cieslak M., Fortes G. G., Morales-Muñiz A., Hofreiter M., Pruvost M., Twenty-five thousand years of fluctuating selection on leopard complex spotting and congenital night blindness in horses. Philos. Trans. R. Soc. Lond. B Biol. Sci. 370, 20130386 (2015). [DOI] [PMC free article] [PubMed] [Google Scholar]
Associated Data
This section collects any data citations, data availability statements, or supplementary materials included in this article.
Supplementary Materials
Supplementary material for this article is available at http://advances.sciencemag.org/cgi/content/full/4/4/eaap9691/DC1
table S1. Additional information for all samples analyzed in this study.
table S2. Genotyping results of Y chromosomal SNPs for successfully genotyped samples.
table S3. Test of temporal changes in allele frequencies between the four time bins.
table S4. Settings and operators of the MCMC procedure used for the final inference of selection coefficients and other parameters.
fig. S1. Y-HT-1 showed very low allele frequency in early domestic horses.
fig. S2. The three simulation approaches concur regarding a low initial Y-HT-1 frequency.
fig. S3. All analyses yield strong support for positive selection of Y-HT-1.
fig. S4. One selection coefficient for Y-HT-1 across all time periods was mostly supported.
fig. S5. Several Y chromosome haplotypes were under selection.