

Summary
Background
Sub-Saharan Africa has the highest incidence, prevalence, and fatality from stroke globally. Yet, only little information about context-specific risk factors for prioritising interventions to reduce the stroke burden in sub-Saharan Africa is available. We aimed to identify and characterise the effect of the top modifiable risk factors for stroke in sub-Saharan Africa.
Methods
The Stroke Investigative Research and Educational Network (SIREN) study is a multicentre, case-control study done at 15 sites in Nigeria and Ghana. Cases were adults (aged ≥18 years) with stroke confirmed by CT or MRI. Controls were age-matched and gender-matched stroke-free adults (aged ≥18 years) recruited from the communities in catchment areas of cases. Comprehensive assessment for vascular, lifestyle, and psychosocial factors was done using standard instruments. We used conditional logistic regression to estimate odds ratios (ORs) and population-attributable risks (PARs) with 95% CIs.
Findings
Between Aug 28, 2014, and June 15, 2017, we enrolled 2118 case-control pairs (1192 [56%] men) with mean ages of 59.0 years (SD 13.8) for cases and 57.8 years (13.7) for controls. 1430 (68%) had ischaemic stoke, 682 (32%) had haemorrhagic stroke, and six (<1%) had discrete ischaemic and haemorrhagic lesions. 98.2% (95% CI 97.2–99.0) of adjusted PAR of stroke was associated with 11 potentially modifiable risk factors with ORs and PARs in descending order of PAR of 19.36 (95% CI 12.11–30.93) and 90.8% (95% CI 87.9–93.7) for hypertension, 1.85 (1.44–2.38) and 35.8% (25.3–46.2) for dyslipidaemia, 1.59 (1.19–2.13) and 31.1% (13.3–48.9) for regular meat consumption, 1.48 (1.13–1.94) and 26.5% (12.9–40.2) for elevated waist-to-hip ratio, 2.58 (1.98–3.37) and 22.1% (17.8–26.4) for diabetes, 2.43 (1.81–3.26) and 18.2% (14.1–22.3) for low green leafy vegetable consumption, 1.89 (1.40–2.54) and 11.6% (6.6–16.7) for stress, 2.14 (1.34–3.43) and 5.3% (3.3–7.3) for added salt at the table, 1.65 (1.09–2.49) and 4.3% (0.6–7.9) for cardiac disease, 2.13 (1.12–4.05) and 2.4% (0.7–4.1) for physical inactivity, and 4.42 (1.75–11.16) and 2.3% (1.5–3.1) for current cigarette smoking. Ten of these factors were associated with ischaemic stroke and six with haemorrhagic stroke occurrence.
Interpretation
Implementation of interventions targeting these leading risk factors at the population level should substantially curtail the burden of stroke among Africans.
Funding
National Institutes of Health.
Introduction
Stroke remains a leading cause of long-term disability and the second most common cause of death worldwide.1–3 Global estimates of stroke burden suggest that sub-Saharan Africa has the highest incidence (age-standardised incidence 316 per 100000 people per year),4 prevalence (age-adjusted prevalence of up to 14.6 per 1000 people),5 and case fatality (up to 43% at 1 month and 84% at 3 years).6,7
The Global Burden of Disease (GBD) Study8 showed regional variation in risk factors for stroke worldwide, and explored risk factors for stroke among Africans using a meta-analysis of the small amount of data available. INTERSTROKE,9 the largest case-control study on stroke so far, also reported regional differences in stroke types and leading risk factors globally. However, no significant association was found between stroke and important risk factors such as diabetes, cigarette smoking, physical inactivity, and dietary and psychosocial factors among Africans in INTERSTROKE,9 probably because of the small representation of Africans. A Tanzanian community-based study10 investigated risk factors for stroke among Africans, but had 200 participants, of whom only 40% had neuroimaging to confirm stroke. Thus, the dominant risk factors for stroke and its subtypes in Africans are not yet clearly established.
Low-income and middle-income countries in Africa, have scant resources for acute care and rehabilitation.1–7 Hence, the most plausible strategy to reduce the burden of stroke in Africans is comprehensive and pragmatic preventive efforts targeted at its dominant risk factors.11 We aimed to examine and quantify the contributions of the top modifiable risk factors for stroke among Africans within the context of the Stroke Investigative Research and Educational Network (SIREN) study,12 the largest study of stroke in Africa so far.
Methods
Study design
The SIREN study is a multicentre, case-control study done at 15 sites in Ghana and Nigeria (appendix). The study protocol has been published previously.12 Briefly, stroke cases were consecutive consenting (in unconscious or aphasic patients, consent was obtained from next of kin) adults (aged ≥18 years) with a first clinical stroke within 8 days of current symptom onset or last seen without deficit, with neuroimaging confirmation on CT or MRI scan within 10 days of symptom onset. Exclusion criteria are listed in the appendix.
Although patients with stroke were recruited from hospitals to ensure rapid and accurate phenotyping, a robust community engagement core incorporated community sensitisation programmes to enhance early presentation at SIREN study hospitals and minimise referral bias.12 To minimise investigation bias, costs of neuroimaging, electrocardiography (ECG), echocardiography, carotid doppler, glycated haemoglobin A1c (HbA1c) testing, and lipid profiling were covered for all eligible patients who could not afford these procedures. Ghana has universal health coverage.
Controls were consenting stroke-free adults (aged ≥18 years), mostly from the communities in the catchment areas of the SIREN study hospitals where cases were recruited, while some were recruited from the study hospitals. Stroke-free status was confirmed with the eight-item Questionnaire for Verifying Stroke-Free Status (QVSFS), which had 98% negative predictive value in a validation study involving three major languages spoken in west Africa (Ashanti, Yoruba, and Hausa).13 Controls were matched by age (within 5 years), sex, and ethnicity to minimise the potential confounding effect of these variables on the relationship between stroke and its risk factors. Ethical approval was obtained from all study sites and informed consent was obtained from all participants before enrolment.12
Stroke phenotyping
Stroke phenotyping was based on clinical assessment and brain neuroimaging (CT or MRI), ECG, transthoracic echocardiography, and carotid doppler ultrasound done in accordance with standard operating procedures. Ischaemic stroke was typed clinically with the Oxfordshire Community Stroke Project (OCSP) criteria14 and presumed causative subtypes were defined using the Trial of Org 10172 in Acute Stroke Treatment (TOAST)15 and the Atherosclerosis, Small vessel disease, Cardiac source, and Other (ASCO)16 criteria. Intracerebral haemorrhage was classified causatively into structural, medication-related, amyloid angiopathy, systemic/other disease, hypertension, and undetermined causes (SMASH-U; appendix).17
Data collection
We collected basic demographic and lifestyle data including ethnic origin of the participants and their parents, socioeconomic status, cardiovascular risk profile, and dietary patterns. We used validated instruments to assess physical inactivity, stress, depression, cigarette smoking, and alcohol use while minimising potential biases (appendix).18 Using uniform standard operating procedures across all study sites, we collected blood samples for HbA1c and early morning samples after an overnight fast in cases (after the acute phase when fasting is feasible) and controls for fasting blood glucose and fasting lipid profile (total cholesterol, LDL cholesterol, HDL cholesterol, and triglyceride).
Definitions of risk factors
Blood pressure (mean of three measurements) was recorded at baseline and daily for 7 days or until death. A cutoff of at least 140/90 mm Hg for up to 72 h after stroke, a history of hypertension, or use of antihypertensive drugs before stroke or more than 72 h after stroke were regarded as indicators of hypertension. Adjustments to systolic blood pressure based on reported associations between premorbid blood pressure and acute post-stroke blood pressure in the Oxford Vascular Study (OXVASC)19 were also applied in sensitivity analyses. Hypertension in controls was defined as self-reported history of hypertension or use of antihypertensive drugs, or mean blood pressure at first clinical encounter of at least 140/90 mm Hg.18
Diabetes was defined in controls as a history of diabetes, use of drugs for diabetes, or a fasting blood glucose concentration greater than 7.0 mmol/L at first encounter. In cases, diabetes was defined as a history of diabetes, use of drugs for diabetes, an HbA1c more than 6.5%, or a fasting blood glucose concentration greater than 7.0 mmol/L measured after the post-acute phase because of the known acute transient elevation of glucose as a stress response after stroke.20
Dyslipidaemia was defined as a fasting total cholesterol concentration of at least 5.2 mmol/L, HDL cholesterol 1.03 mmol/L or lower, triglyceride at least 1.7 mmol/L, or LDL cholesterol at least 3.4 mmol/L according to National Cholesterol Education Program guidelines,21 or use of statin before stroke onset. Based on distribution of the LDL:HDL ratio in the present study, the LDL:HDL ratio was dichotomised using the lowest two tertiles (≤2.00 and 2.01–2.96) as normal versus the highest tertile (≥2.97) as high.
Cardiac disease was defined after assessment by study cardiologists as a history or current diagnosis of atrial fibrillation, cardiomyopathy, heart failure, ischaemic heart disease, rheumatic heart disease, or valvular heart diseases.
For obesity, we assessed both waist-to-hip ratio and body-mass index (BMI). Participants were classified individually either using the WHO guidelines with cutoffs of 0.90 (men) and 0.85 (women) for waist-to-hip ratio or 30 kg/m2 for BMI (obesity).22 We categorised waist-to-hip ratio into thirds corresponding to low risk (≤0.90), moderate risk (0.91–0.96), and high risk (≥0.97) using the tertiles obtained from controls. Individuals were classified as physically active if they were regularly involved in moderate exercise (walking, cycling, or gardening) or strenuous exercise (jogging, football, and vigorous swimming) for 4 h or more per week.8
Dietary history included regularity of intake of food items such as meat, fish, green leafy vegetables, nuts, sugar, and other local staple food items, and addition of salt at the table. Regular intake was defined as intake daily, weekly, or at least once per month versus none in a month.
Alcohol users were categorised into current users (users of any form of alcoholic drinks) or never or former drinkers. Alcohol intake was categorised into low drinkers (1–2 drinks per day for women and 1–3 drinks per day for men) and high drinkers (>2 drinks per day for women and >3 drinks per day for men; 1 drink or 1 unit of alcohol=8 g of alcohol).18 Smoking status was defined as current smoker (individuals who smoked any tobacco in the past 12 months) or never or former smoker.9
For psychosocial risk factors, we adapted measures of psychosocial stress and depression from INTERSTROKE.18 Psychosocial stress combined measures of stress at home or work (eg, irritability, anxiety, or sleeping difficulties) and life events, experienced in the 2 weeks preceding the stroke. The definition of depression combined depressed mood and a checklist of other depression symptoms experienced in the 4 weeks preceding the stroke. Additional details on these assessments are presented in the appendix.
Family history of cardiovascular risk or diseases was defined as self-reported history of any of hypertension, diabetes, dyslipidaemia, stroke, cardiac disease, or obesity in a participant’s father, mother, sibling, or second-degree relative.
Statistical analysis
Prevalence of stroke in Africa is up to 315 per 100 000 population.23 Given the current prevalence and incidence of stroke in Africa, a sample size of 2000 cases and 2000 controls will be sufficient to give a power of 80% to detect an effect size of odds ratio at least 1.4, allowing for several types of exposures (categorical, count, or continuous).
We investigated 30 potential risk factors for stroke in Nigeria and Ghana that were carefully selected on the basis of a literature search, our clinical understanding of stroke risk, and empirical evidence from our data (significant associations observed in bivariate analyses). We assessed the bivariate association between risk factors and stroke status (case vs control) using the McNemar test for paired categorical outcomes. We did a similar analysis with stratification by stroke type (ischaemic vs haemorrhagic). We did further analyses to establish the adjusted associations between the risk factors and stroke occurrence for the total sample and stratified by stroke types and by age (<50 years vs ≥50 years) using conditional logistic regression with adjustment for potential confounders that were not used in the matching, apart from baseline age, which was included to adjust for residual confounding because of the non-exact age matching (appendix). The adjusted models included selected covariates depending on whether or not they were confirmed confounders in the bivariate analysis and whether or not they did not improve the model fit, or increased the SE of the parameter estimate of the primary exposure. Additionally, we assessed the final adjusted models for collinearity using variance inflation factor and goodness of fit in a residual analysis.
We estimated the odds ratios (ORs) and 95% CIs in the final models using conditional likelihood. We calculated the adjusted population-attributable risks (PARs) with their respective 95% CIs for each exposure variable included in the best-fitted adjusted models. The PARs were estimated as the proportion of the risk of stroke in the population that is attributable to the individual risk factors (ie, the proportion of cases that would not occur in the population if the factor were eliminated).24 The 95% CIs for the PAR were obtained using the AF R package,24 in which the variance is estimated via the delta method. The advantage of the AF package is that it allows for an empirical variance estimator to be used in building the 95% CI. Composite PARs for the dominant risk factors for stroke, stroke subtypes and age (<50 years vs ≥50 years) were calculated, adjusted for covariates (intermediate or non-modifiable covariates: age, family history of cardiovascular disease, education, and income), using the ATTRIBRISK R package with 95% CIs computed via the bootstrap method. We also did several sensitivity analyses using different definitions for hypertension, sources of control cohort (community-based controls vs hospital-based controls), and sources of case respondents to questionnaires (cases vs proxy respondents), as well as by country. All statistical tests of hypotheses are two sided. Statistical analyses and graphics were produced with SAS (version 9.4) and R statistical program (version 3.4.2).
Role of the funding source
The funders of the study had no role in study design, data collection, data analysis, data interpretation, or writing of the report. MOO had full access to all the data in the study and final responsibility for the decision to submit for publication.
Results
Between Aug 28, 2014, and June 15, 2017, we approached 3000 cases and 2200 controls, of whom we enrolled 2118 patients with stroke (cases) and 2118 controls. 1192 (56%) participants in each group were men, and the mean age was 59.0 years (SD 13.8) for cases versus 57.8 years (13.7) for controls (table 1). 1758 (83%) controls were recruited from communities where stroke cases were recruited, 328 (15%) were hospital-based controls from the same hospitals, and 32 were invited during community outreaches and recruited in the hospitals. MRI or CT scan was available for 2118 (100%) cases, 2113 (>99%) had a lipid profile, 1717 (81%) had HBA1c measurements, and 1530 (72%) had fasting blood glucose results, whereas 1597 (75%) had ECG, 916 (43%) had transthoracic echocardiography, and 974 (46%) had carotid doppler studies. Among cases with discrete ischaemic or haemorrhagic strokes (n=2112), study questionnaires for cases were completed by 1621 (76%) proxy respondents, 414 (20%) by patients, and 77 (4%) by both patients and proxy respondents. Six cases and seven controls self-reported sickle-cell anaemia and eight cases and eight controls reported previously diagnosed HIV/AIDS.
Table 1.
Comparison of characteristics of participants by case-control status and by stroke type
| Stroke status
|
Haemorrhagic stroke status
|
Ischaemic stroke status
|
||||||||||
|---|---|---|---|---|---|---|---|---|---|---|---|---|
| Available data (n) |
Control (n=2118) |
Case (n=2118) |
p value | Available data (n) |
Control (n=682) |
Case (n=682) |
p value | Available data (n) |
Control (n=1430) |
Case (n=1430) |
p value | |
| Country, Ghana | 2118 | 926 (44%) | 917 (43%) | 0.39 | 682 | 362 (53%) | 360 (53%) | 0.82 | 1430 | 561 (39%) | 555 (39%) | 0.47 |
|
| ||||||||||||
| Gender, male | 2118 | 1192 (56%) | 1192 (56%) | ·· | 682 | 428 (63%) | 428 (63%) | ·· | 1430 | 762 (53%) | 762 (53%) | ·· |
|
| ||||||||||||
| Age (years) | 2118 | 57.8 (13.7) | 59.0 (13.8) | <0.0001 | 682 | 52.4 (12.8) | 53.4 (12.8) | <0.0001 | 1430 | 60.4 (13.3) | 61.6 (13.5) | <0.0001 |
|
| ||||||||||||
| Age >65 years | 2118 | 623 (29%) | 676 (32%) | <0.0001 | 682 | 106 (16%) | 110 (16%) | 0.54 | 1430 | 515 (36%) | 562 (39%) | <0.0001 |
|
| ||||||||||||
| Domicile | ||||||||||||
| Rural | 2112 | 302 (14%) | 142 (7%) | <0.0001 | 682 | 83 (12%) | 42 (6%) | 0.02 | 1424 | 216 (15%) | 98 (7%) | <0.0001 |
| Semi-urban | 2112 | 520 (25%) | 574 (27%) | ·· | 682 | 158 (23%) | 182 (27%) | ·· | 1424 | 360 (25%) | 390 (27%) | ·· |
| Urban | 2112 | 1290 (61%) | 1396 (66%) | ·· | 682 | 441 (65%) | 458 (67%) | ·· | 1424 | 848 (59%) | 936 (66%) | ·· |
|
| ||||||||||||
| Monthly income >US$100 | 2062 | 905 (44%) | 1169 (57%) | <0.0001 | 658 | 303 (46%) | 376 (57%) | <0.0001 | 1398 | 600 (43%) | 788 (56%) | <0.0001 |
|
| ||||||||||||
| Education (some) | 2104 | 1692 (80%) | 1761 (84%) | 0.002 | 680 | 584 (86%) | 606 (89%) | 0.057 | 1418 | 1103 (78%) | 1150 (81%) | 0.01 |
|
| ||||||||||||
| Hypertension | 2101 | 1210 (58%) | 1998 (95%) | <0.0001 | 680 | 352 (52%) | 664 (98%) | <0.0001 | 1415 | 855 (60%) | 1329 (94%) | <0.0001 |
|
| ||||||||||||
| Dyslipidaemia | 2118 | 1296 (61%) | 1661 (78%) | <0.0001 | 682 | 427 (63%) | 509 (75%) | <0.0001 | 1430 | 865 (60%) | 1147 (80%) | <0.0001 |
|
| ||||||||||||
| Diabetes | 2112 | 281 (13%) | 800 (38%) | <0.0001 | 682 | 74 (11%) | 185 (27%) | <0.0001 | 1424 | 208 (15%) | 612 (43%) | <0.0001 |
|
| ||||||||||||
| Cardiac disease | 2091 | 111 (5%) | 249 (12%) | <0.0001 | 675 | 29 (4%) | 45 (7%) | 0.068 | 1410 | 80 (6%) | 203 (14%) | <0.0001 |
|
| ||||||||||||
| HDL cholesterol (mmol/L) | 2062 | 1.3 (0.4) | 1.3 (0.5) | <0.0001 | 664 | 1.4 (0.4) | 1.4 (0.5) | 0.67 | 1392 | 1.4 (0.5) | 1.2 (0.5) | <0.0001 |
|
| ||||||||||||
| HDL cholesterol ≤1.03 mmol/L | 2062 | 495 (24%) | 697 (34%) | <0.0001 | 664 | 159 (24%) | 162 (24%) | 0.90 | 1392 | 335 (24%) | 535 (38%) | <0.0001 |
|
| ||||||||||||
| LDL cholesterol (mmol/L) | 2060 | 3.2 (1.2) | 3.2 (1.3) | 0.14 | 662 | 3.2 (1.2) | 3.4 (1.4) | 0.09 | 1392 | 3.1 (1.2) | 3.2 (1.3) | 0.55 |
|
| ||||||||||||
| LDL cholesterol ≥34 mmol/L | 2060 | 824 (40%) | 853 (41%) | 0.38 | 662 | 282 (43%) | 292 (44%) | 0.64 | 1392 | 539 (39%) | 558 (40%) | 0.48 |
|
| ||||||||||||
| LDL:HDL ratio | 2031 | 2.6 (1.4) | 2.9 (1.8) | <0.0001 | 653 | 2.6 (1.3) | 2.8 (2.0) | 0.04 | 1372 | 2.6 (1.4) | 3.0 (1.7) | <0.0001 |
|
| ||||||||||||
| LDL:HDL ratio >2.96 | 2031 | 646 (32%) | 778 (38%) | <0.0001 | 653 | 218 (33%) | 221 (34%) | 0.90 | 1372 | 425 (31%) | 556 (41%) | <0.0001 |
|
| ||||||||||||
| LDL:HDL ratio | ||||||||||||
| ≤2.00 | 2031 | 747 (37%) | 609 (30%) | <0.0001 | 653 | 233 (36%) | 223 (34%) | 0.65 | 1372 | 512 (37%) | 384 (28%) | <0.0001 |
| 2.01–2.96 | 2031 | 640 (32%) | 644 (32%) | ·· | 653 | 202 (31%) | 210 (32%) | ·· | 1372 | 435 (32%) | 432 (31%) | ·· |
| ≥2.97 | 2031 | 644 (32%) | 778 (38%) | ·· | 653 | 218 (33%) | 220 (34%) | ·· | 1372 | 425 (31%) | 556 (41%) | ·· |
|
| ||||||||||||
| Total cholesterol (mmol/L) | 2109 | 5.1 (1.3) | 5.1 (1.5) | 0.52 | 680 | 5.1 (1.3) | 5.2 (1.5) | 0.07 | 1423 | 5.1 (1.3) | 5.0 (1.5) | 0.66 |
|
| ||||||||||||
| Total cholesterol ≥5.2 mmol/L | 2109 | 877 (42%) | 953 (45%) | 0.02 | 680 | 286 (42%) | 326 (48%) | 0.04 | 1423 | 586 (41%) | 625 (44%) | 0.15 |
|
| ||||||||||||
| Triglyceride (mmol/L) | 2102 | 1.2 (0.6) | 1.5 (1.0) | <0.0001 | 676 | 1.1 (0.6) | 1.4 (1.0) | <0.0001 | 1420 | 1.2 (0.6) | 1.5 (1.0) | <0.0001 |
|
| ||||||||||||
| Triglyceride ≥1.7 mmol/L | 2102 | 298 (14%) | 561 (27%) | <0.0001 | 676 | 87 (13%) | 157 (23%) | <0.0001 | 1420 | 210 (15%) | 403 (28%) | <0.0001 |
|
| ||||||||||||
| WHR | 1944 | 0.92 (0.09) | 0.94 (0.08) | <0.0001 | 647 | 0.90 (0.08) | 0.93 (0.07) | <0.0001 | 1291 | 0.92 (0.09) | 0.94 (0.08) | <0.0001 |
|
| ||||||||||||
| WHR raised | 1944 | 1328 (68%) | 1582 (81%) | <0.0001 | 647 | 386 (60%) | 511 (79%) | <0.0001 | 1291 | 939 (73%) | 1068 (83%) | <0.0001 |
|
| ||||||||||||
| WHR | ||||||||||||
| ≤0.90 | 1944 | 848 (44%) | 552 (28%) | <0.0001 | 647 | 339 (52%) | 203 (31%) | <0.0001 | 1291 | 506 (39%) | 349 (27%) | <0.0001 |
| 0.91–0.96 | 1944 | 591 (30%) | 721 (37%) | ·· | 647 | 181 (28%) | 244 (38%) | ·· | 1291 | 407 (32%) | 474 (37%) | ·· |
| ≥0.97 | 1944 | 505 (26%) | 671 (35%) | ·· | 647 | 127 (20%) | 200 (31%) | ·· | 1291 | 378 (29%) | 469 (36%) | ·· |
|
| ||||||||||||
| WHR, lowest vs highest thirds | 1226 | 462 (38%) | 671 (55%) | <0.0001 | 402 | 115 (29%) | 204 (51%) | <0.0001 | 515 | 218 (42%) | 291 (57%) | <0.0001 |
|
| ||||||||||||
| WHR, first vs second and third thirds | 1944 | 1096 (56%) | 1392 (72%) | <0.0001 | 647 | 308 (48%) | 445 (69%) | <0.0001 | 1291 | 785 (61%) | 942 (73%) | <0.0001 |
|
| ||||||||||||
| BMI (kg/m2) | 1461 | 26.5 (5.8) | 26.6 (5.1) | 0.62 | 474 | 26.9 (6.1) | 26.3 (5.1) | 0.10 | 918 | 26.2 (5.7) | 26.7 (5.1) | 0.08 |
|
| ||||||||||||
| BMI >30 kg/m2 | 1461 | 333 (23%) | 314 (21%) | 0.44 | 474 | 120 (25%) | 92 (19%) | 0.03 | 918 | 197 (21%) | 207 (23%) | 0.62 |
|
| ||||||||||||
| Physical activity (some activity) | 2059 | 2010 (98%) | 1960 (95%) | <0.0001 | 672 | 659 (98%) | 642 (96%) | 0.01 | 1381 | 1345 (97%) | 1313 (95%) | 0.002 |
|
| ||||||||||||
| Tobacco use in past 12 months | 2050 | 29 (1%) | 70 (3%) | <0.0001 | 667 | 9 (1%) | 33 (5%) | <0.0001 | 1377 | 19 (1%) | 36 (3%) | 0.02 |
|
| ||||||||||||
| Tobacco (any use) | 2075 | 162 (8%) | 205 (10%) | 0.02 | 670 | 42 (6%) | 70 (10%) | 0.006 | 1399 | 120 (9%) | 134 (10%) | 0.37 |
|
| ||||||||||||
| Alcohol (current user) | 2083 | 321 (15%) | 398 (19%) | 0.001 | 672 | 118 (18%) | 179 (27%) | <0.0001 | 1405 | 202 (14%) | 218 (16%) | 0.39 |
|
| ||||||||||||
| Alcohol (any use) | 2083 | 671 (32%) | 762 (37%) | 0.001 | 672 | 231 (34%) | 292 (43%) | <0.0001 | 1405 | 438 (31%) | 468 (33%) | 0.17 |
|
| ||||||||||||
| Alcohol use | ||||||||||||
| Never | 1752 | 1433 (82%) | 1351 (77%) | <0.0001 | 562 | 439 (78%) | 392 (70%) | <0.0001 | 1184 | 989 (84%) | 953 (80%) | 0.01 |
| Ever low | 1752 | 310 (18%) | 357 (20%) | ·· | 562 | 121 (22%) | 147 (26%) | ·· | 1184 | 188 (16%) | 210 (18%) | ·· |
| Ever high | 1752 | 9 (1%) | 44 (3%) | ·· | 562 | 2 (<1%) | 23 (4%) | ·· | 1184 | 7 (1%) | 21 (2%) | ·· |
|
| ||||||||||||
| Stress | 1945 | 296 (15%) | 461 (24%) | <0.0001 | 628 | 109 (17%) | 153 (24%) | 0.004 | 1311 | 188 (14%) | 307 (23%) | <0.0001 |
|
| ||||||||||||
| Cancer | 2039 | 4 (<1%) | 10 (<1%) | 0.12 | 657 | 0 (0%) | 2 (<1%) | NA* | 1376 | 4 (<1%) | 10 (1%) | 0.27 |
|
| ||||||||||||
| Depression | 1915 | 140 (7%) | 170 (9%) | 0.08 | 616 | 43 (7%) | 54 (9%) | 0.28 | 1293 | 97 (8%) | 116 (9%) | 0.20 |
|
| ||||||||||||
| Family history of CVD | 2088 | 606 (29%) | 852 (41%) | <0.0001 | 674 | 213 (32%) | 283 (42%) | <0.0001 | 1408 | 391 (28%) | 565 (40%) | <0.0001 |
|
| ||||||||||||
| Added salt at the table | 2036 | 118 (6%) | 173 (8%) | 0.001 | 664 | 45 (7%) | 68 (10%) | 0.03 | 1366 | 74 (5%) | 105 (8%) | 0.02 |
|
| ||||||||||||
| Added salt at the table | ||||||||||||
| Never or rarely | 2036 | 1653 (81%) | 1433 (70%) | <0.0001 | 664 | 545 (82%) | 464 (70%) | <0.0001 | 1366 | 1104 (81%) | 966 (71%) | <0.0001 |
| Occasionally | 2036 | 265 (13%) | 432 (21%) | ·· | 664 | 73 (11%) | 133 (20%) | ·· | 1366 | 190 (14%) | 296 (22%) | ·· |
| Very often | 2036 | 118 (6%) | 171 (8%) | ·· | 664 | 46 (7%) | 67 (10%) | ·· | 1366 | 72 (5%) | 104 (8%) | ·· |
|
| ||||||||||||
| Regular green leafy vegetable consumption | 1966 | 1606 (82%) | 1390 (71%) | <0.0001 | 646 | 529 (82%) | 450 (70%) | <0.0001 | 1314 | 1072 (82%) | 934 (71%) | <0.0001 |
|
| ||||||||||||
| Regular whole grains consumption | 1973 | 1636 (83%) | 1693 (86%) | 0.01 | 646 | 547 (85%) | 552 (85%) | 0.75 | 1321 | 1085 (82%) | 1137 (86%) | 0.006 |
|
| ||||||||||||
| Regular legumes consumption | 1954 | 1258 (64%) | 1303 (67%) | 0.13 | 640 | 428 (67%) | 438 (68%) | 0.63 | 1308 | 825 (63%) | 862 (66%) | 0.14 |
|
| ||||||||||||
| Regular fruit consumption | 1960 | 1703 (87%) | 1627 (83%) | 0.001 | 641 | 563 (88%) | 526 (82%) | 0.004 | 1313 | 1134 (86%) | 1096 (83%) | 0.04 |
|
| ||||||||||||
| Regular sugar consumption | 1950 | 700 (36%) | 614 (31%) | 0.004 | 642 | 260 (40%) | 224 (35%) | 0.05 | 1302 | 438 (34%) | 387 (30%) | 0.04 |
|
| ||||||||||||
| Regular meat consumption | 1972 | 1564 (79%) | 1644 (83%) | 0.001 | 650 | 532 (82%) | 555 (85%) | 0.09 | 1316 | 1026 (78%) | 1083 (82%) | 0.005 |
|
| ||||||||||||
| Regular fish consumption | 1964 | 1827 (93%) | 1838 (94%) | 0.51 | 647 | 597 (92%) | 610 (94%) | 0.20 | 1311 | 1223 (93%) | 1223 (93%) | 1.00 |
Data are number (%) or mean (SD). Some percentages do not add up to 100 because of rounding. p values reported for paired t test, McNemar χ2, or test of marginal homogeneity. WHR=waist-to-hip ratio. BMI=body-mass index. NA=not applicable. CVD=cardiovascular disease.
χ2 could not be computed because a cell had a 0 value.
Among stroke cases, 1396 (66%) resided in urban, 574 (27%) in semi-urban, and 142 (7%) in rural settings. Comparing cases with controls, 1998 (95%) of 2101 versus 1210 (58%) had hypertension; 1661 (78%) of 2118 versus 1296 (61%) had dyslipidaemia; 800 (38%) of 2112 versus 281 (13%) had diabetes; 249 (12%) of 2091 versus 111 (5%) had cardiac diseases; and 70 (3%) versus 29 (1%) were current cigarette smokers (p<0.0001 for all comparisons). Waist-to-hip ratio (p<0.0001), but not BMI (p=0.62), was significantly higher among patients with stroke than controls (table 1). Furthermore, patients with stroke were more likely to add salt at the table (p<0.0001), consume meat (p=0.001) and whole grains (p=0.01) on a regular basis, but less likely to consume green leafy vegetables regularly (p<0.0001) compared with controls.
1430 (68%) patients had ischaemic stroke, 682 (32%) had haemorrhagic stroke, and six (<1%) had both discrete ischaemic and haemorrhagic lesions (appendix). Cases with both ischaemic and haemorrhagic lesions were excluded from stroke type analyses. Using the TOAST classification (n=1216), 455 (37%) had small-vessel occlusions, 411 (34%) had large artery atherosclerotic strokes, 102 (8%) had cardioembolic strokes, and 248 (20%) had stroke of undetermined cause or other causes. Haemorrhagic strokes (n=598 with available causative information) were caused by hypertension in 520 (87%)) people, structural lesions in 40 (7%), cerebral amyloid angiopathy in 12 (2%), systemic diseases in ten (2%), medication use in six (1%), and undetermined cause in ten (2%), with some causative overlaps. Regarding the functional status and severity of patients with stroke at presentation (n=1928), the modified Rankin scores were as follows: 24 (1%) had a score of 0, 80 (4%) a score of 1, 115 (6%) a score of 2, 130 (7%) a score of 3, 902 (47%) a score of 4, and 677 (35%) a score of 5 (appendix).
The top 11 potentially modifiable risk factors associated with stroke occurrence in decreasing order of magnitude by PAR were hypertension, dyslipidaemia, regular meat consumption, elevated waist-to-hip ratio, diabetes, low green leafy vegetable consumption, stress, added salt at the table, cardiac disease, physical inactivity, and current use of cigarettes (table 2). These 11 factors compositely accounted for 98.2% (95% CI 97.2–99.0) of PAR associated with stroke (table 2, appendix). Five factors—hypertension, diabetes, dyslipidaemia, stress, and green leafy vegetable consumption—were associated with both stroke types; obesity, physical inactivity, regular meat intake, salt intake, and cardiac diseases were associated with ischaemic strokes, whereas tobacco was associated with haemorrhagic strokes (table 3; appendix).
Table 2.
Adjusted odds ratios and PARs for stroke
| Odds ratio (95% CI) |
Population-attributable risk (%, 95% CI) |
|
|---|---|---|
| Baseline age ≥50 years | 4.54 (1.87 to 11.01) | 58 8% (48.8 to 68.7) |
| Education (some vs none) | 1.38 (0.97 to 1.96) | 23.5% (3.1 to 44.0) |
| Monthly income >US$100 | 1.35 (1.07 to 1.71) | 14.9% (3.8 to 26.0) |
| Hypertension | 19.36 (12.11 to 30.93) | 90.8% (87.9 to 93.7) |
| Dyslipidaemia | 1.85 (1.44 to 2.38) | 35.8% (25.3 to 46.2) |
| Diabetes | 2.58 (1.98 to 3 37) | 22.1% (17.8 to 26.4) |
| Cardiac disease | 1.65 (1.09 to 2.49) | 4.3% (0.6 to 7.9) |
| Elevated waist-to-hip ratio | 1.48 (1.13 to 1.94) | 26.5% (12.9 to 40.2) |
| Physical inactivity | 213 (1.12 to 4.05) | 2.4% (0.7to 4.1) |
| Current cigarette smoker | 4.42 (1.75 to 11.16) | 2.3% (1.5 to 3.1) |
| Stress | 1.89 (1.40 to 2.54) | 11.6% (6.6 to 16.7) |
| Family history of CVD | 1.29 (1.00 to 1.66) | 9.2% (−0.5 to 18.9) |
| Added salt at the table | 2.14 (1.34 to 3.43) | 5.3% (3.3 to 7.3) |
| Low green leafy vegetable consumption | 2.43 (1.81 to 3.26) | 18.2% (14.1 to 22.3) |
| Regular sugar consumption | 1.16 (0.90 to 1.48) | 4.4% (−2.4 to 11.2) |
| Regular meat consumption | 1.59 (1.19 to 213) | 31.1% (13.3 to 48.9) |
| Composite PAR | ·· | 98.2% (97.2 to 99.0) |
PAR=population-attributable risk. CVD=cardiovascular disease.
Table 3.
Adjusted odds ratios and PARs by stroke type
| Haemorrhagic stroke | Ischaemic stroke | |||
|---|---|---|---|---|
| Adjusted odds ratio (95% CI) | PAR (%, 95% CI) | Adjusted odds ratio (95% CI) | PAR (%, 95% CI) | |
| Baseline age ≥50 years | 5.45 (0.89 to 33.28) | 49.7% (31.3 to 68.1) | 3.93 (1.39 to 11.06) | 61.2% (48.6 to 73.9) |
| Education (some vs none) | 1.64 (0.82 to 3.28) | 30.9% (−14.2 to 76.1) | 1.40 (0.92 to 2.13) | 23 8% (0.0 to 47.5) |
| Monthly income >US$100 | 0.98 (0.62 to 1.54) | 19.0% (7.1 to 30.9) | 1.50 (113 to 1.99) | 19.0% (7.1 to 30.9) |
| Hypertension | 75.91 (22.81 to 252.63) | 96.6% (94.4 to 98.9) | 11.93 (7.09 to 20.10) | 86.6% (81.6 to 91.6) |
| Dyslipidaemia | 1.80 (1.11 to 2.92) | 32.7% (11.2 to 54.1) | 1.90 (1.40 to 2.58) | 37.6% (24.3 to 50.8) |
| Diabetes | 2.30 (1.35 to 3.93) | 14.6% (5.9 to 23.3) | 2.70 (1.96 to 3.71) | 26.2% (20.8 to 31.6) |
| Cardiac disease | 0.50 (0.19 to 1.28) | −6.0% (−18.1 to 6.2) | 2.21 (1.38 to 3.54) | 7.4% (3.1 to 11.8) |
| Raised waist-to-hip ratio | 1.23 (0.75 to 2.03) | 16.4% (−7.2 to 40.1) | 1.58 (1.14 to 2.21) | 30.4% (13.1 to 47.8) |
| Physical inactivity | 1.92 (0.56 to 6.60) | 21.3% (−1.6 to 5.8) | 2.21 (1.01 to 4.82) | 2.5% (0.5 to 4.6) |
| Current cigarette smoker | 7.45 (1.15 to 48.20) | 3.8% (2.3 to 5.2) | 2.93 (0.97 to 8.87) | 1.5% (0.4 to 2.5) |
| Stress | 2.35 (1.34 to 4.10) | 14.0% (6.6 to 21.4) | 1.86 (1.28 to 2.69) | 11.4% (4.4 to 18.3) |
| Family history of CVD | 1.23 (0.77 to 1.97) | 7.5% (−13.5 to 28.5) | 1.33 (0.97 to 1.83) | 10.1% (−0.9 to 21.0) |
| Added salt at the table | 2.42 (0.99 to 5.90) | 6.6% (2.3 to 11.0) | 2.10 (1.18 to 3.76) | 4.7% (2.6 to 6.8) |
| Low green leafy vegetable consumption | 2.81 (1.57 to 5.06) | 20.7% (13.1 to 28.2) | 2.36 (1.66 to 3.34) | 17.5% (12.2 to 22.9) |
| Regular sugar consumption | 0.83 (0.52 to 1.33) | −6.3% (−27.3 to 14.7) | 1.30 (0.96 to 1.76) | 7.3% (−0.4 to 15.1) |
| Regular meat consumption | 1.79 (0.99 to 3.25) | 38 8% (3.8 to 73.9) | 1.50 (1.06 to 2.12) | 27.7% (3.5 to 52.0) |
| Composite PAR | ·· | 99.3 (98.5 to 99.9) | ·· | 97.7% (96.2 to 98.8) |
PAR=population-attributable risk. CVD=cardiovascular disease.
Hypertension, dyslipidaemia, diabetes, stress, and low consumption of green leafy vegetables were associated with stroke regardless of age cutoff. Cardiac diseases were significantly more associated with stroke in people younger than 50 years, whereas current cigarette smoking, added table salt, and regular meat consumption were significantly associated with stroke in those 50 years and older (table 4). Hypertension, diabetes, dyslipidaemia, and low consumption of green leafy vegetables were independently associated with stroke in both Ghana and Nigeria (appendix). However, obesity, stress, regular meat consumption, and regular sugar consumption were significantly associated with stroke occurrence among Nigerians, whereas cardiac diseases, physical inactivity, current cigarette smoking, and salt consumption were associated with stroke among Ghanaians (appendix). Intake of vegetables showed a dose-response relationship with stroke, occasional or regular salt intake was associated with a higher risk of stroke than no or rare salt intake, and weekly meat consumption was associated with a higher risk of stroke than no or less than monthly meat consumption (figure).
Table 4.
Adjusted odds ratios and PARs by age group
| Age <50 years | Age >50 years | |||
|---|---|---|---|---|
| Adjusted odds ratio (95% CI) | PAR (%, 95% CI) | Adjusted odds ratio (95% CI) | PAR (%, 95% CI) | |
| Education (some vs none) | 3.68 (1.01 to 13.41) | 68.9% (36.0 to 101.7) | 1.16 (0.80 to 1.68) | 11.5% (−11.2 to 34.2) |
| Monthly income >US$100 | 1.37 (0.69 to 2.75) | 17.0% (−44.1 to 78.0) | 1.37 (1.06 to 1.77) | 15.0% (3.5 to 26.5) |
| Hypertension | 30.84 (11.37 to 83.61) | 88.7% (82.5 to 94.8) | 17.82 (9.99 to 31.18) | 91.6% (87.6 to 95.7) |
| Dyslipidaemia | 2.75 (1.34 to 5.61) | 48.2% (30.6 to 65.9) | 1.74 (1.32 to 2.31) | 33.6% (21.3 to 45.9) |
| Diabetes | 5.80 (2.05 to 16.36) | 22.6% (18.7 to 26.5) | 2.40 (1.81 to 319) | 22.9% (17.6 to 28.3) |
| Cardiac disease | 8.03 (1.91 to 33 82) | 8.4% (5.8 to 11.1) | 1.34 (0.86 to 2.08) | 2.9% (−2.0 to 7.8) |
| Raised waist-to-hip ratio | 1.99 (0.95 to 4.18) | 38 5% (7.8 to 69.2) | 1.33 (0.99 to 1.81) | 20.8% (4.0 to 37.6) |
| Physical inactivity | 7.42 (0.59 to 93 98) | 2.8% (0.8 to 4.7) | 1.92 (1.00 to 3.71) | 2.3% (0.3 to 4.3) |
| Current cigarette smoker | 5.52 (0.36 to 84.59) | 3.7% (−3.4 to 10.7) | 3.88 (1.42 to 10.61) | 1.9% (1.0 to 2.7) |
| Stress | 2.26 (1.04 to 4.93) | 14.5% (4.9 to 24.1) | 1.78 (1.28 to 2.48) | 10.4% (4.7 to 16.1) |
| Family history of CVD | 1.27 (0.60 to 2.70) | 9.4% (−30.6 to 49.3) | 1.32 (1.00 to 1.75) | 10.0% (0.0 to 20.0) |
| Added salt at the table | 1.23 (0.36 to 4.13) | 1.8% (−7.4 to 11.1) | 2.47 (1.45 to 4.19) | 5.8% (3.8 to 7.8) |
| Low green leafy vegetable consumption | 2.31 (1.02 to 5.22) | 18.2% (−6.8 to 43.2) | 2.33 (1.69 to 3.23) | 17.4% (13.2 to 21.7) |
| Regular sugar consumption | 1.36 (0.65 to 2.85) | 11.7% (−13.5 to 37.0) | 1.18 (0.89 to 1.55) | 4.3% (−2.5 to 11.1) |
| Regular meat consumption | 1.50 (0.52 to 4.35) | 30.4% (−38 8 to 99 5) | 1.56 (1.15 to 213) | 29.3% (10.5 to 48.2) |
| Composite PAR | ·· | 98.1% (96.0 to 99.8) | ·· | 98.3% (97.1 to 99.2) |
PAR=population-attributable risk. CVD=cardiovascular disease.
Figure.
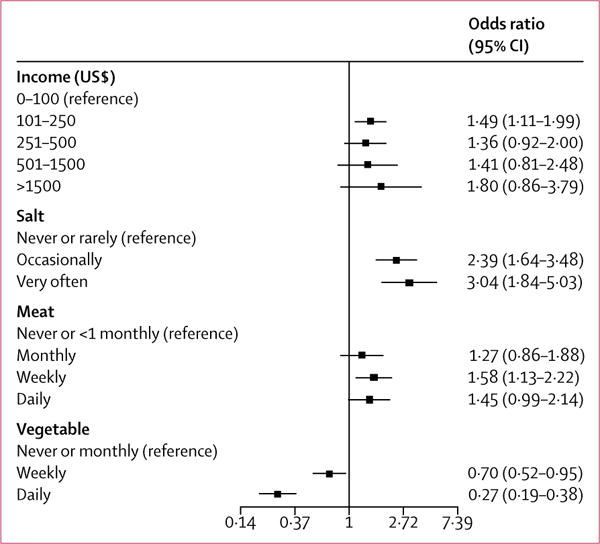
Dose-response relationships with stroke
Several sensitivity analyses were done to assess the effect of using different definitions for risk factors and sources of controls. For example, the effect size of the association and the corresponding PAR between hypertension and stroke occurrence varied depending upon the definition of hypertension used and whether adjustments were made for the acute rise in systolic blood pressure after stroke onset. We calculated an adjusted OR of 5.79 (95% CI 4.32–7.76) if blood pressure was adjusted for the acute rise and hypertension was defined based on blood pressure measured on the morning after admission, and an OR of 17.87 (11.49–27.78) if blood pressure at the time of interview was elevated or new antihypertensive drugs were introduced after stroke occurrence (appendix).
The effect sizes of factors associated with stroke occurrence were also affected by the source of controls used to match cases and source of respondents for cases. Eight of the 11 modifiable factors associated with stroke from the overall analyses maintained significant associations in sensitivity analyses limited to the 1758 community-recruited controls versus case pairs (83% of entire sample size), whereas three of 11 factors maintained significant associations in the 328 hospital-recruited controls versus stroke case pairs (17% of entire sample size; appendix). Furthermore, because of the high frequency of severe stroke, responses to questions were obtained from 1621 proxy respondents (77%) and 414 (20%) from patients themselves (appendix). Similarly in the sensitivity analyses, nine of 11 modifiable risk factors—namely, hypertension, diabetes, physical inactivity, stress, added salt at table, regular meat consumption, low consumption of green leafy vegetables, current cigarette smoking, and cardiac disease—maintained significant associations with stroke in the proxy respondents, whereas three factors—hypertension, stress, and low consumption of green leafy vegetables—maintained association in self respondents. Higher monthly income and lower educational status were associated with stroke occurrence but were considered socioeconomic indicators, hence were not included as modifiable risk factors (appendix).
Discussion
We have identified the top 11 modifiable risk factors that account for 98.2% of PAR associated with stroke among people from Ghana and Nigeria in the largest study done on stroke in Africa. Our findings build on those of INTERSTROKE,9 but there are important differences in effect sizes of risk factors, and novel factors among Africans are worth noting. First, the adjusted OR for hypertension reported among Africans of 4.01 (99% CI 2.59–6.21) in INTERSTROKE was the highest for any region.9 However, in the SIREN study, we found an even higher estimate of 19.36 (95% CI 12.11–30.93) for stroke overall, with a higher effect size for haemorrhagic compared with ischaemic strokes. This high effect size persisted even after adjustment for rise in systolic blood pressure after stroke19 and with various definitions of hypertension in a sensitivity analysis. Initiation of antihypertensive therapy after haemorrhagic stroke contributed to the observed high effect size of hypertension. The high OR for haemorrhagic stroke is consistent with a high OR of up to 28.8 for hypertension reported elsewhere.26 Second, although diabetes was not associated with stroke among Africans in INTERSTROKE, it was associated with both stroke types, with a higher effect size for ischaemic stroke, in this study. Third, economic and psychosocial factors were associated with stroke in the present study, but not among the African subset of INTERSTROKE. With a sample size of 2118, more than twice the sample size of 973 dyads of Africans in INTERSTROKE, the SIREN study has greater power to detect differences with fewer false negatives.
Furthermore, to increase the applicability of our findings in routine clinical settings, we analysed intake of various dietary components individually, not as a composite dietary score,9 and also measured routinely used lipid fractions in the estimation of cardiovascular disease risk. Some of the modifiable factors in our study (including hypertension, smoking, physical inactivity, and a diet low in green leafy vegetables) are consistent with those identified in the GBD Study,8 with differences in ranking. The GBD Study, however, did not examine stress, meat consumption, and income level, whereas we did not identify an independent association of certain factors suggested by the GBD Study, such as BMI, alcohol consumption, and fruit consumption. However, like the SIREN study, INTERSTROKE showed a stronger relationship between stroke and waist-to-hip ratio than BMI.9
Dietary and socioeconomic factors seem to play more important roles in predisposition to stroke among Africans than previously appreciated. Regular intake of meat, added table salt, and low consumption of green leafy vegetables were associated with stroke in both countries in the present study. Higher income was independently associated with stroke (significantly in the US$101–250 band) and was also associated with increased salt and meat intake, but decreased vegetable intake in cases, suggesting that poor dietary choices might be underpinned by higher income level (appendix). Although the effect of high salt intake might be mediated via hypertension occurrence or control, red meat is a source of saturated fatty acids and cholesterol, and has been associated with increased risk of stroke in a dose-dependent manner elsewhere.27 Conversely, regular consumption of green leafy vegetables was associated with reduced risk of stroke among 75000 stroke-free Swedes after a decade of follow-up.28 Although the precise biological pathways remain to be clarified, green leafy vegetables contain high concentrations of folic acid, which is inversely associated with homocysteine,29 a risk factor for cerebral small vessel disease.
We found consistent associations between stress and occurrence of ischaemic and haemorrhagic strokes. An almost doubled risk of fatal stroke has been reported among participants with self-reported high stress intensity compared with those without stress.30 Cigarette smoking was associated with stroke, but contributed little to the attributable risk because of the low prevalence of smoking among west Africans.8,9 Altogether, our study highlights the contributions of context-specific risk factors such as household income levels, poor dietary habits, and stress as risk factors to stroke occurrence among Africans, probably reflecting the effect of adoption of western lifestyles.
Pathophysiologically, ischaemic strokes were commonly of lacunar subtype followed by large-artery atherosclerosis and cardioembolic strokes. 87% of haemorrhagic strokes were attributed to hypertension on the basis of the SMASH-U classification,17 providing further impetus to address this risk factor at the population level to mitigate the occurrence of this fatal stroke type among Africans. Indeed, although hypertension and current alcohol use were significantly associated with haemorrhagic stroke compared with ischaemic stroke, dyslipidaemia, diabetes, and cardiac disease were conversely more associated with ischaemic than haemorrhagic strokes (appendix).
The mean age of the study population was 59 years, which shows the heavy economic toll stroke exerts in sub-Saharan Africa by affecting a relatively young and productive population. Although there were differences in effect sizes, the spectrum of risk factors associated with stroke occurrence among young Africans (age <50 years) were similar to those among the older population. The emergence of traditional vascular risk factors as dominant predispositions for stroke occurrence in those younger than 50 years is an indication of a rapid emergence of cardiovascular risk factors at early ages in sub-Saharan Africa. An implication is that public health interventions aimed at remediation of the traditional risk factors and the novel dietary and psychosocial factors identified are likely to lead to a reduction in stroke burden across the different age strata among the adult population.
Case-control studies such as ours cannot establish causality, but rather seek to show associations and quantify effect sizes of risk factors. Furthermore, we adopted measures similar to INTERSTROKE9 to minimise bias due to the study design. Although there are likely to be subregion-specific variations in stroke risk factor burden within Africa itself, our findings provide the context-specific information needed to combat the burden of stroke on the continent. Our estimates of diabetes should be interpreted cautiously given that only fasting blood glucose was used to diagnose diabetes in controls, whereas HbA1c, or fasting blood glucose, or both, were used in stroke cases. Similarly, the burden of cardiac diseases might have been underestimated because ECG and echocardiographic assessments were only available for some participants.
A substantial number of patients with stroke in our study had severe strokes at the time of recruitment, necessitating a proxy investigation of lifestyle and behavioural history (appendix). Valid proxies were spouses or first-degree relatives who had lived with the patient within the year before the stroke. The associations observed among proxies were in the same direction as for patients with direct assessment. Because of the high proportion of critically ill patients with stroke, not all patients could undergo exhaustive investigations to establish the cause of ischaemic and haemorrhagic strokes before their death. Nevertheless, we have provided comprehensive data on the burden of causative subtypes of stroke among Africans, to our knowledge, for the first time.
An important strength of our study was an active community engagement arm throughout the study duration to minimise presentation bias for cases and controls thereby enhancing representativeness to promote generalisability (appendix). 83% of our controls were community based and recruited from the catchment population of the cases, thereby fulfilling the ideal recommendation of community-based controls.18 Some investigators have suggested that the validity of case-control studies, which is contingent on selecting controls independently of risk factor status, could be compromised by matching.31 Hence, we individually matched cases to controls in a 1:1 fashion and used conditional logistic regression analysis to attain unbiased ORs. Finally, a strength of this study is the quantification and ranking of the unique contributions of behavioural, psychosocial, and traditional vascular risk factors for stroke, which jointly account for a huge proportion of stroke in the region. Our findings might help to explain the higher rates of strokes among individuals of African ancestry, with a greater vascular risk factor load in diasporan people (ie, people dispersed beyond their traditional homeland), as recently shown in a comparison of risk factor profiles of patients with stroke in the SIREN study with African Americans and European Americans in the REasons for Geographic And Racial Differences in Stroke (REGARDS) study.32 The SIREN study has thus established a crucial platform to lead the efforts in stroke research and control on the continent.
Indeed, the risk factors identified in the SIREN study provide context-specific potential targets for public health control of stroke on the African continent and potentially in other low-income and middle-income countries. First, given the effect of hypertension on stroke occurrence globally and among Africans in particular, the need for enhanced awareness, detection, and control of this risk factor for stroke is urgent. Second, clusters of other metabolic risk factors such as dyslipidaemia, diabetes, and obesity have become important targets for multipronged interventions for stroke prevention. Third, health promotion campaigns geared towards healthy dietary choices and exercise are likely to help curb the rising burden of stroke among Africans.
Supplementary Material
Research in context.
Evidence before this study
Sub-Saharan Africa has the highest incidence, prevalence, and case fatality from stroke worldwide, yet detailed characterisation of risk factors for stroke on the continent remains elusive. Among large-scale studies on risk factors for stroke that included African people, we identified the Global Burden of Disease (GBD) Study, which used a meta-analytic approach to analyse the scant data available, and INTERSTROKE, which used a case-control design. No significant association was found between stroke and important factors such as diabetes, cigarette smoking, physical inactivity, and dietary and psychosocial factors among Africans in INTERSTROKE, probably because of the small representation of Africans.
Added value of this study
About 98% of population-attributable risk of stroke in 2118 case-control pairs of people from Ghana and Nigeria was associated with 11 potentially modifiable factors. In descending order of population-attributable risk (PAR), hypertension, dyslipidaemia, regular meat intake, central obesity, diabetes, low consumption of green leafy vegetables, stress, added salt at the table, cardiac diseases, physical inactivity, and current cigarette smoking were independently associated with stroke occurrence. Our findings from the largest study on stroke among people in Nigeria and Ghana highlight novel associations in this population between stroke and dietary, lifestyle, and psychosocial factors, while underscoring the potent effect of hypertension on stroke occurrence among individuals of African descent.
Implication of all the evidence available
Although hypertension is the cardinal target for control of stroke in Africa, lifestyle and psychosocial factors also need to be addressed through strategic public health interventions.
Acknowledgments
The SIREN study was funded by the National Institutes of Health grant U54 HG007479 under the H3Africa initiative.
Footnotes
See Online for appendix
Contributors
MOO and BO designed the study and planned analyses. MOO and FS wrote the first draft of the report. MG and OA did the statistical analyses. RA, OA, AA, KW, RO and LO were study site lead investigators. All authors contributed to the collection of data, discussions and interpretation of the data, and to the writing and review of the manuscript.
Declaration of interests
We declare no competing interests.
References
- 1.Mozaffarian D, Benjamin EJ, Go AS, et al. Heart disease and stroke statistics—2015 update: a report from the American Heart Association. Circulation. 2015;131:e29–322. doi: 10.1161/CIR.0000000000000152. [DOI] [PubMed] [Google Scholar]
- 2.WHO. The top ten causes of death. Fact sheet. http://www.who.int/mediacentre/factsheets/fs310/en/ (accessed Feb 26, 2017)
- 3.Seshadri S, Wolf PA. Lifetime risk of stroke and dementia: current concepts, and estimates from the Framingham Study. Lancet Neurol. 2007;6:1106–14. doi: 10.1016/S1474-4422(07)70291-0. [DOI] [PubMed] [Google Scholar]
- 4.Walker R, Whiting D, Unwin N, Mugusi F, Swai M. Stroke incidence in rural and urban Tanzania: a prospective, community-based study. Lancet Neurol. 2010;9:786–92. doi: 10.1016/S1474-4422(10)70144-7. [DOI] [PubMed] [Google Scholar]
- 5.Ezejimofor MC, Uthman OA, Maduka O, et al. Stroke survivors in Nigeria: a door-to-door prevalence survey from the Niger Delta region. J Neurol Sci. 2017;372:262–69. doi: 10.1016/j.jns.2016.11.059. [DOI] [PubMed] [Google Scholar]
- 6.Sarfo FS, Awuah DO, Nkyi C, Akassi J, Opare-Sem OK, Ovbiagele B. Recent patterns and predictors of neurological mortality among hospitalized patients in Central Ghana. J Neurol Sci. 2016;363:217–24. doi: 10.1016/j.jns.2016.02.041. [DOI] [PubMed] [Google Scholar]
- 7.Walker RW, Jusabani A, Aris E, et al. Post-stroke case fatality within an incident population in rural Tanzania. J Neurol Neurosurg Psychiatry. 2011;82:1001–05. doi: 10.1136/jnnp.2010.231944. [DOI] [PubMed] [Google Scholar]
- 8.Feigin VL, Roth GA, Naghavi M, et al. Global burden of stroke and risk factors in 188 countries, during 1990-2013: a systematic analysis for the Global Burden of Disease Study 2013. Lancet Neurol. 2016;15:913–24. doi: 10.1016/S1474-4422(16)30073-4. [DOI] [PubMed] [Google Scholar]
- 9.O’Donnell MJ, Chin SL, Rangarajan S, et al. Global and regional effects of potentially modifiable risk factors associated with acute stroke in 32 countries (INTERSTROKE): a case-control study. Lancet. 2016;388:761–75. doi: 10.1016/S0140-6736(16)30506-2. [DOI] [PubMed] [Google Scholar]
- 10.Walker RW, Jusabani A, Aris E, et al. Stroke risk factors in an incident population in urban and rural Tanzania: a prospective, community-based, case-control study. Lancet Glob Health. 2013;1:e282–88. doi: 10.1016/S2214-109X(13)70068-8. [DOI] [PMC free article] [PubMed] [Google Scholar]
- 11.Owolabi MO. Taming the burgeoning stroke epidemic in Africa: stroke quadrangle to the rescue. West Indian Med J. 2011;60:412–21. [PubMed] [Google Scholar]
- 12.Akpalu A, Sarfo FS, Ovbiagele B, et al. Phenotyping stroke in sub-Saharan Africa: Stroke Investigative Research and Education Network (SIREN) Phenomics protocol. Neuroepidemiology. 2015;45:73–82. doi: 10.1159/000437372. [DOI] [PMC free article] [PubMed] [Google Scholar]
- 13.Sarfo F, Gebregziabher M, Ovbiagele B, et al. Multilingual validation of the Questionnaire for Verifying Stroke-Free Status in west Africa. Stroke. 2016;47:167–72. doi: 10.1161/STROKEAHA.115.010374. [DOI] [PMC free article] [PubMed] [Google Scholar]
- 14.Banford J, Sandercock P, Dennis M, Burn J, Warlow C. Classification and natural history of clinically identifiable subtypes of cerebral infarction. Lancet. 1991;337:1521–26. doi: 10.1016/0140-6736(91)93206-o. [DOI] [PubMed] [Google Scholar]
- 15.Kolominsky-Rabas PL, Weber M, Gefeller O, Neundoefer B, Heuschmann PU. Epidemiology of ischemic stroke subtypes according to TOAST criteria: incidence, recurrence, and long-term survival in ischemic stroke subtypes: a population-based study. Stroke. 2001;32:2735–40. doi: 10.1161/hs1201.100209. [DOI] [PubMed] [Google Scholar]
- 16.Amarenco P, Bogousslavsky J, Caplan LR, Donnan GA, Hennerici MG. New approach to stroke subtyping: the A-S-C-O (phenotypic) classification of stroke. Cerebrovasc Dis. 2009;27:502–08. doi: 10.1159/000210433. [DOI] [PubMed] [Google Scholar]
- 17.Meretoja A, Strbian D, Putaala J, et al. SMASH-U: a proposal for etiologic classification of intracerebral hemorrhage. Stroke. 2012;43:2592–97. doi: 10.1161/STROKEAHA.112.661603. [DOI] [PubMed] [Google Scholar]
- 18.O’Donnell M, Xavier D, Diener C, et al. Rationale and design of INTERSTROKE: a global case-control study of risk factors for stroke. Neuroepidemiology. 2010;35:36–44. doi: 10.1159/000306058. [DOI] [PubMed] [Google Scholar]
- 19.Fischer U, Conney MT, Bull LM, et al. Acute post-stroke blood pressure relative to premorbid levels in intracerebral haemorrhage versus major ischaemic stroke: a population-based study. Lancet Neurol. 2014;13:374–84. doi: 10.1016/S1474-4422(14)70031-6. [DOI] [PMC free article] [PubMed] [Google Scholar]
- 20.Alberti KG, Zimmet PZ. Definition, diagnosis and classification of diabetes mellitus and its complications. Part 1: diagnosis and classification of diabetes mellitus provisional report of a WHO consultation. Diabet Med. 1998;15:539–53. doi: 10.1002/(SICI)1096-9136(199807)15:7<539::AID-DIA668>3.0.CO;2-S. [DOI] [PubMed] [Google Scholar]
- 21.National Cholesterol Education Program (NCEP) Expert Panel on Detection, Evaluation, and Treatment of high blood cholesterol in adults (Adult treatment panel) Third report of the National Cholesterol Education Program (NCEP) expert panel on detection, evaluation, and treatment of high cholesterol in adults (Adult Treatment Panel III) Circulation. 2002;106:3143–21. [PubMed] [Google Scholar]
- 22.World Health Organization. Waist circumference and waist–hip ratio. Report of a WHO expert consultation. 2008 http://www.who.int/nutrition/publications/obesity/WHO_report_waistcircumference_and_waisthip_ratio/en/ (accessed May 27, 2017)
- 23.Owolabi MO, Akarolo-Anthony S, Akinyemi R, et al. The burden of stroke in Africa: a glance at the present and a glimpse into the future. Cardiovasc J Afr. 2015;26:27–38. doi: 10.5830/CVJA-2015-038. [DOI] [PMC free article] [PubMed] [Google Scholar]
- 24.Llorca J, Delgado-Rodriguez M. A comparison of several procedures to estimate the confidence interval for attributable risk in case-control studies. Stat Med. 2000;19:1089–99. doi: 10.1002/(sici)1097-0258(20000430)19:8<1089::aid-sim411>3.0.co;2-0. [DOI] [PubMed] [Google Scholar]
- 25.Dahlqwist E, Sjölander A. AF: model based estimation of confounder-adjusted attributable fractions. https://cran.r-project.org/web/packages/AF/index.html (accessed Feb 28, 2017)
- 26.Kim HC, Nam CM, Jee SH, Suh I. Comparison of blood pressure-associated risk of intracerebral hemorrhage and subarachnoid hemorrhage: Korea Medical Insurance Corporation study. Hypertension. 2005;46:393–97. doi: 10.1161/01.HYP.0000177118.46049.e6. [DOI] [PubMed] [Google Scholar]
- 27.Yang C, Pan L, Sun C, Xi Y, Wang L, Li D. Red meat consumption and the risk of stroke: a dose-response meta-analysis of prospective cohort studies. J Stroke Cerebrovasc Dis. 2016;25:1177–86. doi: 10.1016/j.jstrokecerebrovasdis.2016.01.040. [DOI] [PubMed] [Google Scholar]
- 28.Larsson SC, Virtamo J, Wolk A. Total and specific fruit and vegetable consumption and risk of stroke: a prospective study. Atherosclerosis. 2013;227:147–52. doi: 10.1016/j.atherosclerosis.2012.12.022. [DOI] [PubMed] [Google Scholar]
- 29.Verly E, Jr, Steluti J, Fisberg RM, Marchioni DM. A quantile regression approach can reveal the effect of fruit and vegetable consumption on plasma homcysteine levels. PLoS One. 2014;9:e111619. doi: 10.1371/journal.pone.0111619. [DOI] [PMC free article] [PubMed] [Google Scholar]
- 30.Truelsen T, Nielsen N, Boysen G, Grønbæk M. Self-reported stress and risk of stroke the Copenhagen City Heart Study. Stroke. 2003;34:856–62. doi: 10.1161/01.STR.0000062345.80774.40. [DOI] [PubMed] [Google Scholar]
- 31.Rose S, van der Laan MJ. Why match? Investigating matched case-control study designs with causal effect estimation. Int J Biostat. 2009;5:1. doi: 10.2202/1557-4679.1127. [DOI] [PMC free article] [PubMed] [Google Scholar]
- 32.Owolabi M, Sarfo F, Howard VJ, et al. Stroke in indigenous Africans, African Americans, and European Americans: interplay of racial and geographic factors. Stroke. 2017;48:1169–75. doi: 10.1161/STROKEAHA.116.015937. [DOI] [PMC free article] [PubMed] [Google Scholar]
Associated Data
This section collects any data citations, data availability statements, or supplementary materials included in this article.