

Abstract
Older adults who ultimately develop dementia experience accelerated cognitive decline long before diagnosis. A similar acceleration in cognitive decline occurs in the years before death as well. To evaluate preclinical and terminal cognitive decline, past researchers have incorporated change points in their analyses of longitudinal data, identifying point estimates of how many years prior to diagnosis or death that decline begins to accelerate. The current systematic review aimed to summarize the published literature on preclinical and terminal change points in relation to mild cognitive impairment (MCI), dementia, and death, identifying the order in which cognitive and neurological outcomes decline and factors that modify the onset and rate of decline. A systematic search protocol yielded 35 studies, describing 16 longitudinal cohorts modeling change points for cognitive and neurological outcomes preceding MCI, dementia, or death. Change points for cognitive abilities ranged from 3-7 years prior to MCI diagnosis, 1-11 years prior to dementia diagnosis, and 3-15 years before death. No sequence of decline was observed preceding MCI or death, but the following sequence was tentatively accepted for Alzheimer’s disease: verbal memory, visuospatial ability, executive functions and fluency, and lastly verbal IQ. Some of the modifiers of the onset and rate of decline examined by previous researchers included gender, education, genetics, neuropathology, and personality. Change point analyses evidence accelerated decline preceding MCI, dementia, and death, but moderators of the onset and rate of decline remain ambiguous due to between-study modeling differences, and coordinated analyses may improve comparability across future studies.
Keywords: change point, mild cognitive impairment, dementia, cognitive decline, systematic review
An estimated 5.5 million Americans are currently living with Alzheimer’s disease (AD); and with the aging baby boomer generation and longer life expectancies, it is anticipated that this number will exceed 13 million by the year 2050 (Alzheimer’s Association, 2017). Additionally, many individuals who experience subjective cognitive decline or Mild Cognitive Impairment (MCI) present with AD biomarkers (e.g., neurodegeneration, Meiberth et al., 2015, Spulber et al., 2012; amyloid burden, Amariglio et al., 2012) and some will go on to develop AD or another type of dementia (Mitchell & Shiri-Feshki, 2009). Individuals who ultimately receive a diagnosis of MCI or dementia typically have observable neurological and cognitive differences many years prior to diagnosis (Bäckman, Jones, Berger, Laukka, & Small, 2005; Ewers, Sperling, Klunk, Weiner, & Hampel, 2011). An appreciation for these preclinical differences has enhanced research focus on the early detection of cognitive change over the course of aging.
Previous cross-sectional research has identified varying effects of preclinical AD on different domains of cognitive functioning (Bäckman et al., 2005). Although cross-sectional approaches offer insight into between-group differences, individual differences in within-person change can only be evaluated through longitudinal data and analysis. A longitudinal evaluation of the preclinical period has offered insight into when older adults undergo a change point over the course of cognitive aging, indicating an acceleration in the rate of cognitive decline preceding diagnosis (i.e., MCI or dementia) or death (i.e., terminal decline/drop; Palmore & Cleveland, 1976; Siegler, 1975). These change points often appear years before diagnosis or death, providing insight into the sensitivity of different indicators exhibiting the earliest onset of accelerated decline.
Originally pioneered by researchers on HIV/AIDS (Kiuchi, Hartigan, Holford, Rubinstein, & Stevens, 1995; Lange, Carlin, & Gelfand, 1992), change point studies are not unique to cognitive aging research, but they have become increasingly popular within the field of aging since first applied to detect the onset of accelerated change in years prior to dementia (Hall, Lipton, Sliwinski, & Stewart, 2000; Joseph et al., 1999). The published literature on preclinical and terminal decline change points has grown extensively, analyzing data of multiple international cohorts from Australia (Batterham, Mackinnon, & Christensen, 2011), Canada (MacDonald, Hultsch, & Dixon, 2011), France (Jacqmin-Gadda, Commenges, & Dartigues, 2006), Sweden (Laukka, MacDonald, Fratiglioni, & Backman, 2012), the United Kingdom (Muniz-Terrera, van den Hout, Piccinin, Matthews, & Hofer, 2013; Muniz Terrera, Minett, Brayne, & Matthews, 2014), and the United States (Grober et al., 2008; Hall et al., 2000, 2001; Hall, Ying, Kuo, & Lipton, 2003; Wilson, Beckett, Bienias, Evans, & Bennett, 2003; Wilson, Beck, Bienias, & Bennett, 2007; Wilson, Leurgans, Boyle, & Bennett, 2011; Wilson, Leurgans, Boyle, Schneider, & Bennett, 2010; Wilson et al., 2012a; Wilson, Segawa, Hizel, Boyle, & Bennett, 2012b; Yu & Ghosh, 2010). The international focus on change points aligns with the global scientific goal to identify the earliest possible biomarkers of neurodegenerative processes and modifiable risk factors associated with the onset or rate of cognitive decline (Alzheimer’s Association, 2017). In turn, change point studies have focused not just on the acceleration of cognitive decline, but also the acceleration of neurological changes (Carlson, 2008; Silbert et al., 2012) and variables that may delay or slow preclinical or terminal decline (e.g., education, cognitive activity; Hall et al., 2007; Hall et al., 2009; Muniz Terrera et al., 2014).
Despite the coherent mission of researchers to identify biomarkers and modifiable risk factors, change point studies vary considerably with respect to design, statistical model, inclusion of covariates, and the outcomes used as dependent variables. As such, there is a lack of consensus regarding the order in which different neurological and cognitive domains decline and the factors that are associated with the onset and rate of decline in later age. Anticipating that researchers will continue to conduct change point analyses on longitudinal datasets of older adults, the current literature must be reviewed to determine common and disparate findings across studies, informing future researchers about appropriate analytical practices, which covariates to include in their models, and evidence for differential sensitivity of particular cognitive and neurological measures to detect within-person change and change points. In turn, the current systematic review focused on cognitive change occurring during the latter stages of life, either preceding an age-related disease process or death. Both preclinical and terminal decline are relevant to researchers examining longitudinal data of aging cohorts, and both have been extensively considered in the context of aging research (Sliwinski, Hofer, & Hall, 2003; Sliwinski, Hofer, Hall, Bushke, & Lipton, 2003). To synthesize the many studies examining cognitive or neurological decline among older adults, the current systematic review aimed to summarize the published literature on change point models indicating the onset of accelerated decline in relation to MCI, dementia, and death, identifying (a) the order in which cognitive and neurological outcomes accelerate in their rate of decline preceding each clinical endpoint and (b) factors that modify the onset or rate of decline.
Method
The report for this systematic review was prepared following the Preferred Reporting Items for Systematic Reviews and Meta-Analyses (PRISMA) Statement (Moher, Liberati, Tetzlaff, Altman, & the PRISMA Group, 2009).
Literature search
The key words, subject headings and index terms used in the electronic search protocol included terms associated with MCI and dementia, terminal decline, cognitive and neurological outcomes, longitudinal methods, and change point analyses. The full list of search terms is provided in the supplementary materials. The electronic search involved four databases (i.e., CINHAHL Complete, MedLine with Full Text, PSYCInfo, and PSYCArticles) and was conducted in March 2017, with no filters placed on the search findings. Two reviewers independently reviewed the electronic search results to ensure no eligible studies were missed (Edwards et al., 2002). A manual search was also conducted, inclusive of reference lists, targeted journals not indexed in psychological and biomedical databases (i.e., Journal of Applied Statistics, Computational Statistics and Data Analysis), and articles known by the authors but not detected by the electronic search strategy. A post-hoc search using the statistics-oriented database, The Current Index to Statistics, was also conducted as part of the manual search strategy, using multiple combinations of the term “change point” and cognition or dementia-related search terms.
Eligibility criteria
For inclusion in the systematic review, authors needed to (a) report a longitudinal study involving four or more measurement waves and (b) test a change point model for (c) either a cognitive or neurological outcome. The researchers needed to (d) test a model with a pre-clinical or terminal decline change point, modeled in relation to MCI onset, dementia onset, or death (i.e., models using age or time-in-study as the time metric were ineligible). Participants included in analyses (e) needed to be free of concurrent neurological disorders other than dementia that could contribute to cognitive decline (e.g., Parkinson’s disease, stroke). If a small subsample (n < 5% of the sample) of participants were diagnosed with a concurrent neurological condition at baseline or during the course of the study, this study was included in the systematic review; however, if a majority of the sample was diagnosed with a concurrent neurological condition at baseline (e.g., Parkinson’s disease; Aarsland, Muniz, & Matthews, 2011; Johnson, Langford, Garnier-Villarreal, Morris, & Galvin, 2016), the study was deemed ineligible. Further, (f) studies reporting samples with the majority experiencing early-onset dementia (i.e., mean age at onset <65) were also deemed ineligible (Aguirre-Acevedo et al., 2016). Eligible articles needed to (g) be published in an academic journal or book and (h) be written in the English language.
Data extraction
Two reviewers separately examined articles identified through the literature review to determine their eligibility for inclusion in the research synthesis. For all eligible studies, two reviewers independently extracted information following a common data collection instrument. The extracted data included participant characteristics, study characteristics, and quantitative results. The participant characteristics included the sample size of participants that were included in the change point analysis, the baseline demographics of the sample (i.e., mean age, gender composition, years of education, ethnicity, and the percent with an apoE ε4 allele, APOE ε4), and the operational definition of MCI or dementia used for the sample. Study characteristics included the study duration in years, maximum number of measurement waves completed by any participant included in the analysis, the mean number of measurement waves completed by all participants included in the analysis, the mean number of years follow-up for all participants included in the analysis, and the interval duration between measurement occasions. Model information was recorded, including whether the estimation approach was Bayesian or frequentist and what covariates were included in the analysis. The names of the cognitive and neurological outcomes included in change point analyses were also extracted along with the change points for each outcome in relation to diagnosis or death along with a 95% Confidence or Credible Interval.
Individual and across study bias
The risk of bias within individual studies was not easily operationalized, as the criteria typically used to assess individual study bias and study quality are often written for intervention studies involving randomized controlled trials (Sanderson, Tatt, & Higgins, 2007; Vandenbroucke et al., 2007). Although certain recommendations for quality reporting in observational longitudinal analyses have been previously proposed (Tooth, Ware, Bain, Purdie, & Dobson, 2005), no study quality instrument designed for longitudinal change point analyses exists. Although individual study bias was not quantified, certain study characteristics (e.g., mean number of measurement waves in combination with study duration and maximum number of measurement waves) gave a proxy for attrition bias, with these findings qualitatively interpreted in aggregate within the discussion. As well, bias across studies was not quantified, but certain types of across study bias (e.g., publication bias, selective reporting) was covered in the discussion as potentially affecting the interpretation of results.
Results
Literature Search
Figure 1 provides a flow diagram of the systematic review process. Among the 81 articles originally identified through electronic and manual search strategies, a total of 35 articles ultimately met eligibility criteria for inclusion in the systematic review. References for full text articles that were reviewed by the authors, but did not ultimately meet inclusion criteria are provided in the supplementary materials and sorted by their reason for exclusion. Among these 35 articles, 4 evaluated change points in relation to MCI diagnosis, 13 evaluated change points in relation to dementia diagnosis, one evaluated change points in relation to both MCI and dementia diagnosis, and 17 evaluated change points in relation to death. A total of 16 different longitudinal cohorts were represented across the articles, including the Alzheimer’s Disease Centers Neuropsychological Database Initiative (Ji, Xiong, & Grundman, 2003), Bronx Aging Study (BAS; Hall et al., 2000, 2001, 2003, 2007, 2009; Sliwinski et al., 2006), Baltimore Longitudinal Study of Aging (Grober et al., 2008), Cambridge City over 75 Cohort Study (CC75C; Muniz-Terrera et al., 2013, 2014; van den Hout, Muniz-Terrera, & Matthews, 2011), Canberra Longitudinal Study (Batterham et al., 2011), Gerontological and Geriatric Population Study (H70; Thorvaldsson et al., 2008; Thorvaldsson et al., 2011), Honolulu Asia Aging Study (Yu & Ghosh, 2010), Kungsholmen Project (KP; Laukka et al., 2012; Thorvaldsson et al., 2011), Monongahela Valley Independent Elders Survey (Dodge, Wang, Chang, & Ganguli, 2011), Oregon Brain Aging Study (OBAS; Buracchio, Dodge, Howieson, Wasserman, & Kaye, 2010; Carlson, 2008; Howieson et al., 2008; Silbert et al., 2012), Origins of Variance in the Old-old Study (van den Hout, Muniz-Terrera, & Matthews, 2013), Paquid Project (Jacqmin-Gadda et al., 2006), Religious Orders Study/Memory and Aging Project (ROS/MAP; Boyle et al., 2013; Li, Dowling, & Chappell, 2015; Wilson et al., 2003, 2007, 2010, 2011, 2012a, 2012b, 2015; Yu et al., 2013), Victoria Longitudinal Study (MacDonald et al., 2011), and lastly a cohort from the Washington University School of Medicine Alzheimer’s Disease Research Center (Johnson, Storandt, Morris, & Galvin, 2009).
Figure 1.
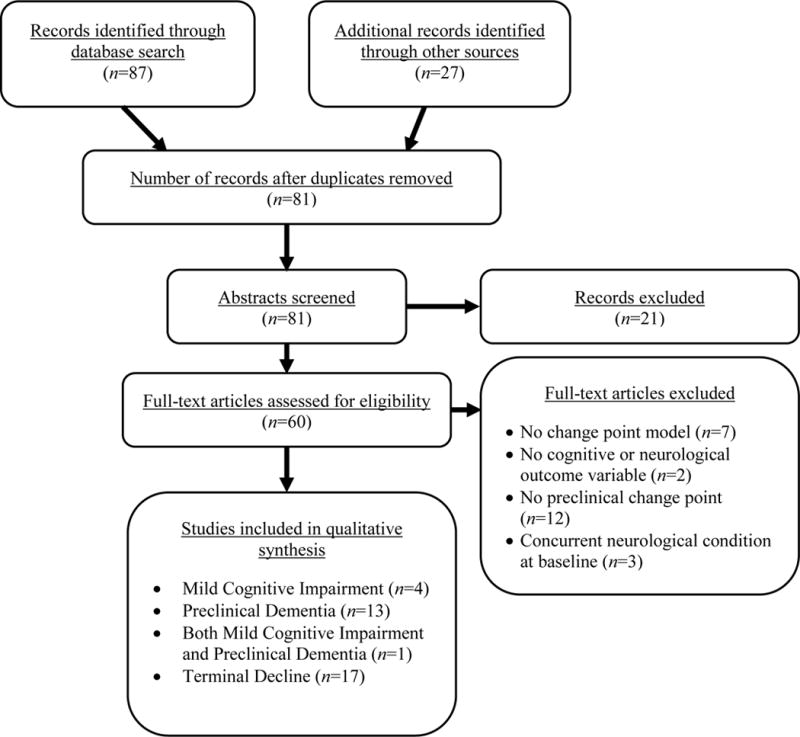
Flowchart of Systematic Review
The following sections will discuss the findings of change point studies based on their clinical endpoint: MCI, dementia, or death. Each section will cover the demographic information of the samples evaluated, discuss study design characteristics, and summarize the findings of the change point analyses, including the effects of moderating variables that influenced either the location of the change point in relation to diagnosis or death or the rate of decline before or after the change point. For MCI, dementia, and terminal decline change point studies, respectively, Tables 1-3 summarize the demographic information for the participants included in each analysis, and Tables 4-6 summarize the design characteristics and reported change points.
Table 1.
MCI Change Point Studies: Participant Characteristics
| Cohort | Study | n* | Age (SD) | Age Range | % Male | Education ( years) | % White | % APOE ε4+ | MCI Definition |
|---|---|---|---|---|---|---|---|---|---|
| OBAS | Buracchio et al. (2010) | 95 | 83.5 (7.0) | 65-98 | 39.0 | 14.7 | – | 27.7 | ≥2 consecutive CDRs ≥0.5; No functional impairment |
| Carlson et al. (2008) | 37 | 84.8 (6.9) | 66-97 | 35.1 | 13.8 | – | 24.3 | Same as above | |
| Howieson et al. (2008) | 68 | 84.9 (5.0) | 65-110 | 33.8 | 14.6 | 98.1† | – | Same as above | |
| Silbert et al. (2012) | 134 | 84.8 (5.9) | 65-102 | 38.8 | 14.2 | – | 20.9 | Same as above | |
| ROS/MAP | Wilson et al. (2011) | 742 | 78.1 | – | 29.0 | 16.6 | 90.7† | – | Cognitive impairment was determined by educational adjusted cutoff scores and a neuropsychologist. Participants with cognitive impairment, but not meeting criteria for dementia, were classified as MCI, and divided into amnestic and non-amnestic subtypes |
Note. % APOE ε4+ = Percent positive for the Apolipoprotien E e4 allele; CDR = Clinical Dementia Rating Scale; Educ. = Education; MCI = Mild Cognitive Impairment; OBAS = Oregon Brain Aging Study; ROS/MAP = Religious Orders Study/Memory and Aging Project
n values correspond to the sample size of participants that ultimately received an MCI diagnosis and were included in analysis.
Value derived from the full sample, rather than just the sub-sample developing MCI.
Table 3.
Terminal Decline Change Point Studies: Sample Size Included in Analysis and Baseline Participant Characteristics
| Cohort | Study | n* | Age (SD) | Age Range | % Male | Educ. ( years or specified) | % White | % APOE ε4+ |
|---|---|---|---|---|---|---|---|---|
| BAS | Sliwinski et al. (2006) | 445 | 79.3 (3.1) | 75-85 | – | – | – | – |
| CC75C | Muniz-Terrera et al. (2013) | 1,896 | 81 | ≥75 | 35.0 | – | – | – |
| Muniz-Terrera et al. (2014) | 2,078† | 81 | ≥75 | 35.0 | Left school at age 14.8 years | – | – | |
| van den Hout et al. (2011) | 156 | 81.6 | ≥75 | – | – | – | – | |
| CLS | Batterham et al. (2011) | 687 | 77.3 (5.1) | ≥70 | 50.9‡ | 11.4 | – | – |
| H70 | Thorvaldsson et al. (2008) | 288 | 70 | All 70 | 43.8 | – | – | – |
| MoVIES | Dodge et al. (2011) | 613 | 74.3 (6.0) | 64-95 | 49.8 | 54.3% w/high school or more | – | – |
| MAP | Wilson et al. (2007) | 115 | 83.7 (5.1) | – | 41.7 | 14.7 | 91.6§ | 29.5 |
| OCTO-Twin | van den Hout et al. (2013) | 656 | – | ≥80 | – | – | – | – |
| ROS | Wilson et al. (2003) | 122 | 80.5 (6.3) | – | 48.4 | 18.3 | – | – |
| Wilson et al. (2010) | 354 | – | – | 41.0 | – | 94.4 | – | |
| Wilson et al. (2012a) | 124 | 77.7 (6.3) | 65-93 | 37.9 | 18.0 | – | – | |
| Wilson et al. (2012b) | 174 | 78.2 (6.1) | – | 38.5 | 18.1 | 96.6 | – | |
| ROS/MAP | Boyle et al. (2013) | 573 | – | – | 36.05 | 16.55 | 95¶ | – |
| Wilson et al. (2015) | 309 | – | ≥50 | 35.3 | 18.2 | – | – | |
| Yu et al. (2013) | 581 | 88.9 (6.5) | 71-108 | 34.4 | – | – | 23.8 | |
| VLS | MacDonald et al. (2011) | 265 | 72.7 (6.4) | 55-85# | – | – | – | – |
Note. % APOE ε4 = Percent positive for the Apolipoprotein E e4 allele; BAS = Bronx Aging Study; CC75C = Cambridge City over 75 Cohort Study; CLS = Canberra Longitudinal Study; Educ. = Education; H70 = Gerontological and Geriatric Population Study; MoVIES = Monongahela Valley Independent Elders Survey; OCTO-Twin = Origins of Variance in the Old-old Study; MAP = Memory and Aging Project; ROS = Religious Orders Study; VLS = Victoria Longitudinal Study.
n values correspond to the sample size of participants that ultimately died over the course of the study and were included in analysis.
Muniz-Terrera et al. (2014) specified that only five participants from the baseline cohort were alive at the time of analysis. It is not clear from the article whether the n value reported was the sample size included in analysis and whether this value is inclusive of participants that did not pass away during follow-up.
Percent Male for Batterham et al. (2011) derived from the full sample, not just participants dying during follow-up.
Percent White for Wilson et al. (2007) derived from the full sample, not just participants dying during follow-up.
Values taken from full sample reported in manuscript, although only subsample of participants used in change point analysis.
For MacDonald et al. (2011), the age range was provided for all participants in the VLS, not just those dying at follow-up.
Table 4.
MCI Change Point Studies: Study Design Characteristics, Outcomes and Change Points
| Cohort | Authors (Year) | Duration (Years) |
Max # MWs |
# MWs: (SD) |
Years Follow-up (SD) | Interval Duration (Years) |
Bayesian/ Frequentist; Random/ Fixed CP |
Covariates | Outcome | Construct | CP (95% CI) in Years to Dx |
|---|---|---|---|---|---|---|---|---|---|---|---|
| OBAS | Buracchio et al. (2010) | 20 | 20 | – | 10.5 (4.0) | 1 | Frequentist; Fixed CP | Age, education, sex, APOE ε4 status, baseline speed, stroke, and depression | Gait Speed | Motor | Men/Women: −12.1 (Unknown to −8.1) Men: −14.2 (Unknown to −8.7) Women: −6.0 (−9.5 to −4.6) |
| Finger Tapping: Dominant Hand | Motor | Men/Women: 3.8 (1.7 to 4.7) Men: −5.9 (−10.0 to 6.5) Women: −3.0 (0.2 to 4.9) |
|||||||||
| Finger Tapping: Non-Dominant Hand | Motor | Men/Women: 2.7 (−0.3 to 4.3) Men: 6.2 (−7.7 to 6.8) Women: 0.4 (−1.8 to 2.9) |
|||||||||
| Carlson et al. (2008) | 15 | 12 | 6.0 (3.3) | 6.3 (3.6) | 1 | Frequentist; Fixed CP | – | Ventricular Volume | Neurological | −2.3 (−5.6 to −0.3) | |
| Howieson et al. (2008) | – | – | – | 8.0 (2.8) | 1 | Frequentist; Fixed CP | – | LM I, Story A | Verbal Memory | −2.9 (−4.0 to −1.5) | |
| LM II, Story A Animal Fluency Block Design |
Verbal Memory Fluency Visuospatial Ability |
−3.1 (−4.5 to −2.1) −3.9 (−5.1 to −3.1) −3.9 (−5.4 to −2.9) |
|||||||||
| Silbert et al. (2012) | 19.6 | 15 | M = 4.0 | 10.4 (4.1) | 1 | Frequentist; Fixed CP | Age, gender, APOE ε4 status, diabetes, HTN, smoking, stroke/TIA, and baseline intracranial and hippocampal volume | WMH | Neurological | −10.6 (Unknown to −5.2) | |
| Ventricular CSF Volume | Neurological | −3.7 (−5.6 to −0.8) | |||||||||
| ROS/MAP | Wilson et al. (2011) | 16* | – | – | 7.8 (3.9)* | 1 | Frequentist; Fixed CP | Age, sex, and education | Global Composite | Global | Amnestic MCI: −6.7 Non-amnestic MCI: −5.2 |
Note.
Values based on full sample, not just MCI sub-sample. APOE ε4 = Apolipoprotein E e4 allele; CI = Confidence or Credible Interval; CLS = Canberra Longitudinal Study; CP = Change Point; CSF = Cerebrospinal Fluid; HTN = Hypertension; LM = Logical Memory; MWs = Measurement Waves; OBAS = Oregon Brain Aging Study; ROS/MAP = Religious Orders Study/Memory and Aging Project; WMH = White Matter Hyperintensities.
Table 6.
Terminal Decline Change Point Studies: Study Design Characteristics, Outcomes and Change Points
| Cohort | Authors (Year) | Duration (Years) |
Max # MWs |
# MWs: (SD) |
Years Follow-up (SD) |
Interval Duration (Years) |
Bayesian/ Frequentist; Random/ Fixed CP |
Covariates | Outcome | Construct | CP (95% CI) in Years to Death |
|---|---|---|---|---|---|---|---|---|---|---|---|
| BAS | Sliwinski et al. (2006) | - | - | - | 5.7 | - | Frequentist; Fixed CP | Dementia diagnosis | BSRT | Verbal Memory | −8.4 (−9.8 to −7.1) |
| CC75C | Muniz-Terrera et al. (2013) | 17 | 7 | – | – | – | Bayesian; Both | Education, gender, age at death, baseline physical and cognitive impairment | MMSE | Global | −7.7 (−8.1 to −7.2)* |
| Muniz-Terrera et al. (2014) | 21 | 7 | – | – | 2-5 | Bayesian; Random CP | Education, gender, age at death, baseline physical and cognitive impairment | MMSE | Global | −6.2 (−6.6 to −5.7) | |
| van den Hout et al. (2011) | 21 | 7 | – | – | 2-5 | Bayesian; Random CP | – | MMSE | Global | −6.1 | |
| CLS | Batterham et al. (2011) | 12 | 4 | 2.0† | – | – | Frequentist; Fixed CP | Education, gender, heart attack/hypertension, grip strength, smoking, functional ability, disease count, and depression | MMSE | Global | −7.1 (−9.3 to −6.2) |
| Symbol-Letters Modalities Test Brief Episodic Memory Tasks‡ | Processing Speed Memory |
−8.5 (−11.2 to −6.0) −6.6 (−7.1 to −5.3) |
|||||||||
| H70 | Thorvaldsson et al. (2008) | 30 | 12 | – | – | ~2.5 | Frequentist; Fixed CP | – | Synonym Test Block Design Figure Identification |
Verbal IQ Visuospatial Ability Processing Speed |
−6.6 (−11.7 to −4.3) −7.8 (−10.6 to −6.3) −14.8 (−16.6 to −10.8) |
| MoVIES | Dodge et al. (2011)§ | 14 | 9 | – | 6.8 (4.0) | 1.5 | Frequentist; Fixed CP | Education, sex, sampling group, and practice effects | Learning Composite Memory Composite Psychomotor Speed Composite Executive Function Composite Language Composite |
Learning Memory Processing Speed Executive Function Language |
−7.4 (−8.9 to −5.4) −7.6 (−9.9 to −5.3) −9.4 (−13.1 to −5.8) −9.8 (Unknown to −8.1) −9.8 (Unknown to −8.3) |
| MAP | Wilson et al. (2007) | 9 | 9 | 4.0 | – | 1 | Frequentist; Fixed CP |
Education, age, sex | Global Composite | Global | −3.5¶ |
| OCTO- Twin |
van den Hout et al. (2011) | 10 | 5 | 3.1# | - | 2 | Frequentist; Random CP | - | MMSE | Global | −5.8 |
| ROS | Wilson et al. (2003)** | 8 | 9 | 5.6 | 1 | Frequentist; Fixed CP | Age, sex, education, medical conditions, disability |
Global Composite | Global | −3.6 | |
| Perceptual Speed Episodic Memory Semantic Memory Working Memory Visuospatial Ability |
Processing Speed Verbal Memory Language Executive Function Visuospatial Ability |
−2.8 −3.4 −3.3 −3.8 −6.0 |
|||||||||
| Wilson et al. (2010) | 13 | 14 | - | 6.4 (3.2) | 1 | Frequentist; Fixed CP | - | Global Cognition Summary Measure | Global | −4.3 | |
| Wilson et al. (2012a) | 16 | 10.9 (1.8) | 1 | Bayesian; Random CP | Age at death, vascular risk factors and conditions, plagues/tangles, Lewy bodies, cerebral infarcts | Global Cognition Summary Measure | Global | −2.8 (−3.2 to −2.4) | |||
| Episodic Memory Semantic Memory Working Memory Perceptual Speed Motor Function Summary Measure Manual Strength Manual Dexterity Gait |
Verbal Memory Language Executive Function Visuospatial Ability Motor Motor Motor Motor |
−3.1 (−3.6 to −2.6) −2.7 (−3.1 to −2.3) −2.8 (−3.5 to −2.4) −3.2 (−3.8 to −2.7) −2.5 (−2.9 to −2.1) −2.5 (−3.0 to −2.1) −2.4 (−2.7 to −2.1) −2.5 (−2.8 to −2.1) |
|||||||||
| Wilson et al. (2012b) | – | 16 | 10.2 (2.0) | – | 1 | Bayesian; Random CP | Age at death, sex, and education | Episodic Memory Semantic Memory Working Memory Perceptual Speed |
Verbal Memory Language Executive Function Visuospatial Ability |
−2.6 −2.3 −2.4 −2.6 |
|
| ROS/MAP | Boyle et al. (2013) | 18 | 18 | 8.6 (3.0) | - | 1 | Bayesian; Random CP | Global AD pathology, amyloid, tangles, gross and micro infarcts, Lewy bodies | Global Cognition Summary Measure | Global | −3.0 (−3.2 to −2.8) |
| Wilson et al. (2015) | – | – | – | 10.7 (4.0) | 1 | Bayesian; Random CP | Age at death, sex, education, conscientiousness, neuroticism, depressive symptoms, tangles, gross and micro infarcts, Lewy bodies, hippocampal sclerosis | Global Cognition Summary Measure | Global | −3.2 (−3.6 to −2.8) | |
| Yu et al. (2013) | 17 | – | – | 8.0 | 1 | Bayesian; Random CP | Age, sex, education, APOE ε4 status, global AD pathology, amyloid, tangles, gross and micro infarcts, Lewy bodies | Global Cognition Summary Measure | Global |
APOE ε4-: −3.2 (−3.5 to −2.9) APOE ε4+: −4.0 (−4.7 to −3.2)†† |
|
| VLS | MacDonald et al. (2011) | 12 | 5 | 2.0‡‡ | 8.1 | 3 | Frequentist; Fixed CP |
Age at death | Semantic Verification Sentence Construction Word Recall Fact Recall Vocabulary |
Processing Speed Executive Function Verbal Memory Verbal IQ Verbal IQ |
−9.5 −3.5 −6.8 −8.2 −6.4 |
Note. AD = Alzheimer’s disease; ADC NDI = Alzheimer’s Disease Centers Neuropsychological Database Initiative; AMNART = American Version of the Nelson Adult Reading Test; APOE ε4 = Apolipoprotein E e4 allele; BAS = Bronx Aging Study; BLSA = Baltimore Longitudinal Study of Aging; BSRT = Buschke Selective Reminding Test; BVRT = Benton Visual Retention Test; CC75C = Cambridge City over 75 Cohort Study; CDR = Clinical Dementia Rating Scale; CI = Confidence or Credible Interval; CLS = Canberra Longitudinal Study; CSF = Cerebrospinal Fluid; FCSRT = Free and Cued Selective Reminding Test; H70 = Gerontological and Geriatric Population Study; KP = Kungsholmen Project; LM = Logical Memory; MMSE = Mini Mental Status Examination; MoVIES = Monongahela Valley Independent Elders Survey; MWs = Measurement Waves; OBAS = Oregon Brain Aging Study; OCTO-Twin = Origins of Variance in the Old-old Study; PP = Paquid Project; MAP = Memory and Aging Project; ROS = Religious Orders Study; VaD = Vascular Dementia; VLS = Victoria Longitudinal Study; WAIS-III PIQ = Wechsler Adult Intelligence Scale, Third Edition, Performance IQ; WMH = White Matter Hyperintensities; WMS = Wechsler Memory Scale; WUSM ADRC = Washington University School of Medicine Alzheimer’s Disease Research Center.
Muniz-Terrera et al. (2013) reported a change point of −5.66 (−6.08 to −5.24), but subtracted 2 years from this value because time zero was coded as two years to death.
For Batterham et al. (2011), the average number of visits was calculated by dividing the total number of observations (i.e., 1406) by the number of participants (i.e., 687).
Brief episodic memory tasks included both visual and verbal recall (e.g., word, face, name, and address recall; and figure reproduction)
Dodge et al. (2011) reported change points with and without controlling for practice effects. Those reported here are the change points controlling for practice effects.
Wilson et al. (2007) did test change points for other domains, but either did not find a difference between the global change point and the construct-specific change points or found the identification of a change point ambiguous based on profile likelihood values.
For van den Hout et al. (2011), the mean number of observations was calculated by dividing the number of records (i.e., 2024) by the number of participants (i.e., 656).
For Wilson et al. (2007), the longitudinal design data were taken for the full sample, not just those dying at follow-up.
For Yu et al. (2013), the change point for APOE ε4 carriers was calculated by adding the additional burden for carriers reported by the authors to the change point and 95% CI reported for non-carriers.
For MacDonald et al. (2011), the mean number of observations was calculated by summing the number of measurement waves completed by participants and dividing that sum by the total number of participants.
Preclinical MCI Change Point Studies
Demographic characteristics
Five studies examined change points in relation to the diagnosis of MCI, with four analyzing participant data from the OBAS (Buracchio et al., 2010; Carlson, 2008; Howieson et al., 2008; Silbert et al., 2012) and one analyzing participant data from the ROS/MAP cohorts (Wilson et al., 2011). For the OBAS, MCI was defined as having two or more consecutive scores of ≥0.5 on the Clinical Dementia Rating Scale (Morris, 1993) along with no functional impairment. For the ROS/MAP cohorts, participant were classified as having MCI if they did not meet criteria for dementia, but presented with impairment in one of five domains of cognitive functioning (i.e., orientation, attention, memory, language, and visuospatial ability) based on educationally adjusted cutoff scores for 11 individual cognitive tests and the judgement of a neuropsychologist. The ROS/MAP MCI sample was subdivided into amnestic and non-amnestic subtypes. The sample sizes with MCI ranged from 37 to 742 across studies, with a baseline age of 78.1 years for ROS/MAP and about 84 years for the OBAS studies. The ROS/MAP sample was majority female (i.e., 71.0%) and well-educated (i.e., 16.6 years). The OBAS sample was predominantly female (~60-65%), White (~98%) and well-educated, with participants having about 13 to 14 years of education on average. Roughly 20-25% of OBAS participants were carriers of the APOE ε4 allele.
Design characteristics
The ROS/MAP and OBAS studies involved samples with up to 16 years and 20 years of follow-up, respectively. Both studies had annual neuropsychological assessments, while just the OBAS had annual neurological assessments. The average number of years follow-up ranged from 6.3 to 10.5 depending on the sample used for each study. The modeling approach for both the ROS/MAP and OBAS data was entirely based on profile likelihood methods with fixed change points (Hall et al., 2000).
Summary of findings
Figure 2 provides a forest plot of change points for the MCI studies, organized by the type of outcome evaluated (i.e., motor, neurological, and cognitive). On three measures of motor function (i.e., gait speed and finger tapping for each hand), men showed an earlier decline than women. The onset of decline in finger tapping occurred near or even after MCI diagnosis, while gait speed showed the earliest change point for any outcome: −6.0 years (95% CI: −9.5, −4.6) and −14.2 years (Unknown, −8.7) before diagnosis for men and women, respectively. In comparison to change point analyses in relation to dementia or terminal decline, only MCI studies explored preclinical change points for neurological outcomes. As shown visually in Figure 2, motor and neurological change points were on average earlier than cognitive change points; however, the 95% CIs around change points for cognitive and neurological outcomes were far broader than those observed for cognitive outcomes. The participants with MCI from the ROS/MAP were subdivided into amnestic and non-amnestic MCI. For a global cognitive composite score, the onset of decline for amnestic MCI participants (i.e., −6.67 years) preceded the onset of decline for non-amnestic MCI participants by about 1.5 years.
Figure 2. Change Point Estimates with 95% Confidence Intervals for MCI Studies by Outcome Type.
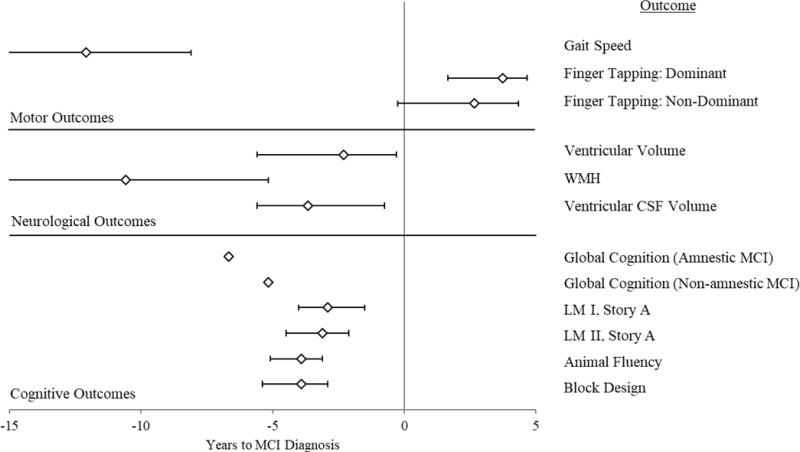
Note. All change point estimates derive from the Oregon Brain Aging Study (Buracchio et al., 2010; Carlson, 2008; Howieson et al., 2008; Silbert et al., 2012), except for both Global Cognition change points, which derive from the Religious Orders Study and Memory and Aging Project (Wilson et al., 2011). CSF = Cerebrospinal Fluid; LM = Logical Memory; MCI = Mild Cognitive Impairment; WMH = White Matter Hyperintensities. Lower end confidence intervals for Gait Speed and WMH were unknown. All change points for motor outcomes come from the full sample (Men and Women; Buracchio et al., 2010).
Preclinical Dementia Change Point Studies
Demographic characteristics
Fourteen studies examined change points in cognitive functioning in relation to dementia diagnosis. A total of ten cohorts were evaluated in these analyses, with two of these cohorts combined and evaluated as a single sample in two studies (i.e., ROS/MAP; Li et al., 2015; Wilson et al., 2011). Taking the largest sample size reported by a study for each cohort, a total of 1,994 participants that progressed to dementia during follow-up were represented in the systematic review. The mean baseline age of participants across studies ranged from 70 to 82 years. Three cohorts reported ethnicity data: the BAS sample was over 90% White (Hall et al., 2007; Hall et al., 2009), the ROS/MAP sample was 87.9% White (Wilson et al., 2011), and the Honolulu Asia Aging Study was entirely Japanese-American (Yu & Ghosh, 2010). Three samples reported the percent prevalence of the APOE ε4 allele in their sample, with values of 18.0% (Yu & Ghosh, 2010), 27.0% (Johnson et al., 2009) and 29.6% (Li et al., 2015). The education of the samples varied substantially, from samples where most participants had some college education (Grober et al., 2008; Ji et al., 2003; Johnson et al., 2009) to samples where most participants had equal to or fewer than 12 years (Hall et al., 2007; Li et al., 2015), fewer than 8 years (Laukka et al., 2012), and fewer than 6 years (Thorvaldsson et al., 2011). The majority of participants from one sample did not complete primary school (Jacqmin- Gadda et al., 2006).
In terms of dementia diagnosis, six cohorts used criteria from the Diagnostic and Statistical Manual for Mental Disorders, Third Edition (DSM-III; American Psychiatric Association, 1980) or Third Edition, Revised (DSM-III-R; American Psychiatric Association, 1987). One study considered alternative criteria for dementia (Cummings & Benson, 1992; White et al., 1996) in combination with the DSM-III-R criteria (Yu & Ghosh, 2010). In terms of subtypes of dementia, five studies (Grober et al., 2008; Hall et al., 2000; Laukka et al., 2012; Li et al., 2015; Wilson et al., 2011) cited specific criteria to define AD (McKhann et al., 1984), while two other studies (Hall et al., 2000; Laukka et al., 2012) cited criteria to define Vascular Dementia (Román et al., 1993) or Multi-Infarct Dementia (Rosen, Terry, Fuld, Katzman, & Peck, 1980). Two studies did not cite established criteria for diagnosing AD, but instead provided their own criteria (Johnson et al., 2009) or asserted the sample had an AD diagnosis without offering an operational definition (Ji et al., 2003).
Design characteristics
The cohorts used to estimate preclinical dementia change points ranged in years of follow-up from 9 years to up to 30 years. The interval between measurement waves varied by cohort from annual assessments to assessments occurring every three years. The average years of follow-up or number of measurement waves completed was not consistently reported across cohorts. In terms of analytical approach, most studies took a frequentist estimation approach with a fixed change point; however, one study applied a Bayesian approach (Yu & Ghosh, 2010) and two studies applied both Bayesian and frequentist approaches, calculating both fixed and random change points (Hall et al., 2003; Hall et al., 2001). One frequentist study calculated a random change point (Jacqmin- Gadda et al., 2006) and another conducted a quantile regression with a change point (Li et al., 2015).
Summary of findings
Among the dementia change point studies, a few different moderators were evaluated to determine their influence on components of the change point model (i.e., the change point and the slopes before and after the change point). These moderators included demographics (e.g., gender, education), frequency of engagement in cognitive activities, dementia subtype, genetic risk (i.e., presence of APOE ε4), and the cognitive construct evaluated.
Demographics
One study evaluated the effects of both gender and education on model components (Li et al., 2015). These researchers reported no gender or education-related differences for the change point, and further reported no gender differences for the rate of change before or after the change point. The effect of education on slopes before and after the change point was not discussed. Although no other studies evaluated the relationship between gender and model components, three additional studies examined the effect of education. Among the BAS cohort, participants experienced a delay in their verbal memory change point, as measured by the Buschke Selective Reminding Test (BSRT), of roughly 2 months (i.e., 0.21 years) for each year of additional education; and while there were no significant education-related differences in the rate of decline prior to the change point, the rate of decline following the change point was faster for individuals with more years of education (Hall et al., 2007).
An additional study that explored the effects of education on preclinical change found a similar pattern of results (Jacqmin- Gadda et al., 2006). The change point was delayed for participants with more education, where individuals with at least a primary school diploma had a median onset of accelerated decline at 90.3 years (89.3, 91.4) and individuals with either no education or without a primary school diploma had a median onset of accelerated decline at 69.7 years (65.0, 74.6). Following the change point, the rate of decline was more rapid for participants with a higher level of education, which meant that the median distance between the change point and dementia diagnosis was smaller for participants with more education (e.g., for a change point at 65 years, the age at dementia diagnosis was a median of 73.1 and 83.4 years for participants with high and low educational backgrounds, respectively). Another study found the same results (Yu & Ghosh, 2010), where participants with more than 10 years of education underwent a change point around 12 years later than participants with 10 or fewer years of education; however, those participants with more education declined more rapidly following the change point.
Frequency of cognitive activities
In the BAS, participants were queried at baseline for the frequency at which they engaged in cognitively engaging leisure activities (i.e., reading, writing, crossword puzzles, board/card games, group discussions, and playing music; Hall et al., 2009). For each additional day of cognitive activity (i.e., participation in one cognitively engaging activity for one day in a week), the change point for the BSRT tasks was delayed by a little more than 2 months (i.e., 0.18 years), but following the change point, preclinical decline occurred more rapidly for participants engaged in more cognitive activities. This pattern was observed for participants progressing to dementia and was replicated for a sub-sample of participants progressing to AD specifically. When education was added to the model, fit did not improve and an interaction between education and cognitive activity was non-significant, although both remained uniquely predictive of a delayed change point and a more rapid rate of preclinical decline.
Dementia subtype
Two studies evaluated the KP dataset (Laukka et al., 2012; Thorvaldsson et al., 2011). The first evaluation identified change points for different cognitive constructs in relation to dementia diagnosis in general (Thorvaldsson et al., 2011), whereas the second study explored differences in the location of the change point in relation to diagnosis for two different dementia types: AD and VaD (Laukka et al., 2012). These authors found that for every cognitive test except for Clock Reading, the onset of preclinical decline occurred earlier for AD than VaD by approximately two to four years. When AD and VaD samples were combined, the change points for the Block Design and Word Recall tasks were −8.3 years (Unknown, −5.4) and −8.6 years (Unknown, −6.2), respectively (Thorvaldsson et al., 2011); however, the change points for these tests were different when the sample was sub-divided based on dementia subtype. The earliest change point observed for AD patients involved the Block Design task (i.e., −9.6 years [Unknown, −6.8]), and the earliest change point observed for VaD involved Word Recall (i.e., −6.5 years [Unknown, −3.1]).
Genetic risk
Only one study evaluated the effect of genetic risk on the change point model parameters, using a quantile regression approach to determine the effect of moderators at different quantiles of performance on a composite measure of verbal memory (Li et al., 2015). The presence of an APOE ε4 allele did not affect the location of the change point in relation to AD diagnosis, but it did lower the intercept (i.e., level of verbal memory at age 65) for participants in the 20th and 50th percentiles. APOE ε4 allele carriers in the 20th percentile also had a slower rate of decline, which was likely a consequence of a lower starting point in comparison to individuals without genetic risk.
Cognitive construct
In terms of dementia cohorts in general, the earliest observed change point was for a measure of processing speed (i.e., Figure Identification), occurring −10.9 years (−14.4, −7.5) before diagnosis (Thorvaldsson et al., 2011); however, the earliest change point for AD-only samples was observed for Block Design, a measure of visuospatial ability, with a change point of −9.6 years (Unknown, −6.8; Laukka et al., 2012). The most commonly measured domain was verbal memory, with change points for dementia ranging from −1.0 years to −8.6 years (Unknown, −6.2; Thorvaldsson et al., 2011) before diagnosis. The latest cognitive ability to decline was verbal IQ as measured by a test of reading ability. The change point was −0.4 years (−1.1, 0.1) before diagnosis with a 95% CI inclusive of possible values after the diagnosis of AD (Grober et al., 2008).
Figure 3 provides a forest plot of change points for AD-only sample coded in years to diagnosis with 95% CIs when reported by the authors. The change points were categorized in terms of the cognitive construct evaluated by the test used to calculate the change point, as determined by the authors of this review. The decision to only include AD samples in the forest plot was to ensure the change points were as comparable as possible across studies, assuming a common pathological pathway underlying the cognitive changes observed for each sample. As shown visually in Figure 3, substantial variability in change points were observed both within and between cognitive constructs. An exact sequence of decline based on cognitive construct could not be determined, considering the substantial scatter among change point estimates for the same cognitive constructs, the limited data points reported for some cognitive constructs, and the overlap between the CIs around different change points.
Figure 3. Change Point Estimates with 95% Confidence/Credible Intervals for Alzheimer’s Disease Studies by Cognitive Construct.
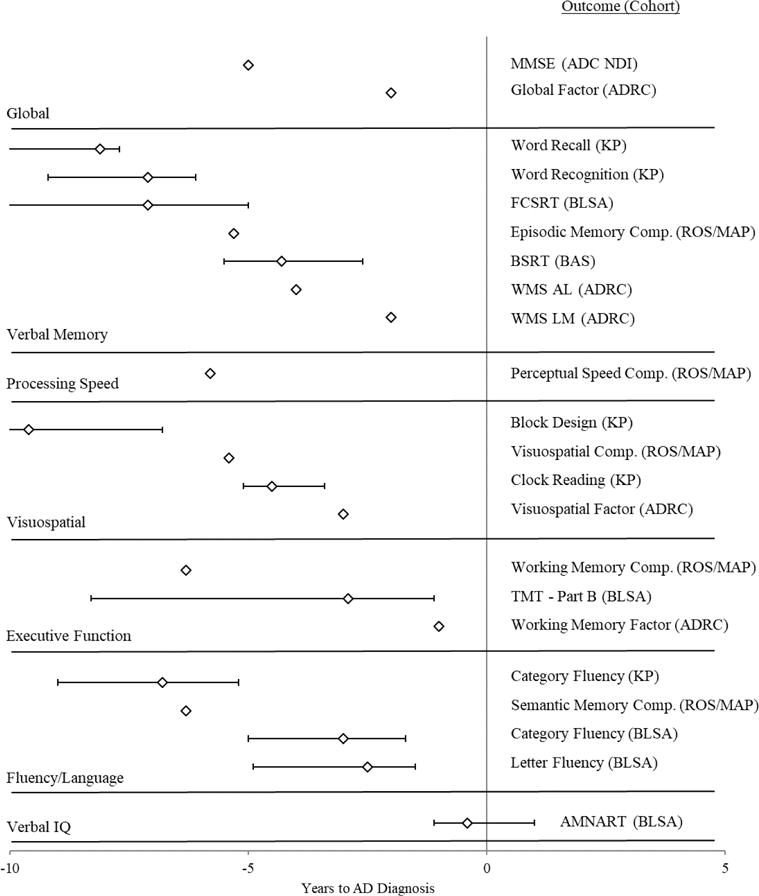
Note. ADC NDI = Alzheimer’s Disease Centers Neuropsychological Database Initiative; ADRC = Washington University School of Medicine Alzheimer’s Disease Research Center; AL = Associate Learning; AMNART = American Version of the Nelson Adult Reading Test; BAS = Bronx Aging Study; BLSA = Baltimore Longitudinal Study of Aging; BSRT = Buschke Selective Reminding Test; Comp. = Composite; FCSRT = Free and Cued Selective Reminding Test; H70 = Gerontological and Geriatric Population Study; KP = Kungsholmen Project; LM = Logical Memory; MAP = Memory and Aging Project; MMSE = Mini Mental Status Examination; ROS = Religious Orders Study; TMT = Trail Making Test; WMS = Wechsler Memory Scale. For the Bronx Aging Study, the only change point listed above is for the AD-only sample (Hall et al., 2000). One study (Johnson et al., 2009) reported a change point for a Verbal Memory factor, and separate change points for the tests that composed this Verbal Memory factor. The change points included in the figure above came from the individual tests and not the factor. Another study (Grober et al., 2008) provided two change points for the Free and Cued Selective Reminding Test. Only the first, earlier change point is displayed on the figure. Two studies reported change points for the ROS/MAP cohort (Li et al., 2015; Wilson et al., 2011), and only the change points from the study that reported estimates for multiple constructs are displayed above (Wilson et al., 2011).
Terminal Decline Change Point Studies
Demographic characteristics
Seventeen studies examined change points in cognitive functioning prior to death. A total of nine cohorts were evaluated in these analyses, with two of these cohorts combined and evaluated as a single sample in three studies (i.e., ROS/MAP; Boyle et al., 2013; Wilson et al., 2015; Yu et al., 2013), but kept separate in five other studies (i.e., MAP-only; Wilson et al., 2007); ROS-only (Wilson et al., 2003, 2010, 2012a, 2012b). Taking the largest sample size reported by a study for each cohort, a total of 5,613 participants that passed away during follow-up were represented in the systematic review, with 37% of these participants coming from a single cohort (i.e., CC75C, N = 2,078; Muniz Terrera et al., 2014). The mean baseline age of participants across studies ranged from 72.7 to 88.9 years. The only cohorts with ethnicity data were the MAP-only (Wilson et al., 2007), ROS-only (Wilson et al, 2010, 2012b), and ROS/MAP combined cohorts (Boyle et al., 2013), reporting samples that were over 90% White. The percent prevalence of the APOE ε4 allele was reported for two samples: the MAP-only (29.5%; Wilson et al., 2007) and ROS/MAP combined cohorts (23.8%; Yu et al., 2013). The education of the samples ranged from means of 11.4 years (Batterham et al., 2011) to 18.3 years (Wilson et al., 2003). Two samples described the educational backgrounds of their samples categorically. One study described a sample where the majority had completed at least high school education (i.e., 54.3%; Dodge et al., 2011), while the other study reported that participants left formal education on average at 14.8 years of age (Muniz Terrera et al., 2014).
Design characteristics
The cohorts used to determine change points for the onset of terminal decline ranged in years of follow-up from 8 years to up to 30 years. The intervals between measurement waves varied by cohort from annual assessments, to assessments occurring every three years, to irregular assessments occurring every two to five years. As with dementia studies, terminal decline studies inconsistently reported the average years of follow-up or number of measurement waves completed across cohorts. The mean number of measurement waves completed by participants ranged from 2 waves (Batterham et al., 2011; MacDonald et al., 2011) to 10.9 waves (Wilson et al., 2012a). The number of measurement waves completed differed from the average number of years follow-up, which ranged from 5.7 years (Sliwinski et al., 2006) to 10.7 years (Wilson et al., 2015). In terms of analytical approach, eight studies took a frequentist approach with a fixed change point, while one study also took a frequentist approach, but included a random change point (van den Hout et al., 2013). A total of eight studies conducted a Bayesian analysis with a random change point.
Summary of findings
In comparison to the dementia change point studies, far more moderators were evaluated in the terminal decline studies. These studies determined the influence of moderators on the change point (i.e., the onset of terminal decline) along with the slope before the change point (i.e., the rate of age-related cognitive decline) and the slope after the change point (i.e., the rate of terminal decline). These moderators included demographics (e.g., age, gender, education), physical impairment, cognitive impairment, genetic risk, neuropathology, personality, practice effects, and cognitive construct.
Demographics
The demographics examined as potential moderators included age at baseline or death, gender, and educational background. One study identified that participants older at baseline declined at a slightly faster rate before the change point, but declined at a slower rate following the change point (Muniz-Terrera et al., 2013), while another study found no relationship between age and the rate of terminal decline (Wilson et al., 2007). Participants older at death declined at slower rates prior to the change point than those who died younger; however, after the change point, those who died later had more rapid change than those who died younger (Muniz-Terrera et al., 2013, 2014).
Gender was evaluated twice using the same cohort (i.e., CC75C), but was associated with different results across studies. One study found that women declined at the same rate as men before the change point, but at a faster rate than men after the change point (Muniz-Terrera et al., 2013); while another study found that women declined at a faster rate than men before the change point, but at a slower rate than men after the change point (Muniz Terrera et al., 2014).
In terms of education, four studies evaluated the effect of education on change point models examining terminal decline on the MMSE (Batterham et al., 2011; Muniz-Terrera et al., 2013, 2014; Wilson et al., 2007). In an analysis of two groups stratified at 11 years of education (i.e., <11 years or ≥11 years), the low education group had a later change point than the high education group on the MMSE: −2.6 years (−3.8, −2.1) and −8.6 years (−10.1, −7.7), respectively (Batterham et al., 2011). However, the rates of preterminal and terminal decline on the MMSE were greater for the low education group when compared to the high education group (Batterham et al., 2011). Another study also using the MMSE as the outcome measure observed a different effect of education on the location of the change point. This study (Muniz Terrera et al., 2014) had education coded as the age at which participants left formal schooling. Leaving school at a later age delayed the change point by 4.8 months per additional year of education, and thus participants with more education had a later onset of slightly faster decline. And yet another study examining the MMSE found a different pattern, where participants with more education experienced a faster decline on the MMSE prior to the change point in comparison to individuals with less education; however, following the onset of terminal decline, this pattern was reversed, where more educated participants declined at a slower rate than those participants with less education (Muniz-Terrera et al., 2013). Although not examining the MMSE, a different study (Wilson et al., 2007) found that the rate of terminal decline on a global composite measure of cognitive function did not vary by education.
Only one study examined the effect of education on change point models of specific cognitive constructs (Batterham et al., 2011). As noted earlier, these authors provided point estimates of change points for low and high education groups (i.e., <11 years or ≥11 years, respectively). Because the confidence intervals for the change point estimates overlapped, the authors suggested that education did not modify the onset of terminal decline in processing speed or episodic memory tests. Interestingly, the Episodic Memory score had very similar change points for the low education (i.e., −5.5 years [−8.3, −2.8]) and high education (i.e., −6.6 years [−6.9, −5.5]) groups; however, the point estimates for the Symbol-Letters Modalities Test (SLMT), a measure of processing speed, were further apart for low and high education groups: −11.3 years (<−17, −4.8) and −7.8 (−9.3, −6.8). For both the MMSE and Episodic Memory score, the low education group had a later change point than the high education group; however, for the processing speed task, participants with less education showed an earlier change point estimate. There was no difference based on education in preterminal decline for the SLMT, but the high education group showed faster terminal decline for this construct (i.e., potentially later onset, but faster decline). In an opposite pattern, there were no education-based differences in terminal decline for Episodic Memory scores; however, the high education group showed faster preterminal decline than the low education group for this outcome.
Physical impairment and health problems
The effects of physical impairment on rates of cognitive decline did not reach significance either before or after the change point (Muniz-Terrera et al., 2013; Muniz Terrera et al., 2014). Another study (Wilson et al., 2003) did not report significant changes in their model upon controlling for baseline medical conditions and physical disability. A different study that explored physical health as a moderator found no association between vascular risk factors (i.e., diabetes, smoking and hypertension) and terminal decline, but did find that the presence of vascular conditions (i.e., heart attack, stroke, claudication, congestive heart failure) was related to terminal decline, in that terminal decline was absent when an individual had a vascular condition (Wilson et al., 2007). Another study examining vascular risk factors and conditions found that risk factors were marginally associated with a delay in the onset of terminal decline, while vascular conditions were not associated with any components of the change point model (Wilson et al., 2012a).
Cognitive impairment
The effect of cognitive impairment on components of the change point models varied across studies. One study found that participants with baseline cognitive impairment declined more rapidly both before and after the change point (Muniz Terrera et al., 2014), while another study found that participants with baseline cognitive impairment declined at a slower rate before the change point and a faster rate after the change point (Muniz-Terrera et al., 2013). In one study, the removal of participants with MCI at baseline from analysis resulted in a very slight delay in the onset of terminal decline (Wilson et al., 2012a). Yet another study found no association between the presence of mild cognitive impairment and the rate of terminal decline (Wilson et al., 2007).
Two studies specifically evaluated the effects of participants with dementia on components of their change point models. For one study, participants with dementia had a lower baseline performance, but did not differ from participants without dementia in their rate of cognitive decline before the change point; however, they experienced a faster rate of decline following the change point (Sliwinski et al., 2006). In contrast, for another cohort, the exclusion of participants with a dementia diagnosis did not substantially affect the location of the change point or the rates of preterminal or terminal decline (Batterham et al., 2011). For the ROS cohort, dementia diagnosis occurred about a year before the change point for terminal decline in motor functioning, and about the same time as the change point for terminal decline in cognitive functioning (Wilson et al., 2012a).
Genetic risk
Two studies examined the relationship between the presence of the APOE ε4 allele and components of their change points models, one examining the combined ROS/MAP cohorts (Yu et al., 2013) and another examining just the MAP cohort (Wilson et al., 2007). When evaluating the associations between APOE ε4 status and the components of the change point model, one study identified an earlier change point for APOE ε4 carriers by roughly 9 months (Yu et al., 2013). In terms of rates of cognitive decline before and after the change point, APOE ε4 carriers had a 75% faster rate of preterminal decline and a 40% faster rate of terminal decline compared to non-carriers. In contrast, a different study found that the presence of an APOE ε4 allele was associated with a more rapid terminal decline, but was unassociated with the rate of preterminal decline (Wilson et al., 2007). The study examining the combined cohorts also explored the potential protective effects of possessing an APOE ε2 allele, but found no evidence that the presence of the ε2 allele was associated with any component of the change point model (Yu et al., 2013).
Neuropathology
A set of studies analyzing the ROS/MAP combined cohorts examined the effects of different indicators of neuropathology and genetic risk on the components of their change point models for a global cognition composite score (Boyle et al., 2013; Wilson et al., 2015; Yu et al., 2013). One of these studies further examined the relationship between conscientiousness and neuropathology (Wilson et al., 2015), with the findings of these researchers explained under the personality subsection below. Three additional studies analyzing just the ROS cohort further examined the relationship between neuropathologic indices and decline in motor functioning (Wilson et al., 2012a) or specific cognitive constructs (Wilson et al., 2010, 2012b). The indices of neuropathology evaluated included neurofibrillary tangle density (hereafter referred to as tangles) and amyloid plaque burden (hereafter referred to as amyloid), along with the presence of micro-infarcts, gross infarcts, neocortical Lewy bodies or hippocampal sclerosis. Global AD pathology was also derived as an average of the summary scores given for tangles, neuritic plaques, and diffuse plaques.
In a study that included all neuropathologic indices in the same model, these indices accounted for 25% of variation in the change point, 32% of variation in the rate of change before the change point, and 21% of variation in the rate of change after the change point (Boyle et al., 2013). The location of the change point was associated with global AD pathology, tangles, and the presence of gross infarcts, micro-infarcts and neocortical Lewy bodies; the rate preterminal decline was associated with global AD pathology, tangle density, and the presence of gross infarcts and Lewy bodies; and lastly, the rate of terminal decline was associated with tangles and the presence Lewy bodies. Notably, amyloid was not associated with any component of the change point model, potentially due to the inclusion of Global AD pathology as a covariate (i.e., these two variables correlated at r = 0.78). In another study (Wilson et al., 2015), tangles and the presence of Lewy bodies, gross infarcts and hippocampal sclerosis were included as covariates in a change point model, identifying associations between the preterminal slope and three neuropathologic indices (i.e., tangles, Lewy bodies and hippocampal sclerosis, accounting for 25.9% of variation) and the terminal slope and two neuropathologic indices (i.e., Lewy bodies and gross infarcts, accounting for 13.2% of variation).
One study evaluated the relationship between neuropathologic indices and specific cognitive constructs in addition to global cognition (Wilson et al., 2010). These researchers identified that higher tangle density was associated with faster preterminal and terminal decline in global cognition as well as all cognitive domains evaluated (i.e., perceptual speed and episodic, semantic, and working memory). Gross and micro-infarcts were associated with faster preterminal decline in global cognition, and more specifically, episodic and working memory. While micro-infarcts were associated with preterminal decline in semantic memory, gross infarcts were associated with terminal decline in this same construct. Neocortical Lewy bodies were related to increased rates of preterminal decline in perceptual speed, and terminal decline in global cognition along with episodic, semantic, and working memory; however, nigral and limbic Lewy bodies were not associated with any components of the change point model.
Another study involving random change points found that greater plaques and tangles, but not Lewy bodies or infarcts, were associated with an earlier onset of terminal decline for both motor and cognitive functioning; however, all neuropathologic indices were associated with both preterminal and terminal rates of decline (Wilson et al., 2012a). An additional study involved a random change point for each of the aforementioned cognitive domains, and found that Global AD pathology was also associated with earlier change points for each cognitive domain (Wilson et al., 2012b). While these researchers found an association between AD pathology and greater rates of preterminal decline in episodic and semantic memory, they found no relationship between AD pathology and rates of terminal decline.
Another group of researchers (Yu et al., 2013) examined the same neuropathologic indices, but evaluated their association with components of the change point model after accounting for variance attributable to the presence of an APOE ε4 allele. The relationship between APOE ε4 status and components of the change point model were discussed above in the genetic risk subsection. When included in the model, AD pathology was associated with an earlier change point and faster rates of decline before and after the change point. The associations between APOE ε4 status and all components of the change point model were all attenuated by the inclusion of AD pathology and became non-significant, albeit the association between the rate of terminal decline and APOE ε4 status remained marginally significant. When examining tangles and amyloid separately, both were associated with an earlier change point and more rapid rates of preterminal and terminal decline, although the association between amyloid and terminal decline was only a trend. When controlling for amyloid burden, the presence of an APOE ε4 allele was still significantly associated with all three components of the change point model. When controlling for tangles, the presence of an APOE ε4 allele was no longer significantly associated with the rate of preterminal decline or the location of the change point, but maintained a modest association with the rate of terminal decline. When controlling for both amyloid and tangles simultaneously, APOE ε4 was not associated with any component of the model, amyloid was only associated with an earlier change point, and tangle density was still associated with all components of the change point model.
Gross infarcts were not associated with the location of the change point, but were associated with faster rates of preterminal and terminal decline. In contrast, microscopic infarcts were associated with an earlier change point, but not the rates of decline (Yu et al., 2013). The relationships between APOE ε4 status and components of the change point model were unaffected when controlling for the presence of infarcts. A final model run by these authors accounted for global AD pathology, infarcts, Lewy bodies and APOE ε4 status simultaneously. This model found that AD pathology and microscopic infarcts were associated with an earlier change point, while AD pathology, macroscopic infarcts and Lewy bodies were associated with faster rates of cognitive decline before and after the change point. Upon accounting for all neuropathologic indices, the presence of an APOE ε4 allele was not associated with any component of the change point model.
Personality
One study (Wilson et al., 2015) involved a series of models evaluating the relationship between personality and cognitive decline. The first model evaluated just the relationship between conscientiousness and the components of the change point model, finding that conscientiousness was not associated with the location of the change point. Higher conscientiousness was associated with a slower rate cognitive decline following the change point, but not before the change point. This relationship (i.e., higher traits leading to slower terminal decline) was true for all facets of conscientiousness (i.e., orderliness, goal striving, and dependability) and all domains of cognition evaluated (i.e., global, episodic, semantic, and working memory), except for perceptual speed and visuospatial ability. In contrast to conscientiousness, neuroticism, baseline depressive symptoms, and the personality facets of negative affect and self-reproach were not associated with any component of the change point model. When included in a model with neuropathologic indices (i.e., tangles and the presence of Lewy bodies, gross infarcts or hippocampal sclerosis), conscientiousness was still associated with a slower rate of decline following the change point, accounting for 4.0% of additional variance in the terminal slope. When an interaction between conscientiousness and various neuropathologic indices were included in the model, an association was observed between conscientiousness, Lewy bodies and the terminal slope, where the relationship between Lewy bodies and the terminal slope was attenuated at higher levels of conscientiousness. In a closer examination of the stages of Lewy body disease (i.e., nigral, limbic, and neocortical), the researchers observed that conscientiousness specifically modified the association between terminal slope and neocortical Lewy body disease.
Practice effects
A single group of researchers (Dodge et al., 2011) ran change points models with and without adjusting for practice effects (i.e., using dummy variables for the number of assessments), and identified that change points shifted further from death for three constructs (i.e., learning, memory, language) when practice effects were considered in the model. There was no shift in the change point for executive functions after controlling for practice effects, and a slight shift for the psychomotor speed change point (i.e., ~1 year earlier).
Cognitive construct
Figure 4 provides a forest plot of change points preceding terminal decline coded in years to diagnosis with 95% CIs presented when reported by the authors. The change points are organized in terms of the cognitive construct evaluated, as categorized by the authors of this review, and substantial variability in change points was observed both within and between most cognitive constructs. The most commonly measured domain was memory and learning, which includes tasks measuring learning and verbal or visual memory. Change points for this domain ranged from −2.6 years (Wilson et al., 2012b) to −8.4 years (−9.8, −7.1; Sliwinski et al., 2006) before diagnosis. When excluding the earliest change points from the ROS cohort (Wilson et al., 2012a, 2012b), the change points within this domain were fairly comparable, with the lower bound for this range moving to −6.6 years before death (Batterham et al., 2011).
Figure 4. Change Point Estimates with 95% Confidence/Credible Intervals for Terminal Decline Studies by Cognitive Construct.
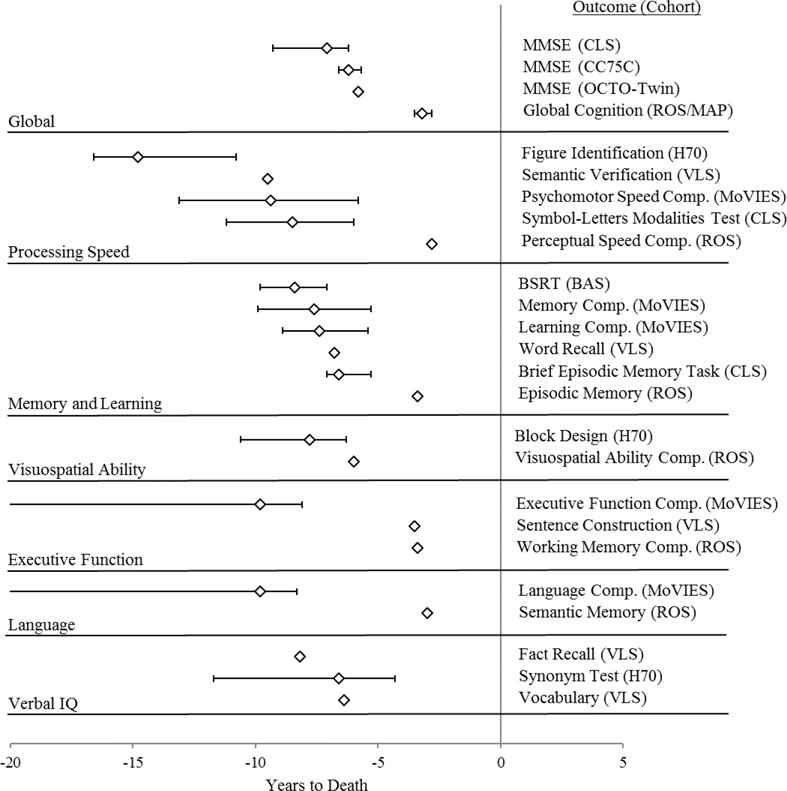
Note. BAS = Bronx Aging Study; BSRT = Buschke Selective Reminding Test; CC75C = Cambridge City over 75 Cohort Study; CLS = Canberra Longitudinal Study; H70 = Gerontological and Geriatric Population Study; MMSE = Mini Mental Status Examination; MoVIES = Monongahela Valley Independent Elders Survey; OCTO-Twin = Origins of Variance in the Old-old Study; MAP = Memory and Aging Project; ROS = Religious Orders Study; VLS = Victoria Longitudinal Study. Three studies (Muniz-Terrera et al., 2013; Muniz Terrera et al., 2014; van den Hout et al., 2013) all reported change points for the MMSE using CC75C data, but only the change point for one study (Muniz Terrera et al., 2014) is displayed above. Eight studies (Boyle et al., 2013; Wilson et al., 2003, 2007, 2010, 2012a, 2012b, 2015; Yu et al., 2013) provided change points for a Global Cognition Summary Measure using data from the ROS and/or MAP, but only the change point from one study (Wilson et al., 2015) is displayed above. Three studies provided estimates for ROS data based on cognitive construct (Wilson et al., 2003, 2012a, 2012b), and only the change points from one study (Wilson et al., 2003) is displayed above.
As with dementia cohorts, the earliest observed change point was for a measure of processing speed (i.e., Figure Identification) among the H70 cohort, with the change point preceding death by −14.8 years (−16.6, −10.8; Thorvaldsson et al., 2008). In terms of the latest cognitive ability to decline, change points for various domains using the ROS dataset were very similar for global cognition, processing speed, memory and learning, executive function, and language (range: −2.3 to −4.3; Wilson et al., 2003, 2010, 2012a, 2012b). The ROS cohort experienced a later onset of decline across most cognitive domains in comparison to other cohorts, as displayed visually in Figure 4. Interestingly, as a cognitive domain, processing speed had both the earliest and one of the latest change points observed across samples, with processing speed presenting with close to the latest change point for the ROS cohort. Unlike for the dementia cohorts, verbal IQ, as measured by a test of vocabulary and semantic knowledge, did not have the latest change point. Instead, this construct began declining around −6.4 to −8.2 years before death (MacDonald et al., 2011), which was comparable to change point estimates for other domains. The relationship between rates of change across constructs was also evaluated among the ROS cohort to determine whether dedifferentiation of cognitive abilities occurs in the context of terminal decline; and while the correlations between rates of change were moderate during preterminal decline (i.e., range: r = 0.25 to 0.46), the correlations were quite large during upon the onset of terminal decline (i.e., range: r = 0.83 to 0.89; Wilson et al., 2012b). In addition to different cognitive constructs, terminal decline in motor functioning was specifically evaluated in one study (Wilson et al., 2012a), identifying decline in global motor functioning about two years before death, about a half year later than global cognitive decline. Three specific measures of motor functioning (i.e., manual strength, manual dexterity, and gait), all underwent accelerated decline within about two and a half years of death.
Not displayed visually in Figure 4, one study could not reliably estimate change points on tests of word reading (i.e., the National Adult Reading Test), verbal fluency, face recognition, and word recognition (Batterham et al., 2011). For many constructs, there were few change points estimates reported in the literature overall (e.g., visuospatial ability, executive function, language). As with the dementia cohorts, an exact sequence of decline for cognitive constructs could not be determined based on the current findings, considering variability within cognitive constructs, limited data points for some cognitive constructs, and the overlap between the confidence/credible intervals around different change points.
Discussion
Since the first application of change point modeling in dementia populations (Joseph et al., 1999), the research within this area has steadily progressed, with 35 eligible studies evaluated in the current review. Among these studies, change points were examined in relation to MCI, dementia, and death, with researchers modeling numerous motor, neurological, and cognitive outcomes. The primary aims of this systematic review included identifying the order in which different neurological and cognitive outcomes decline in relation to diagnosis or death, and the determination of factors that modify the rate of decline or the location of the change point for each of these outcomes. In terms of the first aim, as detailed through the summary of results, the findings do not provide a clear and definitive temporal sequence by which different domains decline in the years preceding MCI or death, but offered some indication of a sequence preceding AD.
Temporal Sequence of Cognitive Decline
Only studies examining MCI explored change points in neurological outcomes, and although these researchers identified early change points for gait speed and white matter hyperintensities, this examination of pre-MCI change points has derived almost entirely from one cohort (i.e., OBAS) with very small sample sizes (i.e., N range: 37 to 134) and an unidentified lower bound of the CI surrounding their change points (Buracchio et al., 2010; Carlson, 2008; Howieson et al., 2008; Silbert et al., 2012). If you only consider the pre-MCI change points with estimates for both upper and lower bounds of their CIs, all outcomes (i.e., both cognitive and neurological) occur within the five years preceding diagnosis, apart from finger tapping, which occurs after diagnosis (see Figure 2). One study examining pre-MCI change points for the ROS cohort (Wilson et al., 2011) found earlier change points for both amnestic and non-amnestic MCI (i.e., −6.7 and −5.2 years pre-diagnosis, respectively), but the researchers did not report confidence intervals for these estimates. Nonetheless, based on a single study, MCI with memory impairment onset earlier than MCI without memory impairment; however, for the OBAS cohort, change points did not differ between cognitive constructs (Howieson et al., 2008).
In regard to dementia, there was more evidence to suggest a sequence of decline preceding AD. A visual examination of Figure 3 appears to indicate an early decline in verbal memory, followed by visuospatial ability, then fluency and executive functions, and lastly verbal IQ. This interpretation is debatable, as this trend was not quantitatively determined, but rather based on a qualitative interpretation of the change points reported across studies. Many of the observed change points have either no reported CI or a very wide CI, overlapping with the intervals for other constructs. Further, some of the estimates for these domains (e.g., verbal IQ, executive functions) derive from just one to three studies (Grober et al., 2008; Johnson et al., 2009; Wilson et al., 2011), and have consequently not been critically evaluated through either direct of conceptual replications. In turn, while there is some evidence for a trend, this conclusion is a tentative one at best. Nonetheless, it does align with previous reviews of cross-sectional research evaluating cognitive deficits associated with preclinical AD (Bäckman et al., 2005; Han, Nguyen, Stricker, & Nation, 2017). One construct sensitive to preclinical AD based on these reviews (i.e., processing speed) was only evaluated by one AD-only study (Wilson et al., 2011) and one general dementia study (Thorvaldsson et al., 2011). In the context of general dementia, it was the earliest observed change point across studies. Future researchers should consider including processing speed outcomes in future change point analyses of preclinical AD, considering its relationship to white matter integrity (Gunning-Dixon & Raz, 2000) and the early increase of white matter intensities preceding MCI (Silbert et al., 2012).
In contrast to pre-dementia change points, terminal change point studies did not provide evidence of a temporal sequence in cognitive decline preceding death. With the exception of three studies on the ROS cohort finding change points across cognitive domains within five years of death (Wilson et al., 2003, 2012a, 2012b), most all change points were identified as occurring within five to ten years of death. Even typical hold tests tapping into Verbal IQ, which appear to decline last in dementia (Grober et al., 2008), declined within this five-year window, evidencing a global decline in cognitive functioning across domains preceding death.
Although the temporal sequence of cognitive decline was interpreted separately for MCI, AD, and terminal decline, these three endpoints can have shared etiology explaining the cognitive decline that precedes them. Individuals with a diagnosis of MCI will not necessarily develop AD or dementia, but some participants included in the pre-MCI change point studies likely present with an underlying AD or neurodegenerative pathology. Notably, previous researchers have suggested that an amnestic MCI presentation may be better defined as prodromal AD (Dubois & Albert, 2004), and performances on cognitive measures have very good predictive accuracy at determining which participants with MCI will progress to AD (Belleville, Fouquet, Hudon, Zomahoun, & Croteau, 2017). Further, over the course of terminal decline, many older adults will eventually qualify for a dementia diagnosis, and the cause for terminal decline among a subset of participants included in these studies may be an underlying AD or dementia process. Nonetheless, despite their overlap, the division of these three endpoints offers a cleaner framework for interpreting change points findings in aggregate, because in research and clinical practice, MCI, dementia, and terminal decline are often treated as separate but related processes among older adults.
Although few pre-MCI change point studies were identified, the AD literature offers some evidence for a temporal sequence of decline. From the perspective of a systematic review, one aim of aggregating the current findings is to identify typical longitudinal cognitive profiles based on a disease process, where declines observed in specific cognitive domains at retest are indicative of a specific stage of an underlying AD pathology (e.g., while decline in verbal memory may precede a diagnosis by many years, declines in executive function may be more proximal to diagnosis). The reviewed studies show consistent evidence for non-linear preclinical decline that varies by cognitive domain, and they demonstrate the utility of measuring cognitive functioning longitudinally in clinical practice, where observed declines in certain domains could serve as early predictors of a future AD diagnosis. An understanding of the empirical research on longitudinal cognitive change can be informative when differentiating AD from normal cognitive aging and potentially different dementia types.
When clinicians evaluate older adults for AD at a single timepoint, they often compare neuropsychological test performances to cross-sectional normative datasets of age-matched samples, identifying lower than expected performances within cognitive domains that are often reduced in the context of preclinical AD (Bäckman et al., 2005; Han et al., 2017). However, the certainty of a probable AD diagnosis can be enhanced with evidence of documented decline (McKhann et al., 2011); and in the context of a re-evaluation, an understanding of the expected onset and rate of decline preceding diagnosis can improve early detection, where individuals likely to develop AD are identified prior to presenting with impaired cognitive performances based on normative comparisons. However, although this systematic review of change point analyses offers some clarification of the preclinical course of AD, this interpretation was tentative, and the findings are not easily translatable into clinical practice.
Variables Modifying the Onset and Rate of Cognitive Decline
The second aim focused on determining factors that modify the location of a change point in relation to MCI, dementia, or death along with the rates of change both before and after the change point. The MCI studies involved limited focus on covariates, considering there were few of them, and all but one involved the analysis of the OBAS cohort. They found some effects of gender on motor outcomes, where earlier change points for gait speed and finger tapping were observed for men than women. Similarly, few modifying variables were evaluated for dementia studies overall, but some showed a meaningful effect of the change point or rate of change. With more years of education, the change point was delayed, but once accelerated change began, it occurred at a more rapid rate for individuals with more education (Hall et al., 2007; Jacqmin-Gadda et al., 2006). Participants involved more frequently in cognitively engaging activities (e.g., reading, crossword puzzles, playing music) also experienced a delay in the onset of a faster rate of decline (Hall et al., 2009). In terms of dementia type, decline occurred earlier among participants with AD than VaD (Laukka et al., 2012). Dementia type was only evaluated as a change point modifier in one study; while in all other studies, participants were either grouped as a single dementia cohort or the subgroup with AD diagnoses were separately evaluated.
The number of covariates evaluated in the terminal decline studies far exceeded those evaluated among either the MCI or dementia cohorts. For some covariates there were discrepant findings. While one study found no effect of gender decline before the change point (Muniz-Terrera et al., 2013), another found that women declined faster before the change point (Muniz Terrera et al., 2014); and while one study found women decline at a faster rate following the change point (Muniz-Terrera et al., 2013), another found that women declined at a slower rate following the change point (Muniz Terrera et al., 2014). Education as a covariate produced similarly discrepant findings, where two studies found that more education delayed the change point (Batterham et al., 2011; Muniz Terrera et al., 2014), but the rate of accelerated decline was either faster with more education (Muniz Terrera et al., 2014), faster with less education (Batterham et al., 2011; Muniz-Terrera et al., 2013), or education had no effect at all (Wilson et al., 2007). Personality was also explored as a covariate, where one study determined that higher levels of conscientiousness was not associated with the location of the change point, but did lead to a slower rate of terminal decline (Wilson et al., 2015).
Aside from demographic characteristics, genetic risk and neuropathology were also explored. The presence of an APOE ε4 allele was related to an earlier change point and a more rapid rate of terminal decline (Wilson et al., 2007; Yu et al., 2013); however, AD neuropathology explained the relationship between APOE ε4 and components of the change point model, as the relationship between APOE ε4 and model components became non-significant with the inclusion of AD neuropathologic indices as covariates in the model (Yu et al., 2013). Multiple neuropathologic indices of AD were evaluated as covariates (e.g., tangles, neuritic plaques, neocortical Lewy bodies, etc.), explaining a substantial amount of variance in the change point along with the pre-terminal and terminal rates of decline (Boyle et al., 2013; Wilson et al., 2015).
Limitations
The studies reviewed herein were variable in terms of their research designs, cognitive measurements, and analytic approaches, limiting the conclusions that can be drawn from the current systematic review. Among the many longitudinal cohort studies evaluated, the study durations, number of completed measurement waves, and intervals between measurement waves varied substantially. Studies ranged in duration from 10 years (Jacqmin-Gadda et al., 2006; Laukka et al., 2012) to 30 years (Thorvaldsson et al., 2008; Thorvaldsson et al., 2011). The number of completed measurement waves varied from 2 (for a study with up to five waves; MacDonald et al., 2011) to 10.9 (for a study with up to 16 waves; Wilson et al., 2012a). Attrition is not uncommon for longitudinal research, especially among older adults who experience dementia or death during follow-up; however, for some cohorts, many participants completed just a small number of measurement waves on average. The inter-test intervals ranged from annual (which was the most common) to up to five years (Muniz-Terrera et al., 2013; Muniz Terrera et al., 2014; van den Hout et al., 2011). Studies with long intervals between measurement waves may fail to detect the precise onset of change. If a participant undergoes a change point within months of their last measurement, but must wait years till their next assessment, the analysis would misestimate the temporal onset of accelerated decline, biasing the change point estimates calculated for these participants. Comparing change points for studies with such variable intervals may be a reason for the inconsistent findings across studies, where variability in change point estimation may be a consequence of discrepant research designs.
In addition to research designs, the cognitive measures used were also highly variable across studies, with very little overlap. Many tests were assumed to measure the same construct, but they all have unique psychometric characteristics, including different methods of scoring (e.g., total correct, time-to-completion), different reliability estimates, and different evidence for validity. The psychometric qualities of each outcome were not evaluated in the current review, but measurement may influence the variability in change points estimated across studies. For example, the MMSE has a well-known ceiling effect, where most all healthy participants obtain either the highest possible score, or close to the highest possible score. In the context of detecting a change point, older adults may begin accelerated decline years before this decline is detected by the MMSE, with the change points reported in published studies representing an end of the ceiling effect rather that the true onset of accelerated cognitive decline.
The problem of ceiling effects in endemic in screening measures that are not designed to differentiate between participants across the full spectrum of cognitive ability. Aside from the many studies analyzing change in MMSE scores (Batterham et al., 2011; Ji et al., 2003; Muniz-Terrera et al., 2013, 2014; van den Hout et al., 2011), just one additional study analyzed change through use of a different dementia screening measure (i.e., Cognitive Abilities Screening Instrument; Yu & Ghosh, 2010), and these researchers elected to log-transform the scores on this measure to adjust for the skewness of its distribution. When selecting measures to detect the onset of change in a longitudinal design, researchers must be mindful to select measures that have neither a ceiling nor a floor effect, to ensure change in ability levels is readily detectable by the dependent variable. Some researchers have discussed the psychometric rationale for using specific cognitive tests in their models, emphasizing the normal distributions of scores, sensitivity and specificity of the test at detecting dementia, and lack of floor and ceiling effects (e.g., Hall et al., 2000, 2003).
Another key issue in change point modeling is the relationship between the diagnosis of MCI or dementia and the tests used to detect the change point. In some studies, the same tests that are used to define cognitive impairment in the context of MCI or dementia (e.g., Boyle et al., 2013; Li, Dowling, & Chappell, 2015; Wilson et al., 2003, 2007, 2010, 2011, 2012a, 2012b, 2015; Yu et al., 2013; Yu & Ghosh, 2010) are those that are modeled as dependent variables. This confound makes the clinical endpoint directly contingent on preclinical change in the outcome of interest. This confound may affect the generalizability of research findings to contexts in which different measures are used to diagnose MCI or dementia; however, this contingency also aligns with dementia detection in clinical practice, where the same neuropsychological measures may be used repeatedly until cognitive impairment is detected.
Aside from cognitive measurement, the operationalization of MCI or dementia diagnosis was also variable across studies. While there was some consistency in defining dementia in general (i.e., most studies used DSM-III or DSM-III-R criteria; American Psychiatric Association, 1980, 1987), there was more heterogeneity in defining AD. Most studies used the same standard criteria for AD (McKhann et al., 1984), but some studies used either their own criteria (Johnson et al., 2009) or provided no criteria (Ji et al., 2003). In terms of MCI studies, all but one article evaluated the OBAS cohort, and used two or more consecutive Clinical Dementia Rating Scale scores ≥0.5 as their psychometric criterion for diagnosis, coupled with the absence of functional impairment (Buracchio et al., 2010; Carlson, 2008; Howieson et al., 2008; Silbert et al., 2012). This same psychometric criterion was used to diagnose dementia in a separate article (Johnson et al., 2009), although it was combined with a more comprehensive assessment (e.g., semi-structured history interview, neurological examination). The presence of functional impairment is a key differential between MCI and dementia diagnosis. Nonetheless, these similarities in diagnostic criteria between MCI and dementia challenge the notion of distinguishing between pre-MCI and pre-dementia change points. However, despite some evidence of overlap in operational definitions between MCI and AD, no studies used the exact same criteria to define the disorders, and these clinical endpoints were treated as distinct in the current review.
Lastly, the analytical approaches taken by previous researchers also showed substantial inconsistency. An important finding of this review is that change point modelling in cognitive aging includes a wide range of models with many fundamental differences. For instance, some models include both cases (i.e., participants who develop MCI or dementia) and non-cases (i.e., participants who remain healthy throughout follow-up), while others only include participants who ultimately receive a diagnosis at follow-up. Other studies continue to evaluate participants following a dementia diagnosis, while other do not. There is no consensus on the best modeling or estimation approach when detecting change points, and models varied regarding whether they included random effects and whether they used frequentist or Bayesian estimation. Further, the variable inclusion or exclusion of covariates across studies blurs the inferences that can be drawn from the literature in aggregate. There was no common inclusion of covariates across studies, which is likely why some predictors varied in their significance across studies. Considering between-study differences in the significance of covariates, there is also a risk of selective reporting, where covariates that were found to be non-significant were not reported in published findings. This review did not involve a formal evaluation of this type of bias across studies, but such bias could have affected the representation of different covariates in the published literature on preclinical and terminal change points among older adults.
Future Directions
Change point modeling in aging research is a new and promising avenue for detecting the onset of preclinical and terminal accelerations in cognitive and neurological decline. These models have been extensively used in other research areas as well, including economics (Bardsley, Horváth, Kokoszka, & Young, 2017), climate science (Reeves, Chen, Wang, Lund, & Lu, 2007), and biostatistics (Erdman & Emerson, 2008). Many applications of change points modeling in other fields involve far denser data than the cohort data available in longitudinal aging research; however, the onset of new technologies into longitudinal aging research (e.g., mobile cognitive testing) may bridge the methods used across fields. In the context of studies on cognitive aging, the most commonly used formulation of change point models estimates two linear phases with an abrupt change, alternative formulations also exist that could provide smooth change points (van den Hout et al., 2011) or multiple change points (Grober et al., 2008) and offer more realistic descriptions of late-life cognitive and neurological changes.
To date, the change point research on cognitive aging has evidenced the clear preclinical or terminal change points that occur years before diagnosis or death; and – based on the evaluation of covariates – it is also clear that demographic, genetic, and neuropathologic factors are associated with the onset and rate of decline. However, inference around these modifying variables is clouded by the inconsistent inclusion of covariates across studies. Considering the discrepancies across studies in terms of the estimation approach, cognitive measurements, statistical modeling, and the inclusion or exclusion of covariates, a coordinated analysis of multiple datasets may provide an improved method of drawing inference on change point studies across cohorts (Hofer & Piccinin, 2009). It is clear based on the current findings that gender and education are both commonly measured and have some effect on components of change point models; and these demographic features should likely be included as covariates across future models to promote comparability. Baseline age is also a candidate for a common covariate in future analyses, as most all studies reported this demographic, but only one evaluated its significance (Muniz-Terrera et al., 2013). Through analytical coordination, the results of future change point models could be as comparable as possible, allowing for stronger inferences to be drawn about the time at which accelerated change begins and the variables that modify the onset and rates of change.
The identification of modifying variables is likely the most useful research finding that can be drawn from change point research. Although meaningful at a population level, the average onset of preclinical decline is of little meaning at the individual patient level unless clinicians know both when to predict decline and how to delay or slow its acceleration. Demographic features, genetic data, and neuroimaging results would support prediction, but modifying the onset and rate of decline requires either behavioral change or intervention. Change point analysis could be useful in future intervention research, where the experimental condition could serve as a covariate, determining the delay in decline attributable to treatment. However, change point analysis may be most useful when determining the interaction between patient characteristics (e.g., age, gender, APOE ε4 status, white matter hyperintensities) and the effectiveness of a given intervention. Such advances in “precision health” are particularly important in research on dementia, with its long prodromal period and current limitations of clinical detection of neurological impairment, and where signs and symptoms may emerge clearly only years after neuropathological change has accumulated in the brain. Improvement in change point estimation and individualized risk models will provide information to support a precision health approach to the design of effective interventions to delay the onset or slow the rate of decline caused by dementia and related disorders.
Supplementary Material
Table 2.
Dementia Change Point Studies: Participant Characteristics
| Cohort | Study | n* | Age (SD) | Age Range | % Male | Educ. ( yrs. or specified) | % White | % APOE ε4+ | MCI/Dementia Definition | |
|---|---|---|---|---|---|---|---|---|---|---|
| ADC NDI | Ji et al. (2003) | 92 | 76.9 (9.4) | – | – | 14.1 | – | – | No definition provided, but sample described as having a definitive AD diagnosis | |
| ADRC | Johnson et al. (2009) | 134 | 80.4 (8.9) | 60-101 | 34.0 | 14.1 | – | 27.0 | CDR = 0.5 ⟶ Uncertain Dementia; CDR ≥0.5 ⟶ AD; based on semi-structured interviews with participants/collateral sources, health history, medication/depression inventories, aphasia assessment, and neurologic examination | |
| BLSA | Grober et al. (2008) | 92 | 79.8 (6.9) | – | 48.0 | 16.5 | – | – | Dementia (APA, 1980); Probable/Possible AD (McKhann et al., 1984) | |
| BAS† | Hall et al. (2000) | 125 (71 w/AD) | 80.5 (3.3) | 75-85 | 35.5 | Mode of 7th-9th Grade | 90 | – | Dementia (APA, 1980); Probable AD (McKhann et al., 1984); MID based on clinical features and modified Hachinski ischemic score (Rosen et al., 1980) | |
| Hall et al. (2001) | 69 | Same as above | >8 on Blessed Information Memory Concentration Test | |||||||
| Hall et al. (2003) | 69 | Same as above | ||||||||
| Hall et al. (2007) | 117 | Mdn = 81 | 74-92 | 32.0 | 82.1% <12 years | 90 | – | Dementia (APA, 1987) | ||
| Hall et al. (2009) | 101 | 79.5 | 73-87 | 38.0 | – | 91 | – | Dementia (APA, 1987) | ||
| H70 | Thorvaldsson et al. (2011) | 127 | 70 | 70-70 | 34.0 | 33% >6 years | – | – | Dementia (APA, 1987) | |
| HAAS | Yu & Ghosh (2010) | 299 | – | ≥71 | – | 59% >10 years | 0 | 18.0 | Dementia (APA, 1987; Cummings & Benson, 1992); detailed description of diagnostic process reported elsewhere (White et al., 1996) | |
| KP | Laukka et al. (2012) | 286 w/AD | 82.5 (4.7) | – | 14.3 | 56.6% <8 years | – | – | Dementia (APA, 1980) AD (McKhann et al., 1984) |
|
| 63 w/VaD | 82.1 (4.9) | – | 23.8 | 52.4% <8 years | – | – | Dementia (APA, 1980) VaD (Román et al., 1993) |
|||
| Thorvaldsson et al. (2011) | 279 | 82 | ≥75 | 18.0 | 43% >7 years | – | – | Dementia (APA, 1987) | ||
| PP | Jacqmin-Gadda et al. (2006) | 314 | – | ≥65 | – | 43.3% w/out primary school | – | – | Dementia (APA, 1987) | |
| ROS/MAP | Li et al. (2015) | 429 | 81.5 (6.6) | 64-102 | 26.8 | 79.3% ≤12 years | – | 29.6 | AD (McKhann et al., 1984) | |
| Wilson et al. (2011) | 462 | 81.3 | – | 27.3 | 16.4 | 87.9‡ | – | AD (McKhann et al., 1984) |
Note. % APOE ε4+ = Percent positive for the Apolipoprotein E e4 allele; AD = Alzheimer’s disease; ADC NDI = Alzheimer’s Disease Centers Neuropsychological Database Initiative; ADRC = Washington University School of Medicine Alzheimer’s Disease Research Center; APA = American Psychiatric Association; BAS = Bronx Aging Study; BLSA = Baltimore Longitudinal Study of Aging; CDR = Clinical Dementia Rating Scale; Educ. = Education; H70 = Gerontological and Geriatric Population Study; HAAS = Honolulu Asia Aging Study; KP = Kungsholmen Project; PP = Paquid Project; MAP = Memory and Aging Project; MID = Multi-infarct Dementia; ROS = Religious Orders Study; VaD = Vascular Dementia.
n values correspond to the sample size of participants that ultimately received a dementia diagnosis or died over the course of the study and were included in analysis.
For Hall et al. (2001, 2001), demographic characteristics for the BAS sample and the diagnostic criteria for dementia and Alzheimer’s disease were pulled from another article (Katzman et al., 1989).
Value derived from the full sample, rather than just the sub-sample developing dementia.
Table 5.
Dementia Change Point Studies: Study Design Characteristics, Outcomes and Change Points
| Cohort | Authors (Year) | Duration (Years) |
Max # MWs |
# MWs: (SD) |
Years Follow-up (SD) |
Interval Duration (Years) |
Bayesian/ Frequentist; Random/ Fixed CP |
Covariates | Outcome | Construct | CP (95% CI) in Years to Dx |
|---|---|---|---|---|---|---|---|---|---|---|---|
| ADC NDI | Ji et al. (2003) | 12 | – | – | – | – | Frequentist; Fixed CP | – | MMSE | Global | AD-Only: −5 |
| WUSM ADRC |
Johnson et al. (2009) | 25.7 | 7.1* | 5.9 (5.3) | 1 | Frequentist; Fixed CP | Age, education | Global Factor Verbal Memory Factor WMS Associate Learning WMS Logical Memory Visuospatial Factor Working Memory Factor |
Global Verbal Memory Verbal Memory Verbal Memory Visuospatial Executive Function |
AD-Only: −2 AD-Only: −1 AD-Only: −4 AD-Only: −2 AD-Only: −3 AD-Only: −1 |
|
| BLSA | Grober et al. (2008) | 15 | – | – | 4.6 | 2.4 | Frequentist; Fixed CP | – | FCSRT Category Fluency Letter Fluency Trail Making Test Part B AMNART |
Verbal Memory Fluency Fluency Executive Function Verbal IQ |
Two Change Points Reported: AD-Only: −7.1 (Unknown to −5) AD-Only: −2.6 (CI Not Reported) AD-Only: −3 (−5.0 to −1.7) AD-Only: −2.5 (−4.9 to −1.5) AD-Only: −2.9 (−8.3 to −1.1) AD-Only: −0.4 (−1.1 to 0.1) |
| BAS | Hall et al. (2000) | 18 | 10 | – | – | 1 | Frequentist; Fixed CP | – | BSRT | Verbal Memory | Dementia: −5.1 (−6.1 to −4.2) AD-Only: −4.3 (−5.5 to −2.6) |
| Hall et al. (2001)† | 19 | 1-1.5 | Bayesian & Frequentist; Random & Fixed CPs | – | BSRT | Verbal Memory | Dementia: −7.3 (−9.0 to −3.1) | ||||
| WAIS-III PIQ | Visuospatial Ability | Dementia: −3.0 (−4.1 to −1.6) | |||||||||
| Hall et al. (2003) | 20 | – | – | – | 1 | Bayesian & Frequentist; Random & Fixed CPs | – | BSRT | Verbal Memory | Dementia: −7.96 (−9.9 to −1.2) | |
| Hall et al. (2007) | 27 | - | 2.7; 3.6; 4.23 | - | ~1.5‡ | Frequentist; Fixed CP | Education | BSRT | Verbal Memory |
Dementia: −5.5 (−7.0 to −4.2) | |
| Hall et al. (2009) | 28 | - | 3.5§ | 5.0§ | 1-1.5 | Frequentist; Fixed CP | Cognitive activity, education | BSRT | Verbal Memory | Dementia: −5.5 (−7.1 to −4.0) | |
| H70 | Thorvaldsson et al. (2011) | 30 | 12 | ~2.5 | Frequentist; Fixed CP | Synonym Test | Verbal IQ | Dementia: −5.9 (−7.1 to −4.6) | |||
| Block Design | Visuospatial Ability | Dementia: −8.6 (−11.6 to −5.6) | |||||||||
| Figure Identification | Processing Speed | Dementia: −10.9 (−14.4 to −7.5) | |||||||||
| HAAS | Yu & Ghosh (2010) | 9 | 4 | – | – | 3 | Bayesian; Random CP | Education, hypertension, APOE ε4 status | Cognitive Abilities Screening Instrument |
Global | – |
| KP | Laukka et al. (2012) | 10 | 4 | 2.8 (1.0) | 3 | Frequentist; Fixed CP |
Word Recall Word Recognition Block Design Category Fluency Clock Reading |
Verbal Memory Verbal Memory Visuospatial Ability Fluency Visuospatial Ability |
AD-Only: −8.1 (Unknown to −7.7) VaD-Only: −6.5 (Unknown to −3.1) AD-Only: −7.1 (−9.2 to −6.1) VaD-Only: −4.8 (−6.8 to −3.3) AD-Only: −9.6 (Unknown to −6.8) VaD-Only: −5.3 (Unknown to −3.7) AD-Only: −6.8 (−9.0 to −5.2) VaD-Only: −4.4 (−5.7 to −3.1) AD-Only: −4.5 (−5.1 to −3.4) VaD-Only: −4.8 (−7.2 to −3.4) |
||
| Thorvaldsson et al. (2011) | 13 | 4 | – | – | 3 | Frequentist; Fixed CP | Baseline Age | Word Recall Block Design Category Fluency Clock Reading |
Verbal Memory Visuospatial Ability Fluency Visuospatial Ability |
Dementia: −8.6 (Unknown to −6.2) Dementia: −8.3 (Unknown to −5.4) Dementia: −4.6 (−6.5 to −3.5) Dementia: −4.1 (−5.9 to −2.8) |
|
| PP | Jacqmin-Gadda et al. (2006)¶ | 10 | 6 | – | – | ~2 | Frequentist; Random CP | Education | BVRT | Visual Memory | - |
| ROS/MAP | Li et al. (2015) | – | 12 | 7.1 (2.8) | – | 1 | Quantile Regression w/CP | Gender, education, APOE ε4 status | Episodic Memory Composite# | Verbal Memory | AD-Only: −4.6 (−5.0 to −4.1)** |
| Wilson et al. (2011) | 16 | 7.4 (3.8) | 7.0 (4.0) | 1 | Frequentist; Fixed CP | Age, sex, education | Global Composite Episodic Memory Semantic Memory Working Memory Perceptual Speed Visuospatial Ability |
Global Verbal Memory Language Executive Function Processing Speed Visuospatial Ability |
AD-Only: −5.4 AD-Only (w/o baseline MCI): −4.5 AD-only: −5.3 AD-Only: −6.3 AD-Only: −6.3 AD-Only: −5.8 AD-Only: −5.4 |
Note. AD = Alzheimer’s disease; APOE ε4 = Apolipoprotein E e4 allele; ADC NDI = Alzheimer’s Disease Centers Neuropsychological Database Initiative; AMNART = American Version of the Nelson Adult Reading Test; BAS = Bronx Aging Study; BLSA = Baltimore Longitudinal Study of Aging; BSRT = Buschke Selective Reminding Test; BVRT = Benton Visual Retention Test; CI = Confidence or Credible Interval; CP = Change Point; FCSRT = Free and Cued Selective Reminding Test; H70 = Gerontological and Geriatric Population Study; KP = Kungsholmen Project; MCI = Mild Cognitive Impairment; MMSE = Mini Mental Status Examination; MWs = Measurement Waves; PP = Paquid Project; MAP = Memory and Aging Project; ROS = Religious Orders Study; VaD = Vascular Dementia; WAIS-III PIQ = Wechsler Adult Intelligence Scale, Third Edition, Performance IQ; WMS = Wechsler Memory Scale; WUSM ADRC = Washington University School of Medicine Alzheimer’s Disease Research Center.
For Johnson et al. (2009), the average number of observations was calculated by dividing the total assessments for participants progressing to AD (i.e., 957) by the number of participants progressing to AD (n = 134)
For Hall et al. (2001), the change points provided are for full models, but the authors also reported two reduced models with similar results.
For Hall et al. (2007), the mean number of visits before dementia diagnosis was broken down by three groups, displayed in the following order within the table: Education ≤ 7 years; 8-11 years; ≥ 12 years (No significant difference was observed between groups for this variable). The mean testing interval durations were also divided by education level for this study, but they were all approximately 1.5 years.
For Hall et al. (2009), the average number of years follow-up was calculated by dividing the total number of person-years reported (i.e., 505) by the number of participants in the analysis (i.e., 101). The average number of visits was calculated by dividing the total number of clinic visits (i.e., 351) by the number of participants (i.e., 101).
Jacqmin-Gadda et al. (2006) included a random change point and did not report a mean or modal change point in relation to dementia diagnosis for the sample evaluated.
Tests included in composite provided in Wilson et al. (2002).
Li et al. (2015) reported a quantile regression with change points reported for the 20th, 50th, and 80th percentile. The change point provided here is the one for the 50th percentile.
Acknowledgments
Research reported in this publication was supported by the National Institute on Aging of the National Institutes of Health under Award Number P01AG043362 (2013-2018), Integrative Analysis of Longitudinal Studies of Aging and Dementia. The content is solely the responsibility of the authors and does not necessarily represent the official views of the National Institutes of Health. Justin E. Karr is a Vanier Canada Graduate Scholar and thanks the Natural Sciences and Engineering Research Council of Canada (NSERC) for their support of his graduate studies.
Contributor Information
Justin E. Karr, Department of Psychology, University of Victoria
Raquel B. Graham, Department of Psychology, University of Victoria
Scott M. Hofer, Department of Psychology, University of Victoria; Department of Neurology, Oregon Health & Science University
Graciela Muniz-Terrera, Centre for Dementia Prevention, University of Edinburgh.
References
- Aarsland D, Muniz G, Matthews F. Nonlinear decline of mini-mental state examination in Parkinson’s disease. Movement Disorders. 2011;26(2):334–337. doi: 10.1002/mds.23416. http://dx.doi.org/10.1002/mds.23416. [DOI] [PubMed] [Google Scholar]
- Aguirre-Acevedo DC, Lopera F, Henao E, Tirado V, Muñoz C, Giraldo M, Quiroz YT. Cognitive decline in a Colombian kindred with autosomal dominant Alzheimer disease: A retrospective cohort study. JAMA Neurology. 2016;73(4):431–438. doi: 10.1001/jamaneurol.2015.4851. http://dx.doi.org/10.1001/jamaneurol.2015.4851. [DOI] [PMC free article] [PubMed] [Google Scholar]
- Alzheimer’s Association. 2017 Alzheimer’s disease facts and figures. Alzheimer’s & Dementia. 2017;13(4):325–373. http://dx.doi.org/10.1016/j.jalz.2017.02.001. [Google Scholar]
- Amariglio RE, Becker JA, Carmasin J, Wadsworth LP, Lorius N, Sullivan C, Johnson KA. Subjective cognitive complaints and amyloid burden in cognitively normal older individuals. Neuropsychologia. 2012;50(12):2880–2886. doi: 10.1016/j.neuropsychologia.2012.08.011. http://dx.doi.org/10.1016/j.neuropsychologia.2012.08.011. [DOI] [PMC free article] [PubMed] [Google Scholar]
- American Psychiatric Association. Diagnostic and statistical manual of mental disorders. 3rd. Washington, DC: 1980. [Google Scholar]
- American Psychiatric Association. Diagnostic and statistical manual of mental disorders. 3rd. Washington, DC: 1987. [Google Scholar]
- Amieva H, Jacqmin-Gadda H, Orgogozo JM, Le Carret N, Helmer C, Letenneur L, Dartigues JF. The 9 year cognitive decline before dementia of the Alzheimer type: a prospective population-based study. Brain. 2005;128(5):1093–1101. doi: 10.1093/brain/awh451. http://dx.doi.org/10.1093/brain/awh451. [DOI] [PubMed] [Google Scholar]
- Bäckman L, Jones S, Berger AK, Laukka EJ, Small BJ. Cognitive impairment in preclinical Alzheimer’s disease: A meta-analysis. 2005 doi: 10.1037/0894-4105.19.4.520. http://dx.doi.org/10.1037/0894-4105.19.4.520. [DOI] [PubMed]
- Bardsley P, Horváth L, Kokoszka P, Young G. Change point tests in functional factor models with application to yield curves. The Econometrics Journal. 2017;20(1):86–117. http://dx.doi.org/10.1111/ectj.12075. [Google Scholar]
- Batterham PJ, Mackinnon AJ, Christensen H. The effect of education on the onset and rate of terminal decline. Psychology and Aging. 2011;26(2):339–350. doi: 10.1037/a0021845. http://dx.doi.org/10.1037/a0021845. [DOI] [PubMed] [Google Scholar]
- Belleville S, Fouquet C, Hudon C, Zomahoun HTV, Croteau J. Neuropsychological Measures that Predict Progression from Mild Cognitive Impairment to Alzheimer’s type dementia in Older Adults: A Systematic Review and Meta-Analysis. Neuropsychology Review. 2017 doi: 10.1007/s11065-017-9361-5. Advance Online Publication. https://doi.org/10.1007/s11065-017-9361-5. [DOI] [PMC free article] [PubMed]
- Bélisle P, Joseph L, Wolfson DB, Zhou X. Bayesian estimation of cognitive decline in patients with Alzheimer’s disease. The Canadian Journal of Statistics. 2002;30(1):37–54. [Google Scholar]
- Boyle PA, Wilson RS, Yu L, Barr AM, Honer WG, Schneider JA, Bennett DA. Much of late life cognitive decline is not due to common neurodegenerative pathologies. Annals of Neurology. 2013;74(3):478–489. doi: 10.1002/ana.23964. http://dx.doi.org/10.1002/ana.23964. [DOI] [PMC free article] [PubMed] [Google Scholar]
- Buracchio T, Dodge HH, Howieson D, Wasserman D, Kaye J. The trajectory of gait speed preceding mild cognitive impairment. Archives of Neurology. 2010;67(8):980–986. doi: 10.1001/archneurol.2010.159. http://dx.doi.org/10.1001/archneurol.2010.159. [DOI] [PMC free article] [PubMed] [Google Scholar]
- Capuano AW, Wilson RS, Leurgans SE, Dawson JD, Bennett DA, Hedeker D. Sigmoidal mixed models for longitudinal data. Statistical Methods in Medical Research. 2016 doi: 10.1177/0962280216645632. Advance Online Publication. http://dx.doi.org/10.1177/0962280216645632. [DOI] [PMC free article] [PubMed]
- Carlson NE, Moore MM, Dame A, Howieson D, Silbert LC, Quinn JF, Kaye JA. Trajectories of brain loss in aging and the development of cognitive impairment. Neurology. 2008;70(11):828–833. doi: 10.1212/01.wnl.0000280577.43413.d9. http://dx.doi.org/10.1212/01.wnl.0000280577.43413.d9. [DOI] [PubMed] [Google Scholar]
- Carmichael OT, Salloway S. Imaging markers of incipient dementia: The white matter matters. Neurology. 2012:726–727. doi: 10.1212/WNL.0b013e3182662020. http://dx.doi.org/10.1212/WNL.0b013e3182662020. [DOI] [PubMed]
- Clouston SA, Glymour MM, Terrera GM. Educational inequalities in aging-related declines in fluid cognition and the onset of cognitive pathology. Alzheimer’s & Dementia: Diagnosis, Assessment & Disease Monitoring. 2015;1(3):303–310. doi: 10.1016/j.dadm.2015.06.001. http://dx.doi.org/10.1016/j.dadm.2015.06.001. [DOI] [PMC free article] [PubMed] [Google Scholar]
- Cummings JL, Benson DF. Dementia: A clinical approach. 2nd. Boston, Massachusetts: Butterworths; 1992. [Google Scholar]
- Dodge HH, Wang CN, Chang CCH, Ganguli M. Terminal decline and practice effects in older adults without dementia: The MoVIES project. Neurology. 2011;77(8):722–730. doi: 10.1212/WNL.0b013e31822b0068. http://dx.doi.org/10.1212/WNL.0b013e31822b0068. [DOI] [PMC free article] [PubMed] [Google Scholar]
- Dominicus A, Ripatti S, Pedersen NL, Palmgren J. A random change point model for assessing variability in repeated measures of cognitive function. Statistics in medicine. 2008;27(27):5786–5798. doi: 10.1002/sim.3380. http://dx.doi.org/10.1002/sim.3380. [DOI] [PMC free article] [PubMed] [Google Scholar]
- Driscoll I, Davatzikos C, An Y, Wu X, Shen D, Kraut M, Resnick SM. Longitudinal pattern of regional brain volume change differentiates normal aging from MCI. Neurology. 2009;72(22):1906–1913. doi: 10.1212/WNL.0b013e3181a82634. http://dx.doi.org/10.1212/WNL.0b013e3181a82634. [DOI] [PMC free article] [PubMed] [Google Scholar]
- Dubois B, Albert ML. Amnestic MCI or prodromal Alzheimer’s disease? The Lancet Neurology. 2004;3(4):246–248. doi: 10.1016/S1474-4422(04)00710-0. http://dx.doi.org/10.1016/S1474-4422(04)00710-0. [DOI] [PubMed] [Google Scholar]
- Edwards P, Clarke M, DiGuiseppi C, Pratap S, Roberts I, Wentz R. Identification of randomized controlled trials in systematic reviews: Accuracy and reliability of screening records. Statistics in Medicine. 2002;21:1635–1640. doi: 10.1002/sim.1190. http://dx.doi.org/10.1002/sim.1190. [DOI] [PubMed] [Google Scholar]
- Erdman C, Emerson JW. A fast Bayesian change point analysis for the segmentation of microarray data. Bioinformatics. 2008;24(19):2143–2148. doi: 10.1093/bioinformatics/btn404. http://dx.doi.org/10.1093/bioinformatics/btn404. [DOI] [PubMed] [Google Scholar]
- Ewers M, Sperling RA, Klunk WE, Weiner MW, Hampel H. Neuroimaging markers for the prediction and early diagnosis of Alzheimer’s disease dementia. Trends in Neurosciences. 2011;34(8):430–442. doi: 10.1016/j.tins.2011.05.005. [DOI] [PMC free article] [PubMed] [Google Scholar]
- Gale CR, Allerhand M, Deary IJ. Is there a bidirectional relationship between depressive symptoms and cognitive ability in older people? A prospective study using the English Longitudinal Study of Ageing. Psychological Medicine. 2012;42(10):2057–2069. doi: 10.1017/S0033291712000402. http://dx.doi.org/10.1017/S0033291712000402. [DOI] [PMC free article] [PubMed] [Google Scholar]
- Gerstorf D, Ram N, Röcke C, Lindenberger U, Smith J. Decline in life satisfaction in old age: Longitudinal evidence for links to distance-to-death. Psychology and Aging. 2008;23(1):154–168. doi: 10.1037/0882-7974.23.1.154. http://dx.doi.org/10.1037/0882-7974.23.1.154. [DOI] [PMC free article] [PubMed] [Google Scholar]
- Grober E, Hall CB, Lipton RB, Zonderman AB, Resnick SM, Kawas C. Memory impairment, executive dysfunction, and intellectual decline in preclinical Alzheimer’s disease. Journal of the International Neuropsychological Society. 2008;14(2):266–278. doi: 10.1017/S1355617708080302. http://dx.doi.org/10.10170S1355617708080302. [DOI] [PMC free article] [PubMed] [Google Scholar]
- Gunning-Dixon FM, Raz N. The cognitive correlates of white matter abnormalities in normal aging: A quantitative review. Neuropsychology. 2000;14(2):224–232. doi: 10.1037//0894-4105.14.2.224. http://dx.doi.org/10.1037/0894-4105.14.2.224. [DOI] [PubMed] [Google Scholar]
- Hall CB, Derby C, LeValley A, Katz MJ, Verghese J, Lipton RB. Education delays accelerated decline on a memory test in persons who develop dementia. Neurology. 2007;69(17):1657–1664. doi: 10.1212/01.wnl.0000278163.82636.30. http://dx.doi.org/10.1212/01.wnl.0000278163.82636.30. [DOI] [PubMed] [Google Scholar]
- Hall CB, Lipton RB, Sliwinski M, Stewart WF. A change point model for estimating the onset of cognitive decline in preclinical Alzheimer’s disease. Statistics in Medicine. 2000;19(11–12):1555–1566. doi: 10.1002/(sici)1097-0258(20000615/30)19:11/12<1555::aid-sim445>3.0.co;2-3. http://dx.doi.org/10.1002/(SICI)1097-0258(20000615/30)19:11/12<1555::AID-SIM445>3.0.CO;2-3. [DOI] [PubMed] [Google Scholar]
- Hall CB, Lipton RB, Sliwinski M, Katz MJ, Derby CA, Verghese J. Cognitive activities delay onset of memory decline in persons who develop dementia. Neurology. 2009;73(5):356–361. doi: 10.1212/WNL.0b013e3181b04ae3. http://dx.doi.org/10.1212/WNL.0b013e3181b04ae3. [DOI] [PMC free article] [PubMed] [Google Scholar]
- Hall CB, Ying J, Kuo L, Lipton RB. Bayesian and profile likelihood change point methods for modeling cognitive function over time. Computational Statistics & Data Analysis. 2003;42(1):91–109. http://dx.doi.org/10.1016/S0167-9473(02)00148-2. [Google Scholar]
- Hall CB, Ying J, Kuo L, Sliwinski M, Buschke H, Katz M, Lipton RB. Estimation of bivariate measurements having different change points, with application to cognitive ageing. Statistics in Medicine. 2001;20(24):3695–3714. doi: 10.1002/sim.1113. http://dx.doi.org/10.1002/sim.1113. [DOI] [PubMed] [Google Scholar]
- Han SD, Nguyen CP, Stricker NH, Nation DA. Detectable neuropsychological differences in early preclinical Alzheimer’s disease: A meta-analysis. Neuropsychology Review. 2017 doi: 10.1007/s11065-017-9345-5. Advance Online Publication. http://dx.doi.org/10.1007/s11065-017-9345-5. [DOI] [PMC free article] [PubMed]
- Hassenstab J, Ruvolo D, Jasielec M, Xiong C, Grant E, Morris JC. Absence of practice effects in preclinical Alzheimer’s disease. Neuropsychology. 2015;29(6):940–948. doi: 10.1037/neu0000208. http://dx.doi.org/10.1037/neu0000208. [DOI] [PMC free article] [PubMed] [Google Scholar]
- Hofer SM, Piccinin AM. Integrative data analysis through coordination of measurement and analysis protocol across independent longitudinal studies. Psychological methods. 2009;14(2):150–164. doi: 10.1037/a0015566. http://dx.doi.org/10.1037/a0015566. [DOI] [PMC free article] [PubMed] [Google Scholar]
- Howieson DB, Carlson NE, Moore MM, Wasserman D, Abendroth CD, Payne-Murphy J, Kaye JA. Trajectory of mild cognitive impairment onset. Journal of the International Neuropsychological Society. 2008;14(2):192–198. doi: 10.1017/S1355617708080375. http://dx.doi.org/10.10170S1355617708080375. [DOI] [PubMed] [Google Scholar]
- Insel PS, Mattsson N, Donohue MC, Mackin RS, Aisen PS, Jack CR, Alzheimer’s Disease Neuroimaging Initiative The transitional association between β-amyloid pathology and regional brain atrophy. Alzheimer’s & Dementia. 2015;11(10):1171–1179. doi: 10.1016/j.jalz.2014.11.002. http://dx.doi.org/10.1016/j.jalz.2014.11.002. [DOI] [PMC free article] [PubMed] [Google Scholar]
- Jacqmin-Gadda H, Commenges D, Dartigues JF. Random changepoint model for joint modeling of cognitive decline and dementia. Biometrics. 2006;62(1):254–260. doi: 10.1111/j.1541-0420.2005.00443.x. http://dx.doi.org/10.1111/j.1541-0420.2005.0. [DOI] [PMC free article] [PubMed] [Google Scholar]
- Ji M, Xiong C, Grundman M. Hypothesis testing of a change point during cognitive decline among Alzheimer’s disease patients. Journal of Alzheimer’s Disease. 2003;5(5):375–382. doi: 10.3233/jad-2003-5504. [DOI] [PubMed] [Google Scholar]
- Johnson DK, Langford Z, Garnier-Villarreal M, Morris JC, Galvin JE. Onset of mild cognitive impairment in Parkinson disease. Alzheimer Disease & Associated Disorders. 2016;30(2):127–133. doi: 10.1097/WAD.0000000000000088. http://dx.doi.org/10.1097/WAD.0000000000000088. [DOI] [PMC free article] [PubMed] [Google Scholar]
- Johnson DK, Storandt M, Morris JC, Galvin JE. Longitudinal study of the transition from healthy aging to Alzheimer disease. Archives of Neurology. 2009;66(10):1254–1259. doi: 10.1001/archneurol.2009.158. http://dx.doi.org/10.1001/archneurol.2009.158. [DOI] [PMC free article] [PubMed] [Google Scholar]
- Joseph L, Wolfson DB, Belisle P, Brooks JO, Mortimer JA, Tinklenberg JR, Yesavage JA. Taking account of between-patient variability when modeling decline in Alzheimer’s disease. American Journal of Epidemiology. 1999;149(10):963–973. doi: 10.1093/oxfordjournals.aje.a009741. http://dx.doi.org/10.1093/oxfordjournals.aje.a009741. [DOI] [PubMed] [Google Scholar]
- Katzman R, Aronson M, Fuld P, Kawas C, Brown T, Morgenstern H, Ooi WL. Development of dementing illnesses in an 80- year- old volunteer cohort. Annals of Neurology. 1989;25(4):317–324. doi: 10.1002/ana.410250402. [DOI] [PubMed] [Google Scholar]
- Kiuchi AS, Hartigan JA, Holford TR, Rubinstein P, Stevens CE. Change points in the series of T4 counts prior to AIDS. Biometrics. 1995:236–248. http://dx.doi.org/10.2307/2533329. [PubMed]
- Koerner FS, Anderson JR, Fincham JM, Kass RE. Change- point detection of cognitive states across multiple trials in functional neuroimaging. Statistics in Medicine. 2017;36(4):618–642. doi: 10.1002/sim.7151. http://dx.doi.org/10.1002/sim.7151. [DOI] [PMC free article] [PubMed] [Google Scholar]
- Lange N, Carlin BP, Gelfand AE. Hierarchical Bayes models for the progression of HIV infection using longitudinal CD4 T-cell numbers. Journal of the American Statistical Association. 1992;87(419):615–626. http://dx.doi.org/10.2307/2290194. [Google Scholar]
- Laukka EJ, MacDonald SW, Fratiglioni L, Bäckman L. Preclinical cognitive trajectories differ for Alzheimer’s disease and vascular dementia. Journal of the International Neuropsychological Society. 2012;18(2):191–199. doi: 10.1017/S1355617711001718. http://dx.doi.org/10.1017/S1355617711001718. [DOI] [PubMed] [Google Scholar]
- Li C, Dowling NM, Chappell R. Quantile regression with a change-point model for longitudinal data: An application to the study of cognitive changes in preclinical Alzheimer’s disease. Biometrics. 2015;71(3):625–635. doi: 10.1111/biom.12313. http://dx.doi.org/10.1111/biom.12313. [DOI] [PMC free article] [PubMed] [Google Scholar]
- MacDonald SW, Hultsch DF, Dixon RA. Aging and the shape of cognitive change before death: terminal decline or terminal drop? The Journals of Gerontology Series B: Psychological Sciences and Social Sciences. 2011;66(3):292–301. doi: 10.1093/geronb/gbr001. http://dx.doi.org/10.1093/geronb/gbr001. [DOI] [PMC free article] [PubMed] [Google Scholar]
- McKhann G, Drachman D, Folstein M, Katzman R, Price D, Stadlan EM. Clinical diagnosis of Alzheimer’s disease: Report of the NINCDS-ADRDA Work Group under the auspices of Department of Health and Human Services Task Force on Alzheimer’s Disease. Neurology. 1984;34(7):939–939. doi: 10.1212/wnl.34.7.939. http://dx.doi.org/10.1212/WNL.34.7.939. [DOI] [PubMed] [Google Scholar]
- McKhann GM, Knopman DS, Chertkow H, Hyman BT, Jack CR, Kawas CH, … Mohs RC. The diagnosis of dementia due to Alzheimer’s disease: Recommendations from the National Institute on Aging-Alzheimer’s Association workgroups on diagnostic guidelines for Alzheimer’s disease. Alzheimer’s & Dementia. 2011;7(3):263–269. doi: 10.1016/j.jalz.2011.03.005. https://doi.org/10.1016/j.jalz.2011.03.005. [DOI] [PMC free article] [PubMed] [Google Scholar]
- Meiberth D, Scheef L, Wolfsgruber S, Boecker H, Block W, Träber F, Walter H. Cortical thinning in individuals with subjective memory impairment. Journal of Alzheimer’s Disease. 2015;45(1):139–146. doi: 10.3233/JAD-142322. http://dx.doi.org/10.3233/JAD-142322. [DOI] [PubMed] [Google Scholar]
- Mitchell AJ, Shiri-Feshki M. Rate of progression of mild cognitive impairment to dementia – meta-analysis of 41 robust inception cohort studies. Acta Psychiatrica Scandinavica. 2009;119(4):252–265. doi: 10.1111/j.1600-0447.2008.01326.x. http://dx.doi.org/10.1111/j.1600-0447.2008.01326.x. [DOI] [PubMed] [Google Scholar]
- Moher D, Liberati A, Tetzlaff J, Altman D, the PRISMA Group Preferred reporting items for systematic reviews and metaanalyses: The PRISMA statement. Annals of Internal Medicine. 2009;151:264–269. doi: 10.7326/0003-4819-151-4-200908180-00135. http://dx.doi.org/10.7326/0003-4819-151-4-200908180-00135. [DOI] [PubMed] [Google Scholar]
- Morris JC. The Clinical Dementia Rating (CDR): Current version and scoring rules. Neurology. 1993;43(11):2412–2414. doi: 10.1212/wnl.43.11.2412-a. http://dx.doi.org/10.1212/WNL.43.11.2412-a. [DOI] [PubMed] [Google Scholar]
- Muniz-Terrera G, van den Hout A, Matthews FE. Random change point models: Investigating cognitive decline in the presence of missing data. Journal of Applied Statistics. 2011;38(4):705–716. http://dx.doi.org/10.1080/02664760903563668. [Google Scholar]
- Muniz-Terrera G, Minett T, Brayne C, Matthews FE. Education associated with a delayed onset of terminal decline. Age & Ageing. 2014;43(1):26–31. doi: 10.1093/ageing/aft150. http://dx.doi.org/10.1093/ageing/aft150. [DOI] [PMC free article] [PubMed] [Google Scholar]
- Muniz-Terrera G, van den Hout A, Piccinin AM, Matthews FE, Hofer SM. Investigating terminal decline: Results from a UK population-based study of aging. Psychology and Aging. 2013;28(2):377–385. doi: 10.1037/a0031000. http://dx.doi.org/10.1037/a0031000. [DOI] [PMC free article] [PubMed] [Google Scholar]
- Palmore E, Cleveland W. Age, terminal decline and terminal drop. Journal of Gerontology. 1976;31(1):76–81. doi: 10.1093/geronj/31.1.76. http://dx.doi.org/10.1093/geronj/31.1.76. [DOI] [PubMed] [Google Scholar]
- Rajan KB, Aggarwal NT, Wilson RS, Everson-Rose SA, Evans DA. Association of cognitive functioning, incident stroke, and mortality in older adults. Stroke. 2014;45(9):2563–2567. doi: 10.1161/STROKEAHA.114.005143. http://dx.doi.org/10.1161/STROKEAHA.114.005143. [DOI] [PMC free article] [PubMed] [Google Scholar]
- Rajan KB, Hebert LE, Scherr PA, de Leon CFM, Evans DA. Rate of cognitive decline before and after the onset of functional limitations in older persons. The Journals of Gerontology Series A: Biological Sciences and Medical Sciences. 2015;70(10):1221–1225. doi: 10.1093/gerona/glv062. http://dx.doi.org/10.1093/gerona/glv062. [DOI] [PMC free article] [PubMed] [Google Scholar]
- Ram N, Gerstorf D, Fauth E, Zarit S, Malmberg B. Aging, disablement, and dying: Using time-as-process and time-as-resources metrics to chart late-life change. Research in Human Development. 2010;7(1):27–44. doi: 10.1080/15427600903578151. http://dx.doi.org/10.1080/15427600903578151. [DOI] [PMC free article] [PubMed] [Google Scholar]
- Rasmusson DX, Carson KA, Brookmeyer R, Kawas C, Brandt J. Predicting rate of cognitive decline in probable Alzheimer’s disease. Brain and Cognition. 1996;31(2):133–147. doi: 10.1006/brcg.1996.0038. http://dx.doi.org/10.1006/brcg.1996.0038. [DOI] [PubMed] [Google Scholar]
- Reeves J, Chen J, Wang XL, Lund R, Lu QQ. A review and comparison of changepoint detection techniques for climate data. Journal of Applied Meteorology and Climatology. 2007;46(6):900–915. http://dx.doi.org/10.1175/JAM2493.1. [Google Scholar]
- Román GC, Tatemichi TK, Erkinjuntti T, Cummings JL, Masdeu JC, Garcia JA, Moody DM. Vascular dementia Diagnostic criteria for research studies: Report of the NINDS-AIREN International Workshop. Neurology. 1993;43(2):250–250. doi: 10.1212/wnl.43.2.250. http://dx.doi.org/10.1212/WNL.43.2.250. [DOI] [PubMed] [Google Scholar]
- Rosen WG, Terry RD, Fuld PA, Katzman R, Peck A. Pathological verification of ischemic score in differentiation of dementias. Annals of Neurology. 1980;7(5):486–488. doi: 10.1002/ana.410070516. http://dx.doi.org/10.1002/ana.410070516. [DOI] [PubMed] [Google Scholar]
- Rubin EH, Storandt M, Miller JP, Kinscherf DA, Grant EA, Morris JC, Berg L. A prospective study of cognitive function and onset of dementia in cognitively healthy elders. Archives of Neurology. 1998;55(3):395–401. doi: 10.1001/archneur.55.3.395. http://dx.doi.org/10.1001/archneur.55.3.395. [DOI] [PubMed] [Google Scholar]
- Sanderson S, Tatt ID, Higgins JP. Tools for assessing quality and susceptibility to bias in observational studies in epidemiology: a systematic review and annotated bibliography. International Journal of Epidemiology. 2007;36(3):666–676. doi: 10.1093/ije/dym018. http://dx.doi.org/10.1093/ije/dym018. [DOI] [PubMed] [Google Scholar]
- Siegler IC. The terminal drop hypothesis: Factor or artifact. Experimental Aging Research. 1975;1(1):169–185. doi: 10.1080/03610737508257957. http://dx.doi.org/10.1080/03610737508257957. [DOI] [PubMed] [Google Scholar]
- Silbert LC, Dodge HH, Perkins LG, Sherbakov L, Lahna D, Erten-Lyons D, Kaye JA. Trajectory of white matter hyperintensity burden preceding mild cognitive impairment. Neurology. 2012;79(8):741–747. doi: 10.1212/WNL.0b013e3182661f2b. http://dx.doi.org/10.1212/WNL.0b013e3182661f2b. [DOI] [PMC free article] [PubMed] [Google Scholar]
- Sliwinski MJ, Hofer SM, Hall C. Correlated and coupled cognitive change in older adults with and without clinical dementia. Psychology and Aging. 2003;18(4):672–683. doi: 10.1037/0882-7974.18.4.672. http://dx.doi.org/10.1037/0882-7974.18.4.672. [DOI] [PubMed] [Google Scholar]
- Sliwinski MJ, Hofer SM, Hall C, Bushke H, Lipton RB. Modeling memory decline in older adults: The importance of preclinical dementia, attrition and chronological age. Psychology and Aging. 2003;18(4):658–671. doi: 10.1037/0882-7974.18.4.658. http://dx.doi.org/10.1037/0882-7974.18.4.658. [DOI] [PubMed] [Google Scholar]
- Sliwinski MJ, Stawski RS, Hall CB, Katz M, Verghese J, Lipton R. Distinguishing preterminal and terminal cognitive decline. European Psychologist. 2006;11(3):172–181. http://dx.doi.org/10.1027/1016-9040.11.3.172. [Google Scholar]
- Spulber G, Niskanen E, MacDonald S, Kivipelto M, Ferreira Padilla D, Julkunen V, Soininen H. Evolution of global and local grey matter atrophy on serial MRI scans during the progression from MCI to AD. Current Alzheimer Research. 2012;9(4):516–524. doi: 10.2174/156720512800492486. http://dx.doi.org/10.2174/156720512800492486. [DOI] [PubMed] [Google Scholar]
- Thorvaldsson V, Hofer SM, Berg S, Skoog I, Sacuiu S, Johansson B. Onset of terminal decline in cognitive abilities in individuals without dementia. Neurology. 2008;71(12):882–887. doi: 10.1212/01.wnl.0000312379.02302.ba. http://dx.doi.org/10.1212/01.wnl.0000312379.02302.ba. [DOI] [PubMed] [Google Scholar]
- Thorvaldsson V, MacDonald SW, Fratiglioni L, Winblad B, Kivipelto M, Laukka EJ, Börjesson-Hanson A. Onset and rate of cognitive change before dementia diagnosis: Findings from two Swedish population-based longitudinal studies. Journal of the International Neuropsychological Society. 2011;17(1):154–162. doi: 10.1017/S1355617710001372. http://dx.doi.org/10.1017/S1355617710001372. [DOI] [PubMed] [Google Scholar]
- Tooth L, Ware R, Bain C, Purdie DM, Dobson A. Quality of reporting of observational longitudinal research. American Journal of Epidemiology. 2005;161(3):280–288. doi: 10.1093/aje/kwi042. http://dx.doi.org/10.1093/aje/kwi042. [DOI] [PubMed] [Google Scholar]
- van den Hout A, Matthews FE. Multi-state analysis of cognitive ability data: A piecewise-constant model and a Weibull model. Statistics in Medicine. 2008;27(26):5440–5455. doi: 10.1002/sim.3360. http://dx.doi.org/10.1002/sim.3360. [DOI] [PubMed] [Google Scholar]
- van den Hout A, Muniz-Terrera G, Matthews FE. Smooth random change point models. Statistics in medicine. 2011;30(6):599–610. doi: 10.1002/sim.4127. http://dx.doi.org/10.1002/sim.4127. [DOI] [PubMed] [Google Scholar]
- van den Hout A, Muniz-Terrera G, Matthews FE. Change point models for cognitive tests using semi-parametric maximum likelihood. Computational Statistics & Data Analysis. 2013;57(1):684–698. doi: 10.1016/j.csda.2012.07.024. http://dx.doi.org/10.1016/j.csda.2012.07.024. [DOI] [PMC free article] [PubMed] [Google Scholar]
- Vandenbroucke JP, Von Elm E, Altman DG, Gøtzsche PC, Mulrow CD, Pocock SJ, Egger M. Strengthening the reporting of observational studies in epidemiology (STROBE): Explanation and elaboration. Annals of internal medicine. 2007;147(8):163–194. doi: 10.7326/0003-4819-147-8-200710160-00010-w1. http://dx.doi.org/10.7326/0003-4819-147-8-200710160-00010-w1. [DOI] [PubMed] [Google Scholar]
- White L, Petrovitch H, Ross GW, Masaki KH, Abbott RD, Teng EL, Chiu D. Prevalence of dementia in older Japanese-American men in Hawaii: the Honolulu-Asia aging study. JAMA. 1996;276(12):955–960. http://dx.doi.org/10.1001/jama.1996.03540120033030. [PubMed] [Google Scholar]
- Wilson RS, Beck TL, Bienias JL, Bennett DA. Terminal cognitive decline: Accelerated loss of cognition in the last years of life. Psychosomatic Medicine. 2007;69(2):131–137. doi: 10.1097/PSY.0b013e31803130ae. http://dx.doi.org/10.1097/PSY.0b013e31803130ae. [DOI] [PubMed] [Google Scholar]
- Wilson RS, Beckett LA, Barnes LL, Schneider JA, Bach J, Evans DA, Bennett DA. Individual differences in rates of change in cognitive abilities of older persons. Psychology and Aging. 2002;17(2):179–193. http://dx.doi.org/10.1037//0882-7974.17.2.179. [PubMed] [Google Scholar]
- Wilson RS, Beckett LA, Bienias JL, Evans DA, Bennett DA. Terminal decline in cognitive function. Neurology. 2003;60(11):1782–1787. doi: 10.1212/01.wnl.0000068019.60901.c1. http://dx.doi.org/10.1212/01.WNL.0000068019.60901.C1. [DOI] [PubMed] [Google Scholar]
- Wilson RS, Boyle PA, Yu L, Segawa E, Sytsma J, Bennett DA. Conscientiousness, dementia related pathology, and trajectories of cognitive aging. Psychology and Aging. 2015;30(1):74–82. doi: 10.1037/pag0000013. http://dx.doi.org/10.1037/pag0000013. [DOI] [PMC free article] [PubMed] [Google Scholar]
- Wilson RS, Leurgans SE, Boyle PA, Bennett DA. Cognitive decline in prodromal Alzheimer disease and mild cognitive impairment. Archives of Neurology. 2011;68(3):351–356. doi: 10.1001/archneurol.2011.31. http://dx.doi.org/10.1001/archneurol.2011.31. [DOI] [PMC free article] [PubMed] [Google Scholar]
- Wilson RS, Leurgans SE, Boyle PA, Schneider JA, Bennett DA. Neurodegenerative basis of age-related cognitive decline. Neurology. 2010;75(12):1070–1078. doi: 10.1212/WNL.0b013e3181f39adc. http://dx.doi.org/10.1212/WNL.0b013e3181f39adc. [DOI] [PMC free article] [PubMed] [Google Scholar]
- Wilson RS, Segawa E, Buchman AS, Boyle PA, Hizel LP, Bennett DA. Terminal decline in motor function. Psychology and Aging. 2012a;27(4):998–1007. doi: 10.1037/a0028182. http://dx.doi.org/10.1037/a0028182. [DOI] [PMC free article] [PubMed] [Google Scholar]
- Wilson RS, Segawa E, Hizel LP, Boyle PA, Bennett DA. Terminal dedifferentiation of cognitive abilities. Neurology. 2012b;78(15):1116–1122. doi: 10.1212/WNL.0b013e31824f7ff2. http://dx.doi.org/10.1212/WNL.0b013e31824f7ff2. [DOI] [PMC free article] [PubMed] [Google Scholar]
- Yang L, Gao S. Bivariate random change point models for longitudinal outcomes. Statistics in Medicine. 2013;32(6):1038–1053. doi: 10.1002/sim.5557. http://dx.doi.org/10.1002/sim.5557. [DOI] [PMC free article] [PubMed] [Google Scholar]
- Yu B, Ghosh P. Joint modeling for cognitive trajectory and risk of dementia in the presence of death. Biometrics. 2010;66(1):294–300. doi: 10.1111/j.1541-0420.2009.01261.x. http://dx.doi.org/10.1111/j.1541-0420.2009.01261.x. [DOI] [PMC free article] [PubMed] [Google Scholar]
- Yu L, Boyle P, Schneider JA, Segawa E, Wilson RS, Leurgans S, Bennett DA. APOE ε4, Alzheimer’s disease pathology, cerebrovascular disease, and cognitive change over the years prior to death. Psychology and aging. 2013;28(4):1015–1023. doi: 10.1037/a0031642. http://dx.doi.org/10.1037/a0031642. [DOI] [PMC free article] [PubMed] [Google Scholar]
- Yu L, Boyle P, Wilson RS, Segawa E, Leurgans S, De Jager PL, Bennett DA. A random change point model for cognitive decline in Alzheimer’s disease and mild cognitive impairment. Neuroepidemiology. 2012;39(2):73–83. doi: 10.1159/000339365. http://dx.doi.org/10.1159/000339365. [DOI] [PMC free article] [PubMed] [Google Scholar]
Associated Data
This section collects any data citations, data availability statements, or supplementary materials included in this article.