

Summary
Long noncoding RNAs (lncRNAs) are commonly dysregulated in tumors, but only a handful are known to play pathophysiological roles in cancer. We inferred lncRNAs that dysregulate cancer pathways, oncogenes, and tumor suppressors (cancer genes) by modeling their effects on the activity of transcription factors, RNA-binding proteins, and microRNAs in 5,185 TCGA tumors and 1,019 ENCODE assays. Our predictions included hundreds of candidate onco- and tumor-suppressor lncRNAs (cancer lncRNAs) whose somatic alterations account for the dysregulation of dozens of cancer genes and pathways in each of 14 tumor contexts. To demonstrate proof of concept, we showed that perturbations targeting OIP5-AS1 (an inferred tumor suppressor) and TUG1 and WT1-AS (inferred onco-lncRNAs) dysregulated cancer genes and altered proliferation of breast and gynecologic cancer cells. Our analysis indicates that, although most lncRNAs are dysregulated in a tumor-specific manner, some, including OIP5-AS1, TUG1, NEAT1, MEG3, and TSIX, synergistically dysregulate cancer pathways in multiple tumor contexts.
Keywords: lncRNA, regulation, modulation, cancer gene, pan-cancer, noncoding RNA, microRNA, RNA-binding proteins, interactome
Graphical Abstract
Highlights
-
•
Hundreds of lncRNAs target cancer genes and pathways in each tumor context
-
•
lncRNA copy numbers are predictive of target cancer gene dysregulation
-
•
Most lncRNAs are predicted to be transcriptional or post-transcriptional specialists
-
•
lncRNAs are predicted to synergistically regulate proliferation pathways in cancer
Chiu et al. present a pan-cancer analysis of lncRNA regulatory interactions. They suggest that the dysregulation of hundreds of lncRNAs target and alter the expression of cancer genes and pathways in each tumor context. This implies that hundreds of lncRNAs can alter tumor phenotypes in each tumor context.
Introduction
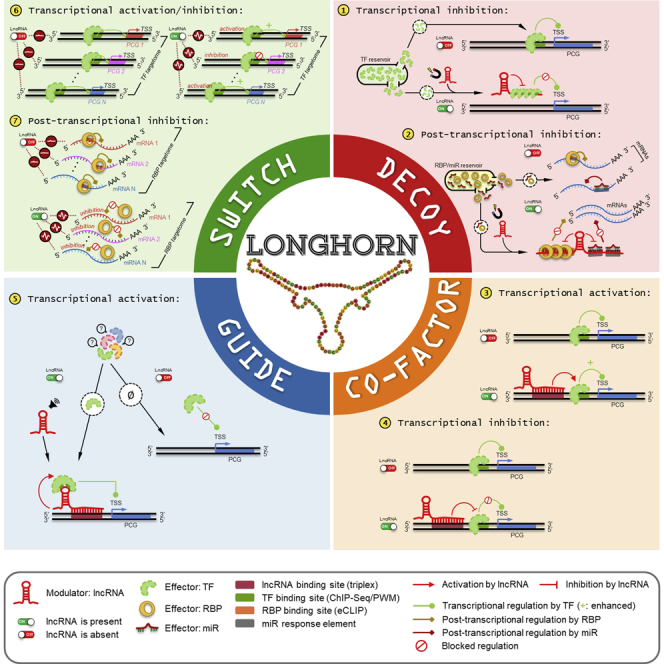
Most cancers exhibit long noncoding RNA (lncRNA) dysregulation by copy number gains and losses (Yan et al., 2015, Beroukhim et al., 2010). However, the consequences of lncRNA dysregulation are known for only a few lncRNAs (Huarte, 2015). Some lncRNAs, including MEG3 in gastric cancer (Sun et al., 2014) and NBAT1 in neuroblastoma (Pandey et al., 2014), function as tumor suppressors, while others, such as HOTAIR in pancreatic cancer (Kim et al., 2013) and MALAT1 in osteosarcoma (Tripathi et al., 2013), are onco-lncRNAs. lncRNAs can alter angiogenesis, proliferation, and metastasis (Yoon et al., 2012, Hu et al., 2014). They are known to be key regulators of chromatin structure and accessibility (Gupta et al., 2010, da Rocha and Heard, 2017), but they also are known to modulate transcriptional activity as co-factors and guides (Prensner et al., 2013, Kim et al., 2013, Wang et al., 2017) and can sponge and inhibit the activity of transcription (Kino et al., 2010, Hung et al., 2011) and post-transcription factors (Hansen et al., 2013, Donnelly et al., 2011, Lee et al., 2016, Rapicavoli et al., 2013).
The number of predicted human lncRNA genes exceeds 10,000 (Djebali et al., 2012, Hon et al., 2017). Consequently, a key open question in RNA cancer biology is: how many lncRNAs have pathophysiologically relevant functions in cancer? Previous efforts to address this question relied on clinical annotation (Yan et al., 2015, Ching et al., 2016)—identifying lncRNAs whose expression is predictive of overall survival and that are co-expressed with cancer genes (Liu and Zhao, 2016, Li et al., 2017)—as well as on proximity to disease-associated genomic polymorphisms, or on context-specific expression (Iyer et al., 2015). All of these efforts identified lncRNAs that may be important in cancer. However, their methodology either did not associate mechanisms and functions with the candidate lncRNAs or it relied on correlations with complex outcomes (Shedden et al., 2008). Our approach was to predict lncRNA targets using models for lncRNA regulation that could be populated using RNA expression profiles and then implicate dysregulated lncRNAs in cancer-relevant activity based on their inferred targets. Toward this aim, we reconstructed lncRNA regulatory networks (lncNETs) using the molecular profiles of primary tumors of The Cancer Genome Atlas (TCGA) and implicated lncRNAs and alterations at their loci with the dysregulation of cancer genes and pathways that are known to influence tumor etiology.
lncNET analysis suggested that hundreds of dysregulated lncRNAs operate as ensembles to dysregulate cancer genes and pathways by altering the activity of transcription factors (TFs), RNA-binding proteins (RBPs), and microRNAs (miRNAs)—effectors or canonical regulators, for short—in each tumor context. Analysis of our lncNETs suggested that many lncRNAs are either transcriptional or post-transcriptional specialists, acting as decoys to titrate effectors (miRNAs, TFs, or RBPs) from their targets, as cofactors or guides to alter TF-promoter interactions, and as molecular switches to alter TF or RBP activity across multiple targets (Figure 1A). Moreover, although cellular localizations for lncRNAs have been determined for <5% of human lncRNA species (Zhang et al., 2017), lncRNAs that were enriched with transcriptional or post-transcriptional interactions in our lncNETs were more likely to be previously classified as nuclear or cytoplasmic, respectively.
Figure 1.

lncNETs in Cancer
(A) LongHorn predicts lncRNA interactions using four models for lncRNA regulation. These include lncRNA decoys that bind and inhibit the activity of TFs, RBPs, and miRNAs (effectors), thus affecting their availability to regulate their targets; co-factors and guides that bind proximal promoters of protein-coding genes (PCGs) and alter their regulation by TFs; and switches that alter the activity of TFs and RBPs across multiple targets.
(B) Our models consider lncRNAs to be modulators of effector activity (i.e., the role of lncRNAs is to alter regulation by effectors). For example, OIP5-AS1 was predicted to modulate effectors that target the preotein coding genes (PCGs) PIK3R1, TCF4, ZEB1, FOXA1, FOXP1, and PTEN in TCGA breast-invasive carcinomas tumors.
(C) Activity modulation by OIP5-AS1 was observed when comparing distance correlation between effectors and targets in samples with low and high OIP5-AS1 abundance. OIP5-AS1 was upregulated in luminal tumors, where it was predicted to enhance IRF4, ETS1, EOMES, and CREB5 activity, leading to dysregulation of their common PCG targets PIK3R1, TCF4, and ZEB1.
(D) OIP5-AS1 was downregulated in basal-like tumors, where it was predicted to inhibit the activity of regulators, including TIA1, MAX, and miR-769-3p, leading to the dysregulation of their targets FOXA1, FOXP1, and PTEN; the top three effectors are shown for each target. ∗p < 5E−2, ∗∗p < 1E−2, ∗∗∗p < 1E−3, and ∗∗∗∗p < 1E−4, as estimated by bootstrapping.
miR, microRNA; PWM, position weight matrices; TSS, transcriptional starting site.
As a proof of principle, we used biochemical assays to test the predictive effects of four lncRNAs, which were chosen to include predicted pan-cancer lncRNAs, a tumor-suppressor lncRNA, onco-lncRNAs, antisense lncRNAs, and intergenic lncRNAs. These assays supported our predictions that OIP5-AS1 is a pan-cancer tumor-suppressor lncRNA, that LINC01184 regulates tumor suppressor genes in basal breast cancer tumors, and that TUG1 and WT1-AS are onco-lncRNAs in ovarian cancer. Our results, although underpowered, suggest good accuracy for our inferred lncNETs, which provide a framework for inferring trans effects for copy number gains and losses at lncRNA loci in cancer.
Results
Summary
We inferred context-specific lncNETs, composed of inferred lncRNA regulatory interactions, for TCGA BLCA, BRCA, CESC, HNSC, KIRC, KIRP, LGG, LIHC, LUAD, OV, PRAD, SKCM, THCA, and UCEC. lncNET inference relied on sequence-based predictions for lncRNA binding sites by Triplexator (Buske et al., 2012) and expression-based evidence for lncRNA modulation of effectors (Sumazin et al., 2011, Wang et al., 2009). Evidence for lncRNA modulation was based on observations from context-specific TF, RBP, and miRNA interaction networks, with lncRNAs modeled as modifiers of effector activity (Figure 1B). Figures 1C and 1D illustrate a key line of evidence for the modulation of cancer genes by OIP5-AS1: distance correlation (Székely et al., 2007) estimates between effectors and targets varied significantly when comparing breast adenocarcinoma samples with low and high OIP5-AS1 abundance. For example, this evidence suggests that OIP5-AS1 activates IRF4 and ETS1 regulation of PIK3R1 (Figure 1C) and inhibits FOXA1 regulation by TIA1 and RBFOX2 (Figure 1D).
To further test whether the expression of coding genes—and cancer genes in particular—may be altered by the dysregulation of their inferred lncRNA regulators, we tested whether lncRNA expression and somatic copy number variations (CNVs) were predictive of target dysregulation after accounting for both CNVs at target loci and expression profiles of the target’s canonical regulators. lncNET analysis suggested that hundreds of lncRNAs regulate cancer genes in each context, most lncRNAs affect transcription and that co-factor lncRNAs predominantly inhibit transcription, transcriptional lncRNAs are enriched for lncRNA-binding sites in core promoters, lncRNA-regulation modality is correlated with their observed cellular localization, and cancer pathways are synergistically regulated by lncRNAs.
Finally, we selected four inferred cancer lncRNAs for biochemical testing in breast and gynecologic tumor cell lines. OIP5-AS1 is a pan-cancer tumor suppressor lncRNA whose locus frequently is lost in basal-like breast and gynecologic carcinomas; OIP5-AS1 was predicted to predominantly target tumor suppressors post-transcriptionally and its silencing confirmed predictions and phenocopied the effects of PTEN—a key tumor suppressor—silencing in breast, ovarian, and endometrial cancer cell lines. LINC01184 is an example of an intergenic lncRNA that targets cancer genes in breast adenocarcinomas. TUG1 and WT1-AS were predicted onco- lncRNAs; their silencing in ovarian serous carcinoma cell lines downregulated oncogenes and reduced proliferation in vitro.
lncRNA Interaction Inference
We constructed tumor type-specific lncNETs using the Long Noncoding RNA Heterogeneous Regulatory Network integrator (LongHorn). LongHorn inferences relied on reverse-engineered canonical interactions, which were predicted using published methods and assays, including ENCODE enhanced version of the crosslinking and immunoprecipitation assay (eCLIP) and chromatin immunoprecipitation sequencing (ChIP-seq) data (Van Nostrand et al., 2016, ENCODE Project Consortium, 2012), TF-promoter prediction methods (Zhou et al., 2010, Bansal et al., 2015, Smith et al., 2005, Smith et al., 2007, ENCODE Project Consortium, 2012, Lefebvre et al., 2010), and miRNA-target and RBP-target prediction methods (Chiu et al., 2015, Chiu et al., 2017, Sumazin et al., 2011). Data are provided in Tables S1, S2, S3, and S4, and predicted canonical interactions are provided in Tables S5, S6, and S7.
LongHorn interactions always include at least one lncRNA, effector, and target (Figure 1B), with most predictions describing interactions between multiple factors. For example, one lncRNA may alter the activity of multiple effectors that target a promoter, or an lncRNA may modulate the activity of an effector on multiple targets. LongHorn integrates RNA-RNA, RNA-DNA, RNA-protein, and DNA-protein-binding evidence with evidence that lncRNAs statistically account for variability in the correlation between effectors and their targets (see detail in STAR Methods and predicted targets in Table S8).
lncRNA Expression and Somatic CNVs Are Predictive of Target Expression
Analysis of our lncNETs showed that although lncRNA-target co-expression did not feature in the construction of lncNETs, lncRNA expression profiles (lncExPs) and copy numbers (lncCNs) often were correlated with the expression profiles of their targets. We used nested regression models to test whether lncExPs and lncCNs are predictive of target expression. Setting both false discovery rate (FDR) < 0.05 and F-test p value < 0.01 cutoffs, we tested whether lncExPs and lncCNs improve our ability to predict target expression after accounting for both target CNVs and the expression profiles of their canonical regulators. Our results suggest that for hundreds of targets in each tumor context, including 28 cancer genes, on average (Table S9), both lncExPs and lncCNs were significantly predictive of target gene expression (Figure 2A). Moreover, the proportion of target expression variability accounted for by lncExPs (Figure 2B) and lncCNs (Figure 2C) were, on average, greater than and nearly equal to the proportions accounted for by target CNVs, respectively. These data suggest that alterations at lncRNA loci account for a significant proportion of the observed dysregulation of dozens of cancer genes in most tested tumor contexts.
Figure 2.

lncRNA Expression Profiles and Copy Numbers Account for Target Dysregulation
(A) The number of targets for which lncExPs and lncCNs were significantly predictive (p < 0.01 and FDR < 0.05) of target expression after accounting for the potential effects of target copy numbers (PCGCN) and the influence of their canonical regulators TFexp, RBPexp, and miRNAexp (reduced model). p Values were calculated by the F-test, comparing full models, which included either lncExPs or lncCNs, and the reduced model; FDRs were estimated using permutation tests. We distinguished between lncRNA targets that are cancer genes and other PCGs; cancer gene counts are given as data labels. Both lncExPs and lncCNs accounted for cancer gene expression variability for a median of 28 cancer genes per tumor context.
(B) The proportion of expression variability (R2) of PCG targets whose expression was significantly predicted by lncExPs that were accounted for by their CNVs, as well as expression profiles of their predicted canonical regulators, and lncExPs; the x axis shows target counts for each tumor type.
(C) Similarly, expression variability for targets whose expression was significantly predicted by lncCNs that was accounted for by their CNVs, canonical regulators, and lncCNs. R2 for lncExPs and lncCNs are given as data labels; SEs are shown.
Enrichment of lncRNA Binding Sites in Core Promoters
Analogous to predicted TF binding sites (Long et al., 2004, Gotea et al., 2010, Koudritsky and Domany, 2008), predicted lncRNA-promoter binding sites (lncBS) were enriched in core promoters—in other words, 50 bases upstream of transcription start sites (Figure 3A); the position of lncBSs in proximal promoters did not play a role in their prediction. Similar to observations for TF binding sites (Zhou et al., 2010), lncBS multiplicity in core promoters was an indicator of predicted interactions (Figure 3B) and was predictive of lncRNA-target co-expression (Figure 3C). When making these comparisons, we contrasted the enrichment of lncRNA-target interactions with lncBSs outside the core promoter to the enrichment of lncRNA-target interactions with one or multiple binding sites in the core promoter.
Figure 3.

Transcriptional and Post-transcriptional Specialists
(A) Predicted TF binding sites (TFBSs) and lncBSs—both based on sequence evidence alone and according to LongHorn—were enriched in core promoters, [−50,0] relative to TSSs. Random lncBSs were produced by di-nucleotide shuffling and reanalyzing proximal promoters 10 times, the standard deviation is shown; 2-kb promoters were partitioned into 40 bins based on distance from the TSS, with binding sites assigned to bins based on the location of their center; p value estimated by chi-square test.
(B) More predicted interactions had multiple core-promoter binding sites. Predicted TF and lncRNA targets showed 9- and 4-fold enrichments for TFBS and lncBS multiplicity in core promoters, respectively; LongHorn-predicted targets were significantly more enriched than predictions based on sequence evidence alone. p values estimated by chi-square test; SE relative to random shown.
(C) LongHorn-predicted interactions with more core-promoter lncBSs were more significantly correlated. We mapped the proportion of lncRNA-target interactions whose correlation was significant at p values from 1E−2 to 1E−5. The number of core-promoter lncBSs was predictive of distance correlations (dCors) between expression profiles of lncRNAs and their targets, irrespective of the prediction significance cutoff used; p values estimated by U test.
(D) The majority of predicted co-factor interactions showed inhibition of TF activity by lncRNAs; ratios between the numbers of TF inhibitions and activations are shown.
(E) Most lncRNAs were enriched for TF modulation—these had transcriptional to post-transcriptional log2 fold-change ≥0.5; the ratio between the number of transcriptional to post-transcriptional specialists (given as data labels) for each tumor type are shown at the top of the figure—and the fewest showed a balance between transcriptional and post-transcriptional regulation; the x axis shows the number of tested lncRNAs for each tumor type.
(F) lncRNAs that had an unusual number of predicted transcriptional or post-transcriptional targets when compared to other lncRNAs; most of these were in agreement with known lncRNA localization as curated by RNALocate (p < 0.05, FET). lncRNAs with verified localization are marked with filled data points.
(G) High-confidence interactions where lncRNAs, including OIP5-AS1, NEAT1, and TUG1, were predicted to modulate regulators of TFs and RBPs and were correlated with the expression of the targets of these TFs and RBPs. The 40 lncRNAs with the most TF and RBP targets and the 40 most frequent target TFs and RBPs were included; the total number of predicted interactions across the 14 tumor types is given at right.
(H) These high-confidence interactions were enriched (p < 1E−16) for inference in multiple tumor types. Errors are shown as SEMs.
Transcriptional and Post-transcriptional Specialists
A comparison of the transcriptional and post-transcriptional components of LongHorn lncNETs suggested that most lncRNAs are either guides or co-factors; it is interesting that the majority of co-factor interactions were predicted to inhibit TF activity (Figure 3D). The number of transcriptional interactions was more than three times that of post-transcriptional interactions, and, on average, 44% of lncRNAs were enriched for transcriptional interactions, even after normalization to equate the sizes of the transcriptional and post-transcriptional subnetworks (Figure 3E).
Many lncRNAs were inferred as either predominantly transcriptional or post-transcriptional regulators. To study these further, we identified lncRNAs with a significant number of transcriptional or post-transcriptional targets (FDR < 0.01); these are highlighted in Figure 3F and Table S10. Transcriptional regulators included known nuclear lncRNAs—NEAT1, XIST, and TSIX—and post-transcriptional regulators included known cytoplasmic lncRNAs—OIP5-AS1, SNHG1, and SNHG12. To evaluate the correspondence between predicted regulatory modalities and observed localization, we indicated transcriptional and post-transcriptional specialists based on target enrichment (FDR < 0.01) and nuclear and cytoplasmic lncRNAs as recorded by RNALocate (Zhang et al., 2017). A comparison of these categories suggested that transcriptional and post-transcriptional specialists were more likely to be nuclear and cytoplasmic, respectively (p < 0.05 by Fisher extract test [FET]).
Indirect Evidence for Altering Transcription Factor and RBP Activity
We collected additional supportive evidence for the effect of lncRNAs on TF and RBP abundance by testing for indirect correlation between lncRNAs and targets of these canonical regulators. lncRNAs that modulate effectors that target TFs and RBPs are expected to be correlated with the targets of these TFs and RBPs (Chiu et al., 2015). We tested indirect regulation by lncRNA through gene set enrichment of targets of these canonical regulators—the TFs and RBPs whose effectors lncRNA modulates—by ordinally comparing their correlations with lncRNAexp to lncRNAexp’s correlations with all expressed genes. Full results are provided in Table S11, and lncRNAs that modulated the regulation of the greatest number of canonical regulators are presented in Figure 3G. Some of these predictions, including modulation of FOXA1 and ZEB1 by OIP5-AS1, were biochemically verified in cell lines. Our results suggest that modulation of TF and RBP targets is significantly more context independent than other lncNET interactions (Figure 3H).
Pan-Cancer Pathway Regulation by lncRNAs
Inferred co-regulation by multiple lncRNAs in multiple tumor types, as shown in Figure 3G, suggested that lncRNAs may synergistically regulate cancer genes and pathways. We identified lncRNAs whose targets are enriched (FDR < 0.01 by adjusted FET) in MSigDB’s Hallmark Gene Set (HGS) pathways across multiple tumor contexts (Subramanian et al., 2005, Liberzon et al., 2015) (see Table S12). Some of these pathways were enriched for lncRNA regulation in each tumor context. To quantify pathway regulation by lncRNAs, we evaluated each pathway by combining lncRNA regulation significance using the method of Stouffer et al. (1949). The result (Figure 4A) suggests that multiple pathways (40 of the 50 HGS pathways), including proliferation, immune, and signaling pathways, as well as the oxidative phosphorylation and epithelial-mesenchymal transition pathways, were targeted by lncRNAs in most tumor contexts.
Figure 4.

lncRNAs Are Predicted to Synergistically Target Regulatory Pathways
(A) lncRNAs are predicted to target most pathways in MSigDB’s HGS, including proliferation, immune response, signaling, and DNA damage pathways in multiple tumor types. Regulation strength was calculated by combining z scores across enriched lncRNAs (FDR < 0.01); lncRNA identities are provided in Table S12.
(B) More than 40 lncRNAs were predicted, in >10 instances, to regulate pathways across tumor types.
(C) Pathways that were predicted to be targeted synergistically by lncRNAs (FDR < 0.01).
(D) The predicted synergy between the 25 lncRNAs (from [B] with the greatest number of co-regulated pathways).
lncRNAs whose predicted targets were enriched in more than 10 HGS pathways across tumor types are presented in Figure 4B; this selection identified pan-cancer lncRNAs that potentially affect multiple biological functions in tumors. These lncRNAs, including MEG3, which was predicted to target epithelial-mesenchymal transition in multiple tumor types (Cheng et al., 2013), are identified in Table S12. Twenty-six lncRNA-pathway interactions were inferred in at least 7 of our 14 tumor contexts, and 96% (25 of 26) of these were associated with proliferation (Figure 4B). Our results also suggest that some key pathways are enriched for synergetic regulation by lncRNAs (Figure 4C; FDR < 0.01, estimated by bootstrapping), while some lncRNAs synergistically regulate multiple cancer pathways. Figure 4D shows predicted synergy between lncRNAs with the greatest number of co-regulated pathways from Figure 4B; these lncRNAs target nine pathways in multiple tumor types (full results provided in Table S13). Synergy predictions include known cofactors MALAT1 and NEAT1 (West et al., 2014), as well as post-transcriptional regulators OIP5-AS1, SNHG1, and HNRNPU-AS1.
To test prediction accuracy at a genome-wide level, we compared LongHorn predictions in BRCA to results from a cell-growth CRISPRi screen in MCF7 and MDA-MB-231 (Liu et al., 2017). In total, Liu et al. identified 69 lncRNAs that are expressed in BRCA and found evidence for influencing cell growth in either MCF7 or MDA-MB-231 (score >7). Of 6,435 candidates, LongHorn inferred 353 (5%) lncRNA regulators of MSigDB proliferation pathways (FDR < 0.01), including 14 of the 69 (20%) that were identified by Liu et al. for an agreement p value <1.4E−5 (FET p value [pFET]).
OIP5-AS1 Is a Tumor-Suppressor lncRNA in Basal-like BRCA and Gynecologic Tumors
To identify candidate pan-cancer lncRNAs, we selected frequently altered lncRNAs with predicted cancer gene targets in multiple lncNETs that were differentially expressed (FDR < 0.01 by U test comparing tumor and adjacent samples) in the majority of tumor contexts and that had variable copy numbers and expression profiles across tumors. Variable copy numbers and expression profiles had median absolute deviation scores >0 and >0.2, respectively (Rousseeuw and Croux, 1993); selected lncRNAs were altered in ≤10% of the samples and were enriched for cancer gene targets (FDR < 0.01 by FET). In total, 103 lncRNA species satisfied these criteria and were selected as candidates (Figure 5A). When compiling predicted targets across all tumor contexts, some of these candidates, including OIP5-AS1, were predicted to regulate hundreds of cancer genes (Figure 5B). Both OIP5-AS1 expression and CNV profiles suggested that it is frequently deleted (Figure 5C) and downregulated (Figure 5D) in basal-like BRCA, OV, and serous-like UCEC. OIP5-AS1 was predicted to target known tumor suppressors in these tumor types, including FOXA1, GATA3, PTEN, and ZEB1; these and other selected target cancer genes are downregulated in basal-like BRCA in both TCGA and METABRIC (Curtis et al., 2012) datasets (Figure 5E).
Figure 5.

OIP5-AS1 Dysregulation Is Predicted to Alter Cancer Gene Expression in Multiple Tumor Types
(A) More than 100 lncRNAs were dysregulated in the majority of tumor types relative to tumor-adjacent samples, altered by copy number gains or losses in the majority of tumor types, and targeted cancer genes in the majority of tumor types.
(B) Of these, averaging across the 14 tumor types, NEAT1, LINC00969, MALAT1, and OIP5-AS1 were predicted to have the most cancer gene targets (top), and NEAT1, MALAT1, and OIP5-AS1 but not LINC00969 were highly expressed on average across tumor contexts (bottom); OIP5-AS1 and TUG1 (yellow highlight) were predicted to be pan-cancer regulators and were biochemically evaluated.
(C) OIP5-AS1 was enriched for copy number losses in BRCA and gynecologic tumors (U test, red highlight).
(D) OIP5-AS1 expression was significantly lower in basal-like BRCAs and serous-like UCECs, as was the copy number of its locus.
(E) OIP5-AS1 targets were significantly downregulated in basal-like BRCAs according to both TCGA and METABRIC profiles (U test).
(F) OIP5-AS1 was predicted to modulate the activity of multiple effectors of a cancer gene panel (Figures 1C and 1D). Its expression profiles were not correlated with the profiles of the effectors it modulates (gray), but they were correlated with the profiles of their targets (red); control (black) included genes with no significant (p > 0.1) dCor with OIP5-AS1 expression.
(G) OIP5-AS1 predicted targets were enriched for cancer genes in BRCA (by Fisher’s exact test).
(H) Some of these, including FOXA1, FOXP1, GATA3, PIK3R1, PTEN, TCF4, and ZEB1, were predicted in at least three tumor types, including BRCA, OV, and UCEC. Biochemically tested targets in boldface type.
RPKM, reads per kilobase per million.
To demonstrate the expression-based rationale for predicting these interactions, we note that evidence for their regulation by OIP5-AS1 is indirect: OIP5-AS1 is predicted to modulate the activity of canonical regulators that target these genes. To observe modulation by OIP5-AS1, we compared distance correlations between effectors and targets in tumors in which OIP5-AS1 expression is low and in tumors in which OIP5-AS1 expression is high (Figures 1C and 1D). The correlation between OIP5-AS1 expression and the expression of its targets but not their effectors may be significant, but this is incidental because these targets were not selected for co-expression with OIP5-AS1 (see Figure 5F). OIP5-AS1 targets were enriched for cancer genes in BRCA (Figure 5G), including targets that were inferred in multiple breast and gynecologic tumors (Figure 5H).
We selected seven predicted OIP5-AS1 cancer gene targets that were inferred in BRCA, in OV, and in UCEC for perturbation testing (Figure 5H). These targets, including PTEN, are known to play key roles in each of the three tumor types, and they were downregulated following RNAi-mediated silencing of OIP5-AS1 in premalignant (Figure 6A), claudin-low triple-negative (Figure 6B), and basal-like (Figure 6C) BRCA cell lines, and in ovarian (Figures 6D and 6E) and endometrial (Figures 6F and 6G) cancer cell lines. Primer sequences are provided in Table S15. Focusing on PTEN, we showed that siRNA (si)OIP5-AS1 downregulated PTEN-protein expression (Figures 6H–6J) and that siOIP5-AS1 phenocopied siPTEN transfections and upregulated cell growth estimates of MDA-MB-231 (Figure 6K), OVCAR-3 (Figure 6L), and ECC-1 (Figure 6M), supporting its effects on tumor proliferation in all three tumor contexts. To test our predictions on a genome-wide scale, we profiled gene expression by total RNA-seq following siOIP5-AS1 transfections in MDA-MB-231 and ECC-1. Our analysis, presented in Figure S1, suggested a significant enrichment for predicted OIP5-AS1 post-transcriptional targets among genes that were downregulated following siOIP5-AS1 transfections.
Figure 6.

RNAi-Mediated Silencing of OIP5-AS1
(A–G) siOIP5-AS1 transfections downregulated OIP5-AS1 and LongHorn-inferred targets (green), but not controls (gray), in (A) premalignant, (B) claudin-low triple-negative, and (C) basal-like BRCA cell lines, as well as in ovarian cancer cell lines (D) OVCAR-3 and (E) SK-OV-3 and endometrial cancer cell lines (F) ECC-1 and (G) Ishikawa. p values are estimated by t test.
(H–J) PTEN protein expression was downregulated in MDA-MB-231 (H), OVCAR-3 (I), and ECC-1 (J) cells 96 and 120 hr after siOIP5-AS1 and siPTEN transfections.
(K–M) siOIP5-AS1 and siPTEN transfections upregulated (K) MDA-MB-231, (L) OVCAR-3, and (M) ECC-1 cell growth; proliferation fold changes were measured as cell counts relative to counts before small interfering RNA (siRNA) transfection (day 0). p values were calculated using two-tailed Student’s t tests and compared using Fisher’s exact test across days.
Representative images of tumor-cell growth assays are shown. Errors are shown as SEMs. n.e., not expressed. ∗p < 5E−2, ∗∗p < 1E−2, ∗∗∗p < 1E−3, and ∗∗∗∗p < 1E−4.
LINC01184, WT1-AS, and TUG1 Regulate Cancer Genes
As was the case for OIP5-AS1, we selected TUG1 and WT1-AS as examples of oncogene-like lncRNAs in OV based on their predicted targets, including the oncogenic RAS/mitogen-activated protein kinase (MAPK) pathway (Zhang and Liu, 2002). LINC01184 was selected as an example of an lncRNA that regulates cancer genes in BRCA. LINC01184 is downregulated in basal-like BRCA (Figure 7A), and WT1-AS is dramatically upregulated in OV (Figure 7B) in a cancer-specific manner. TUG1 is predicted to regulate key members of the RAS/MAPK pathway in OV (Figure 7C) and most other tumor types; all three lncRNA species were enriched for cancer gene targets after multiple testing corrections (Figure 7D). RNAi-mediated silencing of LINC01184 downregulated its predicted targets in the breast cancer cell lines MDA-MB-231 and MDA-MB-468 (Figures 7E and 7F), and WT1-AS and TUG1 silencing in ovarian cell lines downregulated their predicted targets in SK-OV-3 and OVCAR-3 (Figures 7G–7J). Moreover, confirming our predictions, WT1-AS and TUG1 silencing reduced SK-OV-3 and OVCAR-3 cell growth (Figures 7K–7N).
Figure 7.

RNAi-Mediated Silencing of LINC01184, TUG1, and WT1-AS
(A and B) (A) LINC01184 was significantly downregulated in BRCA by U test, and (B) WT1-AS was upregulated in OVs.
(C) TUG1 was predicted to target RAS/MAPK pathway genes and was a predicted onco-lncRNA in OV and other tumor contexts.
(D) LINC01184 (in BRCA) and TUG1 and WT1-AS (in OV) predictions were enriched for cancer gene targets (FDR < 0.01, FET).
(E and F) LINC01184 silencing in (E) BRCA MDA-MB-231 and (F) BRCA MDA-MB-468.
(G–J) WT1-AS (G, SK-OV-3; H, OVCAR-3) and TUG1 (I, SK-OV-3; J, OVCAR-3) silencing in OV cell lines downregulated the expression of their predicted targets (green).
(K–N) WT1-AS (K, SK-OV-3; L, OVCAR-3) and TUG1 (M, SK-OV-3; N, OVCAR-3) silencing in OV cell lines decreased cell growth, in contrast to PTEN silencing, which increased cell growth. Proliferation fold changes were measured as cell counts relative to counts before siRNA transfection (day 0). p values were calculated using two-tailed Student’s t tests and compared using Fisher’s exact tests across days.
Representative images of tumor-cell growth assays are shown. Errors are shown as SEMs.; n.e., not expressed. ∗p < 5E−2, ∗∗p < 1E−2, and ∗∗∗p < 1E−3.
Discussion
Here, we described LongHorn, a pipeline to reverse engineer lncNETs and predict both targets and consequences of lncRNA dysregulation. LongHorn relies on multiple algorithms to make predictions about lncRNA, TF, and mRNA binding sites, and these algorithms are known to be imprecise. To overcome precision issues, LongHorn integrates predictions by multiple methods across multiple interactions—(target, effector, lncRNA) triplets—when inferring lncRNA modulation. Analysis of these lncNETs in 14 tumor types identified lncRNAs whose dysregulation altered cancer genes and pathways, and biochemical assays confirmed the effects of predicted onco- and tumor-suppressor lncRNAs on cancer cell proliferation. While only a handful of lncRNAs are known to be relevant in cancer (Schmitt and Chang, 2016, Yan et al., 2015), our results suggest that the dysregulation of hundreds of lncRNAs may alter cancer pathophysiology in each tumor context. Our study was based on the reasoning that lncRNA regulators of known cancer genes also may play roles in cancer (Oliver, 2000) and that predictive CNVs at the loci of these regulators may contribute to cancer etiology. Consequently, we attributed oncogenic and tumor-suppressive roles to lncRNAs that were predicted to target and dysregulate cancer genes and pathways.
Our analysis suggests that extensive lncNETs are regulating hundreds of genes, including dozens of cancer genes, in each tumor context and that somatic CNVs at hundreds of lncRNA loci contribute to cancer gene dysregulation and, by extension, tumor pathology in each context. While the majority of cancer lncRNAs were predicted to act in a context-specific manner, dozens of lncRNAs, including OIP5-AS1, TUG1, NEAT1, MALAT1, XIST, and TSIX, were inferred to synergistically regulate cancer genes and pathways across multiple tumor contexts. Further analyses of our lncNETs pointed to lncBS enrichment in core promoters and suggested that lncBS multiplicity in core and proximal promoters are predictive of the magnitude of the regulatory effects of lncRNAs that regulate transcription. We inferred some lncRNAs as transcriptional and others as post-transcriptional specialists and found that inferred regulatory modalities are consistent with known cellular localization for these lncRNAs. These observations, particularly our interpretation of the function of alterations that target lncRNA loci in cancer, suggest that lncNETs can be a valuable resource for studying lncRNA regulation and the effects of lncRNAs on tumor etiology in a multitude of cancer contexts.
To test the pathophysiological relevance of predicted cancer lncRNAs, we compared LongHorn predictions of lncRNAs targeting proliferation pathways in BRCA to predictions from a genome-wide CRISPRi screen in breast cancer cell lines (Liu et al., 2017). Our results suggested a close concordance (p < 1.4E−5) between LongHorn predictions in primary breast cancer tumors and the genome-wide screen in breast cancer cell lines. Furthermore, we biochemically tested the effects of silencing each of three lncRNAs on both their target expression and cancer cell growth. RNAi-mediated silencing of OIP5-AS1 in breast, ovarian, and endometrial cancer cell lines downregulated tumor suppressors in these tumor contexts and accelerated cell growth, supporting its predicted role as a tumor suppressor. In contrast, TUG1 and WT1-AS were inferred as pan-cancer and OV-specific onco-lncRNAs, respectively, and their silencing downregulated oncogenes and reduced ovarian cancer cell growth, supporting their predicted roles in OV. We note that RNAi is more suitable for targeting RNA in the cytoplasm and that not all lncRNAs will be effectively downregulated by RNAi. Moreover, RNA-seq assays confirmed the accuracy of OIP5-AS1-target predictions and suggested that the majority of its predicted targets responded to its silencing in each context. In total, we inferred hundreds of thousands of lncRNA-target interactions in each context, tested seven types of interactions in multiple tumor contexts, and supported the majority of tested interactions with biochemical evidence based on lncRNA perturbations in multiple cell lines.
Our pan-cancer effort identified hundreds of candidate cancer lncRNAs based on reconstructed lncNETs that included interactions, binding sites, and modulated regulators. lncNETs provide a resource for studying cancer lncRNAs and their potential to dysregulate cancer pathways and influence tumorigenesis as onco- and tumor-suppressor genes. Candidate cancer lncRNAs include predictive biomarkers and may include candidate therapeutic targets for gene editing and RNA therapeutic strategies (Sullenger and Nair, 2016).
STAR★Methods
Key Resources Table
| REAGENT or RESOURCE | SOURCE | IDENTIFIER |
|---|---|---|
| TaqMan probes | ||
| GAPDH | Applied Biosystems | Hs02786624_g1 |
| GATA3 | Applied Biosystems | Hs00231122_m1 |
| PTEN | Applied Biosystems | Hs02621230_s1 |
| FOXA1 | Applied Biosystems | Hs04187555_m1 |
| Critical Commercial Assays | ||
| TruSeq RNA Access Library Prep Kit | Illumina | RS-301-2001 |
| RNeasy Plus Micro kit | QIAGEN | 74034 |
| KiCqStart SYBR green primers | ||
| Primers for 22 target genes | Sigma-Aldrich | Table S15 |
| Deposited Data | ||
| CancerGenes Database | Higgins, et, al. 2007 | http://cbio.mskcc.org/CancerGenes/ |
| Chen et al. | Chen et al., 2008 | Chen et al., 2008 |
| ENCODE | Encode consortium | https://www.encodeproject.org/ |
| Factorbook | Wang et al., 2012 | Wang et al., 2012 |
| Frederic Bushman’s cancer gene set | Frederic Bushman | http://www.bushmanlab.org/links/genelists |
| HOCOMOCO | Kulakovskiy et al., 2013 | autosome.ru/hocomoco |
| HTRIdb | Bovolenta et al., 2012 | https://omictools.com/htridb-tool |
| HumanTF | Jolma et al., 2013 | Jolma et al., 2013 |
| JASPAR 5.0 | Sandelin et al., 2004 | http://jaspar.genereg.net/ |
| Lawrence et al. | Lawrence et al., 2014 | Lawrence et al., 2014 |
| METABRIC | Curtis et al., 2012 | http://molonc.bccrc.ca/aparicio-lab/research/metabric/ |
| miRBase R21 | Kozomara and Griffiths-Jones, 2014 | http://www.mirbase.org/ |
| miRecords | Xiao et al., 2009 | http://c1.accurascience.com/miRecords/ |
| MSigDB in 09/04/2016 | Liberzon et al., 2015 | http://software.broadinstitute.org/gsea/msigdb/collections.jsp |
| Network of Cancer Genes 5.0 | An et al., 2016 | http://ncg.kcl.ac.uk |
| Rahman | Rahman, 2014 | Rahman, 2014 |
| RNA-seq fastq files | This paper | ENA PRJEB21799 |
| Sanger Cancer Gene Census | Futreal et al., 2004 | http://cancer.sanger.ac.uk/ |
| SwissRegulon 3/18/2014 | Pachkov et al., 2007 | http://swissregulon.unibas.ch/sr/ |
| Tamborero et al. | Tamborero et al., 2013 | Tamborero et al., 2013 |
| TANRIC. 1.0.6 based on Gencode Release 19 | Li et al., 2015 | http://bioinformatics.mdanderson.org/main/TANRIC:Overview |
| TarBase | Vlachos et al., 2015 | http://diana.imis.athena-innovation.gr/DianaTools/index.php?r=tarbase/index |
| TCGA miRNA-seq | Firehose | 2015_04_02 stddata Run |
| TCGA RNA-seq, May 12th 2015 | TCGA | TCGA data portal |
| TCGA SNP Array, May 14th 2015 | TCGA | TCGA data portal |
| TRANSFAC, February 2013 | Matys et al., 2006 | http://gene-regulation.com/pub/databases.html |
| Tumor-Associated Gene Database | TAG | http://www.binfo.ncku.edu.tw/TAG |
| Waldman gene set | Waldman lab | NA |
| Whitfield et al. | Whitfield et al., 2012 | NA |
| Experimental Models: Cell Lines | ||
| ECC-1 | BCM’s Tissue Culture advance core facility | ECC-1 |
| Ishikawa | BCM’s Tissue Culture advance core facility | Ishikawa |
| MCF10-A | BCM’s Tissue Culture advance core facility | MCF10-A |
| MDA-MB-231 | BCM’s Tissue Culture advance core facility | MDA-MB-231 |
| MDA-MB-468 | BCM’s Tissue Culture advance core facility | MDA-MB-468 |
| OVCAR-3 | BCM’s Tissue Culture advance core facility | OVCAR-3 |
| SK-OV-3 | BCM’s Tissue Culture advance core facility | SK-OV-3 |
| Oligonucleotides | ||
| siLINC01184 | Dharmacon (GE) | R-036670-00-0005 |
| siOIP5-AS1 | Dharmacon (GE) | R-181553-00-0005 |
| siTUG1 | Dharmacon (GE) | R-018202-00-0005 |
| siWT1-AS | Dharmacon (GE) | R-013209-00-0005 |
| Software and Algorithms | ||
| Birdsuite | Korn et al., 2008 | https://www.broadinstitute.org/birdsuite/birdsuite |
| Cufflinks v2.02 | Trapnell et al., 2012 | http://cole-trapnell-lab.github.io/cufflinks |
| Cupid | Chiu et al., 2015 | http://cupidtool.sourceforge.net/ |
| Glmnet | Friedman et al., 2010 | https://web.stanford.edu/∼hastie/glmnet_matlab/ |
| GSEA | Subramanian et al., 2005, Mootha et al., 2003 | http://software.broadinstitute.org/gsea/index.jsp |
| LIBSVM (ver.3.20) | Chang and Lin, 2011 | https://www.csie.ntu.edu.tw/∼cjlin/libsvm/ |
| Molecular Devices StainFree Cell Detection Algorithm | Molecular Devices | NA |
| phastCons | Siepel et al., 2005 | https://genome.ucsc.edu/goldenPath/help/phastCons.html |
| Picard tools v1.54 | broadinstitute | http://picard.sourceforge.net/ |
| SAMtools | Li et al., 2009 | http://samtools.sourceforge.net/ |
| STAR v2.3.0e | Dobin et al., 2013 | https://github.com/alexdobin/STAR |
| Triplexator | Buske et al., 2012 | http://bioinformatics.org.au/tools/triplexator/ |
| ushuffle | Jiang et al., 2008 | http://digital.cs.usu.edu/∼mjiang/ushuffle/ |
| Birdsuite | Korn et al., 2008 | https://www.broadinstitute.org/birdsuite/birdsuite |
Contact and Reagent Resource Sharing
Further information and requests for resources and reagents should be directed to and will be fulfilled by the Lead Contact, Pavel Sumazin (sumazin@bcm.edu).
Experimental Model and Subject Details
Cell lines
Cell lines, including MCF10-A, MDA-MB-468, MDA-MB-231, OVCAR-3, SK-OV-3, ECC-1, and Ishikawa were purchased frozen from BCM’s Tissue Culture advance core facility. These were cultured in tiny flasks, split, tested for mycoplasma contamination, and transfected with NT or lncRNA-targeting siRNAs. ECC-1 cells were cultured in DMEM F-12 Ham’s (1:1) Mixture + 10% FBS-Heat Inactivated + Penicillin/ Streptomycin; OVCAR3 cells in RPMI + 10% FBS; SK-OV-3 in RPMI + 10% FBS; Ishikawa in MEM (1X) + 10% FBS; MDA-MB-231 in DMEM with 10% FBS; MDA-MB-468 in Leibovitz’s (1X) with 10% FBS; and MCF-10A in DMEM/ Ham’s F-12 with 5% Horse Serum, 5μg/ml Insulin, 1X Penicillin/ Streptomycin, 100ng/ml Cholera Toxin, 20 ng/ml EGF, 0.5μg/ml Hydrocortisone. Cell lines were chosen from those profiled by CCLE (Barretina et al., 2012), when possible, with availability and transfection efficiency taken in consideration; CCLE was used to identify cell lines that express lncRNAs and target of interest. Consequently, while the cell lines chosen here are commonly used models for studying cancer, they may not necessarily be the best available molecular models for their corresponding tumor types or subtypes.
siRNAs identities
We used ON-TARGETplus siRNAs from Dharmacon (GE) to target OIP5-AS1, TUG1, WT1-AS, and LINC01184.
Primers and probes used
We used both TaqMan probes and SYBR green primers for estimating gene expression by qPCR. Probes for estimating GAPDH, FOXA1, PTEN and GATA3 expression were purchased from Applied Biosystems. KiCqStart SYBR green primers for real-time qPCR were purchased from Sigma-Aldrich; their identities are given in Table S15. SYBR green primers were also used to estimate expression for GAPDH.
Cell growth assays
To test the effect of siRNA-mediated lncRNA silencing on cell growth we plated OVCAR-3, SK-OV-3, MDA-MB-231 and ECC-1 cells in 96-well plates using either 1,000 cells per well (OVCAR-3 and SK-OV-3) or 3,000 cells per well (MDA-MB-231 and ECC-1). Cells, using 3 biological replicates, were cultured for two days before transfection and then counted on a daily basis using a SpectraMax i3/i3x Multi-Mode Detection Platform. Cells were counted immediately before transfection (day 0) and for up to 6 days following transfection using Molecular Devices StainFree Cell Detection Algorithm for bright field cell segmentation. Cells, grown and counted in the same wells through the duration of the experiment, with media unchanged following siRNA transfection (media was changed once, one day after transfection), were photographed covered once per day and counted using Molecular Devices pre-set cell-recognition settings, including the cell type A setting for OVCAR-3 and ECC1, and the cell type D setting for SK-OV-3 and MDA-MB-231. OVCAR-3 cells proliferated faster than ECC1 and MDA-MB-231, and the assay was stopped after four days instead of six. Growth fold change of OVCAR-3 cells after four days was comparable to that of MDA-MB-231 cells after six days. Representative plate images, which were used to estimate cell counts, were also used to visualize cell growth at each day.
Western blot analysis
Cells were washed with cold PBS and lysates were prepared by homogenization of cells in cells lysis buffer (Sigma) and supplemented with protease and phosphatase inhibitors (Sigma). The protein concentrations were determined by using a BCA Protein Assay Reagent Kit (Thermo Scientific). Lysates were boiled in Laemmli buffer for 5 minutes. An appropriate amount of protein sample was separated by SDS-PAGE and transferred to nitrocellulose membrane. After blocking with 5% nonfat milk, the membranes were incubated overnight at 4°C in 5% BSA with the respective primary antibodies: PTEN, 1:250 (#9188, Cell Signaling) and β-Tubulin 1:5000 (#SC246854, Invitrogen). The corresponding horseradish peroxidase-linked secondary antibodies (1:5000) were obtained from Jackson Immuno Research. Membranes were developed by Pierce ECL Western Chemiluminescent Substrate from Thermo Scientific. Protein loading was normalized to endogenous β-Tubulin levels, and quantitated with ImageJ (Schneider et al., 2012); p values estimated using Student’s t test.
RNA-Seq preparation
Cells were transfected in 96-well plate, with 4 wells pooled to produce each sequenced sample. Each well was seeded with 10,000 cells. Total RNA samples were extracted using RNeasy Plus Micro kit (catalog: 74034) from QIAGEN INC. Total RNA concentrations were verified by NANODROP 2000C (Thermo Scientific). Each sample that was submitted for sequencing included 20 μl RNA solution at 10ng/μl. Samples were submitted for library preparation and sequencing at UH Seq-N-Edit Core, University of Houston, Science & Engineering Research Center, 3517 Cullen Blvd, Room 4008, Houston, Texas 77204-5061. Samples were prepared using Takara SMARTer Stranded Total RNA-Seq Kit v2 - Pico Input Mammalian (Pico v2) Library Prep Kit and sequenced on an Illumina NextSeq500 to produce over 20M 75bp pair-end reads per sample.
RNA-Seq analysis
RNA-Seq reads were aligned using STAR v2.3.0e (Dobin et al., 2013) to an index of hg19 that included GENCODE v16 gene annotation (http://www.gencodegenes.org/archive_stats.html). Alignment files were processed using Picard tools v1.54 (http://picard.sourceforge.net/), and the final BAM files indexed using SAMtools index v0.1.11.(Li et al., 2009) Transcript quantification was performed using Cufflinks v2.02 running in quantification mode against the GENCODE v16.gtf file (Trapnell et al., 2012). FPKM (Fragments Per Kilobase of Exon Per Million Fragments Mapped) values were used for relative abundance estimation. The uniquely mapped reads rate was ∼75% per sample.
Our analysis focused on post-transcriptional decoy targets because these formed the bulk of the predicted OIP5-AS1 targets in BRCA and UCEC: 67% and 97%, respectively (Figure S1A). While the majority of protein-coding genes did not respond to OIP5-AS1 (Figure S1B), gene set enrichment analysis (Subramanian et al., 2007) showed significant enrichment of predicted targets among genes that were downregulated following siOIP5-AS1 transfections in both MDA-MB-231 (Figure S1C) and ECC-1 (Figure S1D); here, we compared fold changes of all expressed post-transcriptional decoy target genes versus all expressed genes. The majority of the predicted and expressed targets in MDA-MB-231 and ECC-1—including FOXA1, GATA3, PTEN, and ZEB1 transcripts—were dysregulated by at least 50% (p < 4E-32 by U test when compared to non-targets) and 60% (p < 4E-48 by U test), respectively, following siOIP5-AS1 transfection; see Table S16 for predicted-target fold-change data.
Method Details
Data collection
LongHorn and the analysis described in this manuscript relied on multiple types of data: 5,667 TCGA tumor and adjacent normal profiles in 14 tumor types, and specifically, RNA-Seq, miRNA-seq and SNP Arrays from each sample; 1,293 RNA-Seq samples from METABRIC; tumor suppressor and oncogene (cancer gene) predictions from multiple sources; sequence data for regulatory regions including proximal promoters and 3′ UTRs; previously validated TF and miRNA binding sites; large-scale binding assays including 751 ChIP-Seq for 108 TFs and 268 eCLIP data for 96 RBPs from ENCODE; 1,634 binding motifs for 642 transcription factors; and the identification of phastCons46way cross-species conserved regions. These, including sources, are given below.
Data collection
LongHorn and the analysis described in Chiu et al. relied on multiple types of data: TCGA tumor profiles, and specifically, RNA-Seq, miRNA-seq and SNP Arrays from each sample; tumor suppressor and oncogene (cancer gene) predictions from multiple sources; sequence data for regulatory regions; previously validated binding sites; large-scale binding assays; transcription factor binding motifs; and the identification of cross-species conserved regions. These, including sources, are described below.
TCGA tumor profiles
We used RNA- and miRNA-expression and copy number profiles of TCGA tumors from 14 types. RNA, including both mRNA and lncRNA, and miRNA expression was profiled using RNA-Seq and miRNA-Seq, while copy numbers were estimated using SNP Arrays. All included tumor was profiled by each of these assays. The number of profiled tumors is given below; we considered tumor types with at least 190 samples that were profiled by the three assays. This requirement was necessary to ensure sufficient power for conditional multi-variate analyses (Chiu et al., 2015). When available, tumor subtypes, including UCEC subtypes, were obtained from TCGA phenotype descriptions; BRCA subtypes for TCGA and METABRIC were based on PAM50 inference.
-
•
Bladder urothelial carcinoma (BLCA): 251 tumors
-
•
Breast invasive carcinoma (BRCA): 835 tumors
-
•
Cervical squamous cell carcinoma and endocervical adenocarcinoma (CESC): 192 tumors
-
•
Head and neck squamous cell carcinoma (HNSC): 423 tumors
-
•
Kidney renal clear cell carcinoma (KIRC): 437 tumors
-
•
Kidney renal papillary cell carcinoma (KIRP): 197 tumors
-
•
Brain lower grade glioma (LGG): 498 tumors
-
•
Liver hepatocellular carcinoma (LIHC): 196 tumors
-
•
Lung adenocarcinoma (LUAD): 488 tumors
-
•
Ovarian serous cystadenocarcinoma (OV): 261 tumors
-
•
Prostate adenocarcinoma (PRAD): 371 tumors
-
•
Skin cutaneous melanoma (SKCM): 225 tumors
-
•
Thyroid carcinoma (THCA): 502 tumors
-
•
Uterine corpus endometrial carcinoma (UCEC): 309 tumors
In addition, when estimating gene-expression dysregulation, we compared the expression of a gene in tumor samples to tumor-adjacent samples. In total, 9 of the tumor types above had ten or more tumor-adjacent samples that were profiled by RNA-Seq. Coding genes and lncRNAs were identified as “expressed” if they had a nonzero median absolute deviation (MAD) score. The number of profiled tumor adjacent samples for these 9 tumor types is given below.
-
•
Bladder Urothelial Carcinoma (BLCA): 19 tumor adjacent samples
-
•
Breast invasive carcinoma (BRCA): 105 tumor adjacent samples
-
•
Head and neck squamous cell carcinoma (HNSC): 42 tumor adjacent samples
-
•
Kidney renal clear cell carcinoma (KIRC): 67 tumor adjacent samples
-
•
Kidney renal papillary cell carcinoma (KIRP): 30 tumor adjacent samples
-
•
Liver hepatocellular carcinoma (LIHC): 50 tumor adjacent samples
-
•
Lung adenocarcinoma (LUAD): 58 tumor adjacent samples
-
•
Prostate adenocarcinoma (PRAD): 52 tumor adjacent samples
-
•
Thyroid carcinoma (THCA): 59 tumor adjacent samples
RNA-Seq
RNAs were profiled using Illumina Genome Analyzer or HiSeq. Level 3 data, to estimate expression of 17,792 mRNAs, was download from TCGA Data Portal on 05/12/2015. Expression was estimated as log2(normalized count+1), where multiple transcripts are summed to produce gene-level expression estimates. We only used mRNAs with a single Entrez ID, and where all associated RefSeq had one and only one predicted location in chr1-22, chrX, or chrY. Expression profiles for a total of 12,677 lncRNAs were estimated using TANRIC. 1.0.6 based on Gencode Release 19 (Li et al., 2015); these were represented as RPKM (Reads Per Kilobase per Million mapped reads). Note that these lncRNAs do not overlap other lncRNAs or mRNAs included in the RNA-Seq data.
miRNA-seq
A total of 2,588 miRNAs were profiled using Illumina HiSeq 2000. Level 3 expression estimates by Firehose, log2-transformed reads per million miRNA mapped (https://confluence.broadinstitute.org/display/GDAC/Dashboard-Stddata), used release 2015_04_02 (std data Run), utilizing miRBase R21 as of June 2014. To facilitate large-scale computational analysis we replaced all “NA” values were replaced by “0”s.
Copy number estimates
Copy number variations (CNVs) were estimated for both mRNAs and lncRNAs based on Affymetrix Genome-Wide Human SNP Array 6.0 using Birdsuite (Korn et al., 2008), with Level 3 segmentation data downloaded from TCGA Data Portal on 05/12/2015. The values are represented as a log2 ratio between tumor and normal samples.
In addition to TCGA, 1293 breast patient samples from METABRIC (Curtis et al., 2012) were included for subtype analysis of OIP5-AS targets (Figure 5E). METABRIC profiled 18,674 genes using Illumina HumanHT-12 v3.0 Gene Expression BeadChip. Expression values were log2-transformed and normalized.
Cancer-gene curation
Cancer genes were collected by taking the union of cancer genes identified by multiple sources, including:
-
•
The Sanger Cancer Gene Census (http://cancer.sanger.ac.uk/census): 480 genes
-
•
The Memorial Sloan Kettering Cancer Center (MSKCC) CancerGenes Database (Higgins et al., 2007)
-
•
(http://cbio.mskcc.org/CancerGenes/): 937 genes based on Cancer Cell Map Pathway and Cancer Review genes sets.
-
•
Dr. Frederic M Waldman lab (http://waldman.ucsf.edu/GENES/completechroms.html): 413 genes
-
•
The Tumor-Associated Gene Database (TAG; http://www.binfo.ncku.edu.tw/TAG/): 674 genes
-
•
Table S2 of Chen et al. (Chen et al., 2008): 766 genes
-
•
Table S2 of Lawrence et al. (Lawrence et al., 2014): 260 genes
-
•
Table S1 of Rahman et al. (Rahman, 2014): 114 genes
-
•
Network of Cancer Genes 5.0 (An et al., 2016) (http://ncg.kcl.ac.uk/): 1,571 genes
-
•
Dr. Frederic Bushman’s Lab (http://www.bushmanlab.org/links/genelists): 2,125 genes
-
•
Table S2 of Tamborero et al. (Tamborero et al., 2013): 435 genes
In total, there are 3,233 predicted cancer genes from these sources were profiled in TCGA RNA-Seq V2. They are listed in the Table S9.
Subtype prediction for breast tumor samples
We relied on published TCGA subtypes, based on the PAM50 gene set, to identify subtypes for 825 TCGA breast tumor samples, including LumA, LumB, Her2, and Basal subtypes. In order to estimate subtypes in METABRIC and other TCGA BRCA data, we trained an SVM classifier using LIBSVM v3.20 in 10-fold cross-validation scheme for each subtype. We used RBF (radial basis function) kernel and searched for its parameters, i.e., cost and gamma, between 2ˆ-10 and 2ˆ10 with a geometric increment of 2. The parameter set with the best accuracy on TCGA samples was selected for building the final classifiers. Each TCGA BRCA and METABRIC sample was assigned probability scores from all 4 binary classifiers. The subtype call is assigned to the one with the highest probability score. We used breast cancer sample classification to estimate the significance level of dysregulation between basal and non-basal samples. In total, our process suggested the following classification for TCGA and METABRIC. Table S14 includes all final subtype calls.
TCGA: 553 LumA, 203 LumB, 84 HER2-enriched, and 174 Basal-like
METABRIC: 833 LumA, 204 LumB, 51 HER2-enriched, and 205 Basal-like
Transcriptional and post-transcriptional canonical networks
LongHorn predicts lncRNA interactions using statistical evidence from transcriptional and post-transcriptional networks with TF-, RBP-, and miRNA-target interactions. These were reverse engineered using collected data from high-throughput assays and curated interactions from multiple databases and using previously published tools. Analyses of ChIP-seq data and using position weight matrices identified putative binding sites for each TF (Lefebvre et al., 2010, Zhou et al., 2010, Smith et al., 2006, Bansal et al., 2015). miRNA networks were reversed engineered using Cupid (Chiu et al., 2015), and RBP-networks based on ENCODE eCLIP datasets (Li et al., 2015). Details below.
Regulatory regions
Proximal Promoters and 3′ UTR were used when predicting transcription factor (TF), RNA-binding protein (RBP), and miRNA binding sites. Binding site evidence across multiple promoters and 3′ UTRs associated with the same gene was aggregated to produce gene-level binding evidence. We used 2kbps promoters: [-1000, 1000] relative to the transcription start sites.
When predicting TF binding sites in proximal promoters using position-weight matrices, motif scores were compared to 5′-flanking regions of length 2kbps of their cognate proximal promoters; the methodology is detailed at “TF-target prediction” section. When scoring TF binding sites in lncRNAs, comparisons were made relative to di-nucleotide preserved shuffled promoters. Binding sites for RBPs and miRNAs were identified in 3′ UTRs, as evidence suggest that sites that are more likely to alter RNA stability and degradation are located in these regions (Hausser et al., 2013). Please see sections “TF-target prediction” and “RBP-target prediction” for details. Both 3′ UTRs and proximal promoters were extracted based on hg19 RefSeq annotation. Note that there are 22388 proximal promoters and 38,669 3′ UTRs corresponding to 17,792 PCGs. Their 3′ UTR lengths were between 1 to 25,393bps with a median length of 999bps. All these regulatory regions are included in Tables S1-3.
lncRNAs counts
We studied 12,677 lncRNA candidate genes with 22,339 transcripts. Their length ranged between 48 and 37,027bps with a median length of 601bps. These lncRNA transcripts could be classified into the following groups, based on their location relative to coding genes: 11,099—nearly a half—were intergenic (lincRNAs), 13 overlapped 3′ UTRs, 8,296 were antisense to a coding gene, 779 were intronic, 286 overlapped coding genes and 1,866 were the product of other post-transcriptional processing. This classification is provided by GENCODE Release 19.
Verified TF-target interactions
Focusing on TFs and targets with profiles in TCGA RNASeqV2 data, we collected a total of 6,566 non-redundant and experimentally-verified human TF-target interactions for 557 TFs and 2528 targets from 3 sources; of these 388 have characterized motifs. Interactions were collected from the following sources:
-
•
HTRIdb (Bovolenta et al., 2012) build dating 03/20/2014: 2209 interactions involving 277 TFs and 1381 targets that were verified by small and mid-scale techniques. These excluded interactions detected by ChIP-chip or ChIP-seq due to their lower confidence.
-
•
Table 3 of Whitfield et al. (Wang et al., 2012, Whitfield et al., 2012) which included 63 interactions between 7 TFs and 54 target genes.
-
•
TRANSFAC Professional,(Matys et al., 2006) from February 2013, 4,888 interactions between 501 TFs and 1669 targets. We excluded interactions involving more than one TF per target to avoid non-specific binding by co-factors.
All these interactions are included in the Table S4.
Verified miRNA-target interactions
miRNA-target interactions were compiled from miRecords, TarBase, TRANSFAC, and miRTarBase (v4.5 in 11/01/2013). Only human miRNA-target gene interactions with strong experimental evidence, i.e., reporter assay or western blot, were selected. In addition, we included validated targets from the Table S2 of Grosswendt et al. (Grosswendt et al., 2014), which included interactions between 359 miRNAs and 2463 genes, where both were included in our TCGA profiles. In total, these 4,696 interactions were used to train classifiers and predict miRNA-target interactions genome-wide. All these interactions are included in Table S4.
Predicted interactions from ENCODE data
We used ENCODE (ENCODE Project Consortium, 2012) data to predict TF and RBP targets based on ChIP-Seq and eCLIP, including 108 TFs that were profiled in 37 cell lines, with the majority of assays performed in replicates. ChIP-seq data were downloaded from the UCSC genome browser, using hg19 annotation. Included eCLIP data profiled targets for 96 RBPs in 2 cell lines (HepG2 and K562), with each assay performed in duplicates. Transcription factor binding sites in proximal promoters and RBP sites in 3′ UTRs were selected as sequence-based targets and used in the subsequent expression-based analysis.
Transcription factor binding motifs
In total, we collected 1634 position weight matrices (PWMs) for 642 human TFs with expression in TCGA RNASeqV2 from 5 sources. To avoid matrix entries of value 0, a pseudo-count 1 was added to each entry before calculating the relative occurrence frequencies (%) of nucleotides at each position. We used this frequency table to scan TF binding sites from the proximal promoters and lncRNA transcript sequences. Sources include the following:
-
•
JASPAR (Sandelin et al., 2004) version: 5.0_ALPHA: 104 PWMs for 100 TFs.
-
•
SwissRegulon (Pachkov et al., 2007) downloaded on 03/18/2014: 353 PWMs for 340 TFs.
-
•
HumanTF (Jolma et al., 2013), downloaded from Table S3 in their paper: 661 PWMs for 365 TFs. Only higher-confidence motifs were included (motifs indicated in orange or green were not included).
-
•
HOCOMOCO (Kulakovskiy et al., 2013) version: 9.0: 430 PWMs for 402 TFs. Only motifs of quality A, B, C, or D were extracted.
-
•
Factorbook (Wang et al., 2012), downloaded from Table S2 in their paper: 86 PWMs for 76 TFs. These excluded unannotated motifs in their publication.
PWMs were used to predict TFBS in proximal promoters, 5′-flanking regions, and lncRNA transcripts.
Cross-species conservation
Cross-species conservation estimates by phastCons (Siepel et al., 2005) was used for predicting miRNA binding sites. Both complete hg19 human genome and genome-wide phastCons46way conservation scores for vertebrate were downloaded from UCSC Genome Browser annotation. All scores were normalized between 0 and 1.
Transcriptional and post-transcriptional networks
LongHorn predicts lncRNA interactions using statistical evidence from transcriptional and post-transcriptional networks. These are described below. We first describe the methodology for estimating Spearman’s correlation and distance correlation, which are used to reverse engineer these networks.
Spearman’s correlation and distance correlation (dCor) estimates. Spearman’s correlation was used to estimate the directionality of regulatory interactions: e.g., TFs that are anticorrelated with their targets were predicted to inhibit their expression, while positive correlation indicates activation. Distance correlation (dCor) between a regulator, including TF, RBP, miRNA, and lncRNA, and a target was estimated using their expression profiles, in each tumor type independently. We used permutation testing to estimate dCor significance by comparing it to dCor estimates computed after shuffling the regulator’s expression. In some instances, comparisons using 100k randomized computation could achieve up to a p < 1E-5 resolution, and in other cases, dCor values from randomized tests were then used to fit parameters for a generalized extreme value (GEV) distribution using the MATLAB gevfit routine to achieve a p value lower than 1E-5. This allows a nonparametric p value calculation from the cumulative density of the resulting GEV distribution. Distance correlation was computed as described by Székely et al. (Székely et al., 2007).
TF-target prediction
TF-target predictions were based on combining evidence from verified interactions, ChIP-Seq assays, sequence-based motif analysis and co-expression networks (Lefebvre et al., 2010, Zhou et al., 2010, Margolin et al., 2009, Smith et al., 2006). Predictions are given in Table S5. We used ENCODE ChIP-Seq datasets to select candidate TF-target interactions based on significant peaks (Q value < 1E-10) in proximal promoters of coding genes. In addition, 1634 PWMs for 642 TFs were used to infer binding sites on proximal promoters and their corresponding 5′-flanking regions. Only significant binding sites per PWM (p < 1E-5, when compared to control flanking regions) were included. Here, for every PWM, every potential binding site in promoter-flanking regions was scored using CREAD tools (Smith et al., 2007) to establish a null distribution of PWM scores; scores in promoters were then assessed with p values according to these distributions. Because a TF could have multiple binding sites—with different binding strength on multiple promoters for the same gene—we integrated binding strength and relative position to TSSs of all sites for the same TF-promoter pair into a single weighted score using the following formula to estimate the binding likelihood for this TF-promoter pair. Here, is the distance between the TSS and the binding site (with the mid-point of the binding site used to compute distance), is the length of promoter, i.e., 2000 bps, is the total number of binding sites associated with this TF-promoter pair, is the minimal attainable p value genome-wide, and is the binding significance for site (Sikora-Wohlfeld et al., 2013).
If an expressed TF-target pair of was either (1) experimentally verified, (2) had significant (q < 1E-10) evidence for binding on the promoter of any transcript from at least one ENCODE ChIP-Seq data, or (3) had a nonzero score, as predicted by at least one PWM on either forward or reverse strand of the promoter of any transcript, we tested its significance of correlation using dCor (described in the following section) to reverse-engineer tumor type-specific TF-target interactomes. Spearman’s correlation was also calculated to determine the sign of the correlation, which indicates whether the TF is activating or repressing the target. TF-target pairs with evidence for sequence binding and significant expression measured by dCor (p < 1E-3) were included in the transcriptional interactome (Zhou et al., 2010).
RBP-target prediction
RBP-binding sites on 3′-UTRs of protein-coding genes and lncRNA transcripts were inferred based on ENCODE eCLIP datasets exclusively, and using a q < 1E-10 cutoff. If multiple peaks are mapped to the same 3′ UTR/lncRNA transcript, the best q value is assigned to determine the strength of association. Similar to TF-target prediction, we required p < 1E-3 for the significance of dCor between RBP and target. We predicted RBP-targets via integrating both sequence binding and co-expression evidence. All predicted interactions are included in the Table S6.
miRNA-target prediction
All miRNA targets—in 3′ UTRs and lncRNAs—were inferred using Cupid (step 2 and without computing step 3) with standard parameters (Chiu et al., 2015). All predicted interactions are included in the Table S7. Note that both RBP-targets and miRNA-targets form the post-transcriptional network.
Multiple testing corrections
To address multiple testing, ChIP-Seq and eCLIP prediction cut-offs were set to FDR < 0.01, or p < 1E-10, following ENCODE recommendations. Predictions of TF binding sites using PWMs—comparing sites in proximal promoters to those in 5′-flanking regions—used an FDR < 0.01 cutoff; this cutoff accounted for the number of PWMs and the number of binding sites tested. Expression predictions using regression analysis were selected using FDR < 0.01 or a p < 1E-8 cutoff, which accounts for the number of lncRNAs tested times the number of targets.
LongHorn
LongHorn predicts modulation of TFs, RBPs, and miRNAs by lncRNAs. We modeled lncRNAs as Decoys, Co-factors, Guides, and Switches (Figure 1A). Decoys bind regulators and inhibit their activity, co-factors alter the regulation of TFs by binding TFs or/and their DNA targets, guides facilitate regulation by TFs, and switches alter the activity of effectors on multiple targets. lncRNA decoys that inhibit TF activity include Gas5 (Kino et al., 2010), while NORAD (Lee et al., 2016) and linc-MD1 (Cesana et al., 2011) inhibit RBP and miRNA activity, respectively. lncRNAs that act as co-factors to alter regulation by TFs include GASL1 (Gasri-Plotnitsky et al., 2017) and PANDA (Hung et al., 2011), and lncRNAs that are known to guide TFs to promoters include HOTAIR (Gupta et al., 2010, Kim et al., 2013), SChLAP1 (Prensner et al., 2013), and PTCSC2 (Wang et al., 2017). Finally, while some lncRNAs may have one or few targets, multiple lncRNAs, including PANDA, linc-MD1, NORAD, and SChLAP1 have been shown to alter the activity of effectors by guiding them to or inhibiting their regulation across multiple targets; these are modeled as Switches by LongHorn. LongHorn predictions were based on evidence for RNA-DNA, RNA-RNA, and RNA-protein binding sites, as well as expression-based evidence for modulation of canonical (TF-, RBP-, or miRNA-target) interactions.
Binding site evidence for TF binding DNA or RNAs was based on ENCODE ChIP-Seq assays and analyses using curated TF binding-site motifs from multiple sources including TRANSFAC (Matys et al., 2006) and HTRIdb (Bovolenta et al., 2012); evidence for RBP binding sites on RNAs from eCLIP assays; evidence for miRNA binding sites in RNAs using Cupid; and lncRNAs binding DNA using Triplexator (Buske et al., 2012). We note that evidence for the predictive ability of Triplexator is given in Figure 3A.
Evidence for modulation or conditional regulation, as depicted in Figures 1B-D, was estimated using delta distance correlation (delta dCor) (Bowman and Azzalini, 1997). Briefly, given X—a candidate lncRNA modulator of a canonical effector Y and its target Z—samples were partitioned into quartiles according to the expression profile of X; and distance correlation estimates between Y and Z were computed in each quartile as described by Székely et al. (Székely et al., 2007). The delta distance correlation was the difference between estimated distance correlations in the bottom and top quartiles.
More specifically, we asked if the dCor values between Y and Z are significantly different across the two sets of samples:
Where Ybottom and Zbottom describe the expression profiles of Y and Z in 25% of the samples with the lowest expression of X (bottom), while Ytop and Ztop are the expression profiles of Y and Z in top. The ΔdCor (Bottom 25% - Top 25%) can be positive or negative, indicating modulation that amplifies or inhibits effector activity, respectively. As dCor is always within 0 and 1, the ΔdCor will be within −1 and 1.
We used permutation testing to estimate nonparametric p values for ΔdCor:
-
(1)
For each effector type, classify all effector-target pairs into 100 bins according to their dCor values.
-
(2)
For each bin, randomly selected 100K pairs and shuffle both effector and target expressions. If the number of pairs in a bin is smaller than 100K, each pair can be selected multiple times. Calculate the randomized ΔdCor.
-
(3)
The resulting 100K ΔdCor values form the null distribution for each bin
-
(4)
Each null distribution is fitted to a logistic distribution which is symmetric. The parameters, i.e., mu and sigma, of a logistic distribution were estimated by a MATLAB routine fitdist (Bowman and Azzalini, 1997). The two-tailed p values are estimated analytically based on the fitted distribution.
To avoid circularity, for each triplet, we required the lncRNA have nonsignificant (p > 0.1) dCor with the effector (independence constraint) (Wang et al., 2009). In addition, the expression fold change between the top and the bottom 25% of samples in respect to lncRNA abundance were required to be at least 2-fold (range constraint) to ensure that there is sufficient variability to test the lncRNA as a modulator. Note that X, Y, and Z each were required to be expressed in the dataset (i.e., nonzero MAD score).
The four models for lncRNA regulation were used to identify Decoy, Co-factor, Guide, and Switch candidates. Decoy predictions required evidence for modulation, lncRNA-effector binding, and effector-target binding; co-factor predictions required evidence for modulation, lncRNA-promoter, and TF-promoter binding; guide predictions required evidence for modulation, TF-lncRNA, and lncRNA-promoter binding; and finally, switch predictions required evidence for modulation of TF or RBP activity across a multiplicity of targets.
lncRNA-promoter binding
We predicted lncRNA-promoter binding using Triplexator (Buske et al., 2012), requiring that RNA-DNA triplex sites are at least 12bp long. Triplexator was used to predict triplex-forming oligonucleotides (TFO) in single-stranded lncRNA sequences and the triplex target sites (TTS) on both strands of double-stranded promoter sequences that are able to accommodate a third strand according to the canonical triplex formation rules. In total, 21,432/22,388 (95.7%) of promoter sequences had at least one TTS and 15,024/22,339 (67.3%) lncRNA transcripts had at least one TFO. On average, each promoter has 36.4 TTSs and each lncRNA transcript has 15.5 TFOs; note that two consecutive TTSs or TFOs will be counted twice, and that lncRNA transcriptional regulation prediction via triplex formation is relatively more selective than their binding substrates (67.3% for lncRNAs versus 95.7% for promoters). Promoter binding was taken as evidence for lncRNA-promoter interactions, but this purely sequence-based evidence was always integrated with expression-based evidence, i.e., ΔdCor, when making lncRNA-target predictions. Note that the location of lncBSs relative to the TSS does not influence lncBS prediction.
Decoy lncRNAs
Any lncRNAs to inhibit effector regulation and have evidence for lncRNA-effector interaction are referred to as decoys. Decoys can inhibit transcriptional regulation by TFs, or post-transcription regulation by miRNAs or RBPs. Below we describe the methodology for predicting decoys based on a 1-1-1 model: one effector, one target, and one lncRNA; this 1-1-1 model is later generalized to the many-1-1 or 1-many-1 models that are often required for predicting lncRNA interactions. In all cases, we expect to have positive ΔdCor for the target, effector, and lncRNA, and required that the lncRNA satisfies both independence and range constraints.
TF decoys
TF decoys required evidence for lncRNA-TF binding, evidence for TF-promoter targeting, and positive ΔdCor. Evidence for TF-lncRNA binding was compiled based on binding sites predicted using PWMs, analogously to predicting TF-promoter binding. We search for binding sites on lncRNA transcript sequences and compared scores to top scores in permuted sequences while maintaining di-nucleotide frequencies by uShuffle (Jiang et al., 2008, Weirauch et al., 2013), accepting binding sites with p < 1E-5 relative to permuted transcripts and a nonzero score. Each lncRNA was shuffled one and only one time. Evidence for TF-target binding was taken from transcriptional networks, and ΔdCor was computed as described above. Then, for each triplet selected, we compiled a list of lncRNA-target pairs and the common TF-program associated with each pair. For each pair, we then integrated significant ΔdCor (p < 0.05) using Fisher’s method. If a lncRNA-target pair had a significant adjusted integrated p value with p < 0.01, this lncRNA was predicted to be a TF decoy for this target.
RBP decoys
Similarly, these required lines of evidence for lncRNA-RBP binding, evidence for RBP-mRNA targeting, and positive ΔdCor. Evidence for lncRNA-RBP and for RBP-mRNA targeting was derived from eCLIP data, as previously described. Here we used Cupid Step 3, adapted to include both miRNA and RBP, as an additional requirement for predicting miRNA and RBP lncRNA decoys. Note that Cupid Step 3 uses weighted Brown’s method to generalize ΔdCor for triplets over multiple RBP, computing p values for modulation of multiple RBPs that target a mRNA by any given lncRNA decoy candidate.
miRNA decoys
Similarly, these required lines of evidence for lncRNA-miRNA binding, evidence for miRNA-3′ UTR targeting, and positive ΔdCor. Evidence for lncRNA-miRNA and mRNA-miRNA binding was derived from Cupid, as described above. Here we used Cupid Step 3 as an additional requirement for predicting miRNA lncRNA decoys. As noted for RBPs, Cupid Step 3 uses weighted Brown’s method to generalize ΔdCor for triplets over multiple miRNAs, computing p values for modulation of multiple miRNAs that target a mRNA by any given lncRNA decoy candidate.
Co-factor lncRNAs
Co-factor lncRNAs can alter the activity of a TF on their common target. When predicting co-factor lncRNAs, we required evidence for lncRNA-promoter (Triplexator) and TF-promoter (transcriptional regulation networks) binding based on PWMs, as well as significant ΔdCor. A significant ΔdCor can be either positive or negative depending on the role of TF, i.e., activator or inhibitor. For each lncRNA-target pair, we then integrated significant ΔdCor (p < 0.05) using Fisher’s method across common TF program. If a lncRNA-target pair had a significant adjusted integrated p value with p < 0.01, this lncRNA was predicted to be a TF co-factor for this target.
Guide lncRNAs. Guide lncRNA can help deliver TFs to lncRNA targets. They are required to bind promoters and TFs but not alter TF expression. Consequently, when predicting guide lncRNAs, we required binding-site evidence for lncRNA targeting the TF—predicted PWM sites on the lncRNA as previously described; Triplexator-derived evidence for lncRNA-promoter binding; co-expression evidence for TF targeting—p value associated with the dCor(TF, target) set to p < 1E-3. The ΔdCor is always negative for guide lncRNA.
For each lncRNA-target pair, we then integrated significant ΔdCor (p < 0.05) using Fisher’s method across common TF program. If a lncRNA-target pair had a significant adjusted integrated p value with p < 0.01, this lncRNA was predicted to be a TF guide for this target.
Switch lncRNAs
Switch lncRNAs were predicted using a uniformity test over ΔdCor p values to identify lncRNAs that alter TF or RBP activity across a multiplicity of targets. Here, for each effector, we sought to identify lncRNAs so that inferred modulation by these lncRNAs is more significant than by other lncRNAs when accounting for variability across targets. To accomplish this, we constructed a ΔdCor rank matrix for each effector candidate, which included the rank of ΔdCor p values for each effector’s target across all lncRNAs which satisfy both independence and range constraints. Ranks for a given lncRNA-target pair were computed by comparing this ΔdCor p value to ΔdCor p values for this target against all other lncRNAs. One-sample Kolmogorov–Smirnov test was used to determine whether the rank vector across all effector’s targets associated with this lncRNA was different from the uniform distribution. If a lncRNA-effector pair had a significant adjusted one-tailed p value with p < 0.01, this lncRNA was predicted to be a Switch for this effector. In addition, we note that as a consequence of our predictions methodology, Switch lncRNAs had consistently better ΔdCor p values than other lncRNAs for the same effector. All the lncRNA-target interactions are included in Table S8.
Indirect regulation by lncRNAs
We identified lncRNA modulation of TF and RBP expression as an opportunity to further improve lncRNA-target prediction. Namely, when a lncRNA was predicted to modulate an effector that regulates a TF or an RBP, we tested whether its expression is predictive of dysregulation of the targets of this TF or RBP as previously described for Cupid (Chiu et al., 2015). Simply put, the idea is the regulatory effect will propagate to effector’s targets and even show a stronger signal. We compiled TF-targets and RBP-targets from transcriptional and post-transcriptional networks described before. For TFs or RBPs with more than 500 targets, only the top 500 targets, in terms of dCor were included for this analysis. Indirect lncRNA regulation of TF or RBP targets required an adjusted p value with p < 0.01. Table S11 includes all predicted lncRNA-target pairs with evidence for indirect regulation. In Figure 3H we compared the number of shared tumor types for interactions with evidence for indirect regulation, and all tested interactions. The result suggested dramatic enrichment for pan-cancer interactions with evidence for indirect regulation. P values were calculated using chi-square test, with a p value lower than machine recognition (p < 1E-16).
Multiple testing corrections
Binding site predictions with Triplexator were identified at p < 1E-10 to account for the number of lncRNA-target combinations tested. In addition, we verified that Triplexator predictions are significantly enriched in promoters by shuffling promoter sequences 100,000 times while maintaining dinucleotide frequencies, and verifying that all predicted lncRNA binding sites were more abundant in promoters that in shuffled sequences at a 100x enrichment. We used permutation testing to estimate nonparametric p values for ΔdCor, these were based on shuffling effector and target expression profiles and repeating the process. To avoid circularity when evaluating each triplet, we required the lncRNA have non-significant (p > 0.1) dCor with the effector (independence constraint) (Wang et al., 2009). In addition, the expression fold-change between the top and the bottom 25% of samples in respect to lncRNA abundance were required to be at least 2-fold (range constraint) to ensure that there is sufficient variability to test the lncRNA as a modulator. When integrating p values across multiple effectors—to predict lncRNA regulation of a target—p value cutoffs were corrected for the number of tested triplets using Bonferroni correction.
lncRNA predictive ability
We used stepwise ridge regression with 10-fold cross-validation to test the predictive ability of CNV and regulator-lncRNA expression profiles over target expression. Briefly, to test whether lncRNA expression and CNV profiles were predictive of the expression variability of gene X, we tested whether its lncRNA-regulator profiles can account for X’s expression variability after accounting for its CNV profiles and the expression profiles of its canonical regulators. These tests compared the residual sum of squares (RSSs) of regression models using features that include X’s CNV and canonical-regulator expression profiles based on cross-validation testing errors, and RSSs based on these features in addition to lncRNA expression or CNV profiles. Candidates with p < 0.01 by F test were included. Details are given below.
We used stepwise ridge regression with 10-fold cross-validation to test the predictive ability of CNV profiles as well as regulator expression profiles over target expression. Namely, ridge regression (Zou and Hastie, 2005, Tibshirani, 1996) using Glmnet for MATLAB was used to predict the expression of each lncRNA target from its CNV profiles and the expression of its inferred tumor-type-specific regulators, including TFs, RBPs, miRNAs, and lncRNAs. For each target, in each 10-fold cross-validation step, Glmnet constructs a regression model using training samples to fit an estimate for the target expression profile . The test-set residual sum of squares (RSS) are then compiled across the 10 testing sample sets by summing the square of differences between the target expression profile and the fitted estimate to prduce the total RSS. To evaluate the added predictive ability of lncRNA regulators, we used an F test for nested models to compare RSS with and without inferred regulator lncRNA expression or CNV profiles. Namely, for each target, we compiled the target expression profiles Y, it’s CNV profile YCNV, and the expression profiles of all of its predicted and verified TF, RBP, miRNA and, lncRNA regulators (TFy, RBPy, miRNAy and lncRNAy). We then trained regression functions using three sets of features to estimate Y using: (1)YCNV, TFyexp, RBPyexp, miRNAyexp, (2) YCNV, TFyexp, RBPyexp, miRNAyexp, lncRNAyexp, and (3) YCNV, TFyexp, RBPyexp, miRNAyexp, lncRNAycnv. RSS were computed for each set of features: RSS1, RSS2, and RSS3; and these were compared using an F test to produce a p value for the added predictive benefit of inferred lncRNA regulators: comparing RSS2 and RSS3 to RSS1, the number of added parameters for the latter two is equal to the number of predicted regulators. Note that the lncRNA-targets were taken from all models together, including decoy, co-factor, guide, and switch regulation; TF-targets had a dCor p < 1E-8 rather than 1E-3 to reduce false positive predictions; and RBP-targets and miRNA-targets were taken from Cupid Step3.
This F test produced a highly conservative evaluation of the predictive ability of lncRNAs. To ensure that we do not overestimate the number of targets with significant lncRNA predictive ability, we used a permutation test to estimate FDR. Here, lncRNA expression or CNV profiles were shuffled 100 times per target, and the process was repeated to compute FDR, comparing RSS of the true and shuffled profiles. We ensured each selected target had both p < 0.01 by F test, and FDR < 0.05 by permutation testing.
To estimate the proportion of target expression variability that is accounted for by YCNV, TFyexp, RBPyexp, miRNAyexp, lncRNAyexp and lncRNAycnv, we compared R2, as estimated by ridge regression to approximate Y using (1) YCNV alone, (2) YCNV, TFyexp, RBPyexp, and miRNAyexp, (3) YCNV, TFyexp, RBPyexp, miRNAyexp, and lncRNAyexp, and (4) YCNV, TFyexp, RBPyexp, miRNAyexp, and lncRNAycnv. Computing R2 for (1) produced an estimate for the variance accounted for by YCNV. The difference in R2 between (1) and (2) estimated the added variance accounted for by TFs, RBPs, and miRNAs, and the variance accounted for by lncRNA expression and CNVs was estimated by the difference between (3) and (2), and (4) and (2), respectively. Note that reduction in variance reported in Figures 2B and 2C pertained only for targets that were predicted significantly (p < 0.01) in 2A, focusing on targets predicted by lncRNAexp and lncRNAcnv, respectively.
Multiple testing corrections
Significance required FDR < 0.05 by permutation testing for each target.
lncRNA occupancy in proximal promoters (Figure 3A-C)
To compare the positional distribution of inferred transcription factor and lncRNA binding sites in proximal promoters, we binned promoters into 50-base fragments and counted the number of predicted binding sites in each bin. These were compared to lncRNA binding-site predictions in shuffled promoters with preserved di-nucleotide frequencies uShuffle (Jiang et al., 2008). The significance of the difference between sequence-based and LongHorn predictions at the core promoter was estimated by a Chi-square Test. To test whether core-promoter binding sites were more enriched in predicted co-factor interactions, we compared the probability that a candidate lncRNA-target interaction with no-, one-, and multiple-core-promoter binding sites were selected, to the probability that TF-target interactions with no-, one-, and multiple-core-promoter binding sites are selected. The significance of the difference between sequence-based and LongHorn predictions was estimated by a Chi-square Test, and error bars are derived from random predictions, which were generated in 10 replicates.
The significance of the difference between zero and non-zero binding sites in LongHorn predictions was estimated by comparing two distributions of -Log10 p values of dCor via a U-test. The dCor values and their significance levels for sequence-based predictions were aggregated from all 14 tumor types, so the same pair could have 14 dCor values in sequence-based predictions.
lncRNA occupancy in proximal promoters
To compare the positional distribution of inferred transcription factor and lncRNA binding sites in proximal promoters, we binned promoters into 50-base fragments and counted the number of predicted binding sites in each bin. These were compared to lncRNA binding-site predictions in shuffled promoters with preserved di-nucleotide frequencies uShuffle (Jiang et al., 2008). In total, each promoter was shuffled 10 times and lncRNA targets were predicted for each promoter, producing 10 random binding site estimates for each bin. These could then be compared with counts for inferred PWM-based transcription factor and lncRNA binding sites. LongHorn predictions in Figure 3 are the union of triplex binding sites associated with lncRNA-target triplex interactions, i.e., cofactor targets, selected in each tumor type. Note that LongHorn predictions are a subset of sequence-based prediction with expression-based evidence from LongHorn. The significance of the difference between sequence-based and LongHorn predictions at the core promoter was estimated by a Chi-square Test. Comparing with random predictions, sequence-based, LongHorn, and TFBS predictions have 1.2x, 1.6x, and 2.9x more binding sites within the core promoter. In our study, the core promoter is defined as the region up to 50 bps upstream of the TSS.
To test whether core-promoter binding sites were more enriched in predicted co-factor interactions, we compared the probability that a candidate lncRNA-target interaction with no-, one-, and multiple-core-promoter binding sites are selected, to the probability that TF-target interactions with no-, one-, and multiple-core-promoter binding sites are selected. We evaluated 4 prediction methods:
-
•
Random, predicts lncRNA binding sites in di-nucleotide preserved shuffled promoters. Random was run 10 times and the replicates were used to produce a null distribution.
-
•
Sequence-based, uses lncBSs that were predicted by Triplexator.
-
•
Pan14 prediction, uses the union of LongHorn co-factor predictions in 14 tumor types with Triplexator binding sites.
-
•
TFBS, uses PWM-based TFBS predictions as previously described.
For each method, we compared the frequency that predicted targets with lncBSs or TFBSs had core-promoter binding sites. We report on the fold change in this frequency relative to the frequency based on Random. The results reported in Figure 3B suggest an enrichment of lncRNA and TF targets with one or multiple binding sites in core promoters. The significance of the difference between sequence-based and LongHorn predictions was estimated by a Chi-square Test. The error bars of each method are from for 10 replicates in random prediction and they are error-propagated after normalization.
Similarly, using multiple significance cutoffs for dCor between lncRNAs and their co-factor targets, we compared the dCors between predictions with zero, one, or multiple core promoter lncBSs. The significance of the difference between zero and non-zero binding sites in LongHorn prediction was estimated by comparing two distributions of -Log10 p values of dCor via a U-test. The dCor values and their significance levels for sequence-based predictions were aggregated from all 14 tumor types, so the same pair could have 14 dCor values in sequence-based predictions.
Focusing on co-factor lncRNAs, where both TF effectors and lncRNAs have binding sites on the target promoter, and their ΔdCor was significant with p < 0.05, we compared the number of co-factor predictions with negative and positive ΔdCor; these model lncRNA activators and inhibitors, respectively. The same lncRNA was permitted to act as an inhibitor to this TF and its target in one tumor and an activator in another tumor.
Transcriptional and post-transcriptional lncRNAs (Figure 3D-E)
Predicted transcriptional and post-transcriptional specialist lncRNAs had more than 50 targets. Their target number was normalized to equate the total number of transcriptional and post-transcriptional interactions in order to eliminate our bias toward transcriptional interactions. In a tumor type, if a lncRNA has transcriptional and post-transcriptional targets, and in total there are transcriptional and post-transcriptional interactions. The log2 fold change was calculated as
For each lncRNA considered, we calculated the z-transformed average number of transcriptional and post-transcriptional targets across all 14 tumor types for which they have at least 10 targets. We selected lncRNAs with significant z-scores in either side; predictions are given in Table S10.
To identify lncRNAs with unusually many transcriptional or post-transcriptional targets, we compared the normalized number of predicted transcriptional and post-transcriptional targets per lncRNA in tandem: the number of transcriptional targets did not influence calculations about post-transcriptional targets for each lncRNA and vice versa. Only lncRNAs with targets in more than half the tumor types were included in this analysis. For each of these lncRNAs, we calculated the z-transformed average number of transcriptional and post-transcriptional targets across all 14 tumor types for which they have at least 10 targets. For example, assume a lncRNA has transcriptional and post-transcriptional targets averaged across LongHorn. The mean and standard deviation for the number of transcriptional and post-transcriptional targets across all 2801 lncRNAs are and , respectively. The z-scores of the number of transcriptional and post-transcriptional targets for this lncRNA is calculated as and , respectively. We selected lncRNAs have significant z-scores in either side. The one-tailed p value cutoff with FDR < 0.01 was calculated as 0.01/2801 = 3.57E-6, which is roughly equal to Z = +/−4.48946. We used this z-score cutoff to determine the regulatory role of each of these 2801 lncRNAs.
Indirect regulation by lncRNAs (Figure 3G-H)
We identified lncRNA modulation of TF and RBP expression to further improve lncRNA-target prediction. Namely, when a lncRNA was predicted to modulate an effector that regulates a TF or an RBP, we tested whether its expression is predictive of dysregulation of the targets of this TF or RBP as previously described for Cupid (Chiu et al., 2015). Table S11 includes all predicted lncRNA-target pairs with evidence for indirect regulation. In Figure 3H we compared the number of shared tumor types for interactions with evidence for indirect regulation, and all tested interactions.
Multiple testing corrections
Prediction of indirect lncRNA regulation of TF or RBP targets required an adjusted p < 0.01, as previously described (Chiu et al., 2015).
Gene set enrichment (Figure 4)
We sought to identify lncRNAs that target key pathways, on their own and synergistically with other lncRNAs. To simplify this task, we chose to focus on MsigDB’s fifty hallmark gene sets (Liberzon et al., 2015). These pathways were designed to highlight gene sets that were repeatedly included in thousands of MsigDB’s curated sets, and by limiting the scope of our study to these 50 gene sets we hoped to provide the most focused and biologically useful resource. Moreover, MsigDB’s grouping of gene sets based on eight process categories further allowed the identification of lncRNAs that were focused on few regulatory categories (Liberzon et al., 2015). We downloaded these gene sets from MSigDB in 09/04/2016 and the size of gene sets is ranging from 32 to 200; gene sets are included in Table S12.
When identifying lncRNAs whose targets are enriched in hallmark gene sets, we estimated gene set enrichment using Fisher’s Exact test between predicted lncRNA targets of each lncRNA and expressed gene set members in each of 14 tumor types using adjusted pFET < 0.01;(Chiu et al., 2015) each test was adjusted for the total number of lncRNAs, lncRNA targets, and gene set tested. In Figure 4A, the regulation strength of each gene set was represented as the integrated pFET by Stouffer’s Z-score method; white spaces meant that no significant lncRNA is selected.
To identify synergistic lncRNAs that target a gene set, we evaluated the number of overlapping lncRNA targets in this gene set using the Jaccard’s Index. Namely, given two lncRNAs a and b, with targets A and B, and gene set s with members S. We specified two indicator vectors of the same length la and lb, i.e., the total number of mRNAs profiled in TCGA RNASeq V2, where la indicates mRNAs in A and lb indicates mRNAs in B. We shuffled la and lb 100K times and each time calculated the Jaccard’s indices using the first s bits to form a nonparametric null distribution. The p value was the number of Jaccard’s index values higher than or equal to the observed one. We used p < 1E-5 as a cutoff to determine synergistic pairs of lncRNAs for a gene set in a tumor type. The predictions of synergistic lncRNAs in each tumor type is included in Table S13.
When producing Figure 4C, for each pathway-tumor type pair in Figure 4A, all possible lncRNA pairs that were selected for p value integration in Figure 4A were tested for Jaccard Index and its p value. If there are X out of Y pairs passed the cutoff p < 1E-5, we combined p values using Stouffer’s method, as described above.
Multiple testing corrections.
Gene set enrichment used an adjusted pFET < 0.01;(Chiu et al., 2015), correcting for the number of lncRNAs, targets, and gene sets tested. The total set of synergistic lncRNAs was identified based on a null distribution of Jaccard indices, which did not require multiple-testing correction.
Data and Software Availability
RNA-Seq data are available for download from The European Nucleotide Archive project PRJEB21799. Database: https://www.ebi.ac.uk/ena/data/view/PRJEB21799. An implementation of LongHorn is available from SourceForge at http://longhorntool.sourceforge.net.The accession number for the data analyzed in this paper is dbGaP: phs000677.v1.p1.
Acknowledgments
We acknowledge support from the European Union’s Horizon 2020 Research and Innovation Programme 668858; Taiwan Ministry of Science and Technology grant MOST-106-2311-B-182-005; and NIH grants U54 HG003273, U54 HG003067, U54 HG003079, U24 CA143799, U24 CA143835, U24 CA143840, U24 CA143843, U24 CA143845, U24 CA143848, U24 CA143858, U24 CA143866, U24 CA143867, U24 CA143882, U24 CA143883, U24 CA144025, and P30 CA016672. The results published here are, in part, based upon data generated by the TCGA pilot project established by the National Cancer Institute (NCI) and the National Human Genome Research Institute (NHGRI).
Author Contributions
Sample and Data Providers, A.L., A.K.G., C.A., D.A.L., J.R., N.P., R.R.B., R.Z., C.S.S., S.Oe., S.Or., M.L.A., J.M.d.A., H.H.A.C., J.B., and K.L. Clinical and Pathology, A.K.G., A.O., A.J.G., R.D.B., N.M.K., J.S.R., R.Z., A.K.S., A.J.L., J.N.W., G.B.M., and D.A.L. Data Analysis, H.-S.C., T.-W.C., B.Z., and P.S. Biochemical Assay Design, H.-S.C., S.S., V.P.S., A.K.S., P.H.G., and P.S. Biochemical Assay Implementation, S.S., E.P., S.L.P., Y.P., and S.S.C. Writing Team, H.-S.C. and P.S. Project Leadership, H.-S.C. and P.S.
Declaration of Interests
Michael Seiler, Peter G. Smith, Ping Zhu, Silvia Buonamici, and Lihua Yu are employees of H3 Biomedicine, Inc. Parts of this work are the subject of a patent application: WO2017040526 titled “Splice variants associated with neomorphic sf3b1 mutants.” Shouyoung Peng, Anant A. Agrawal, James Palacino, and Teng Teng are employees of H3 Biomedicine, Inc. Andrew D. Cherniack, Ashton C. Berger, and Galen F. Gao receive research support from Bayer Pharmaceuticals. Gordon B. Mills serves on the External Scientific Review Board of Astrazeneca. Anil Sood is on the Scientific Advisory Board for Kiyatec and is a shareholder in BioPath. Jonathan S. Serody receives funding from Merck, Inc. Kyle R. Covington is an employee of Castle Biosciences, Inc. Preethi H. Gunaratne is founder, CSO, and shareholder of NextmiRNA Therapeutics. Christina Yau is a part-time employee/consultant at NantOmics. Franz X. Schaub is an employee and shareholder of SEngine Precision Medicine, Inc. Carla Grandori is an employee, founder, and shareholder of SEngine Precision Medicine, Inc. Robert N. Eisenman is a member of the Scientific Advisory Boards and shareholder of Shenogen Pharma and Kronos Bio. Daniel J. Weisenberger is a consultant for Zymo Research Corporation. Joshua M. Stuart is the founder of Five3 Genomics and shareholder of NantOmics. Marc T. Goodman receives research support from Merck, Inc. Andrew J. Gentles is a consultant for Cibermed. Charles M. Perou is an equity stock holder, consultant, and Board of Directors member of BioClassifier and GeneCentric Diagnostics and is also listed as an inventor on patent applications on the Breast PAM50 and Lung Cancer Subtyping assays. Matthew Meyerson receives research support from Bayer Pharmaceuticals; is an equity holder in, consultant for, and Scientific Advisory Board chair for OrigiMed; and is an inventor of a patent for EGFR mutation diagnosis in lung cancer, licensed to LabCorp. Eduard Porta-Pardo is an inventor of a patent for domainXplorer. Han Liang is a shareholder and scientific advisor of Precision Scientific and Eagle Nebula. Da Yang is an inventor on a pending patent application describing the use of antisense oligonucleotides against specific lncRNA sequence as diagnostic and therapeutic tools. Yonghong Xiao was an employee and shareholder of TESARO, Inc. Bin Feng is an employee and shareholder of TESARO, Inc. Carter Van Waes received research funding for the study of IAP inhibitor ASTX660 through a Cooperative Agreement between NIDCD, NIH, and Astex Pharmaceuticals. Raunaq Malhotra is an employee and shareholder of Seven Bridges, Inc. Peter W. Laird serves on the Scientific Advisory Board for AnchorDx. Joel Tepper is a consultant at EMD Serono. Kenneth Wang serves on the Advisory Board for Boston Scientific, Microtech, and Olympus. Andrea Califano is a founder, shareholder, and advisory board member of DarwinHealth, Inc. and a shareholder and advisory board member of Tempus, Inc. Toni K. Choueiri serves as needed on advisory boards for Bristol-Myers Squibb, Merck, and Roche. Lawrence Kwong receives research support from Array BioPharma. Sharon E. Plon is a member of the Scientific Advisory Board for Baylor Genetics Laboratory. Beth Y. Karlan serves on the Advisory Board of Invitae.
Published: April 3, 2018
Footnotes
Supplemental Information includes sixteen tables and one figure and can be found with this article online at https://doi.org/10.1016/j.celrep.2018.03.064.
Contributor Information
Pavel Sumazin, Email: sumazin@bcm.edu.
The Cancer Genome Atlas Research Network:
Samantha J. Caesar-Johnson, John A. Demchok, Ina Felau, Melpomeni Kasapi, Martin L. Ferguson, Carolyn M. Hutter, Heidi J. Sofia, Roy Tarnuzzer, Zhining Wang, Liming Yang, Jean C. Zenklusen, Jiashan (Julia) Zhang, Sudha Chudamani, Jia Liu, Laxmi Lolla, Rashi Naresh, Todd Pihl, Qiang Sun, Yunhu Wan, Ye Wu, Juok Cho, Timothy DeFreitas, Scott Frazer, Nils Gehlenborg, Gad Getz, David I. Heiman, Jaegil Kim, Michael S. Lawrence, Pei Lin, Sam Meier, Michael S. Noble, Gordon Saksena, Doug Voet, Hailei Zhang, Brady Bernard, Nyasha Chambwe, Varsha Dhankani, Theo Knijnenburg, Roger Kramer, Kalle Leinonen, Yuexin Liu, Michael Miller, Sheila Reynolds, Ilya Shmulevich, Vesteinn Thorsson, Wei Zhang, Rehan Akbani, Bradley M. Broom, Apurva M. Hegde, Zhenlin Ju, Rupa S. Kanchi, Anil Korkut, Jun Li, Han Liang, Shiyun Ling, Wenbin Liu, Yiling Lu, Gordon B. Mills, Kwok-Shing Ng, Arvind Rao, Michael Ryan, Jing Wang, John N. Weinstein, Jiexin Zhang, Adam Abeshouse, Joshua Armenia, Debyani Chakravarty, Walid K. Chatila, Ino de Bruijn, Jianjiong Gao, Benjamin E. Gross, Zachary J. Heins, Ritika Kundra, Konnor La, Marc Ladanyi, Augustin Luna, Moriah G. Nissan, Angelica Ochoa, Sarah M. Phillips, Ed Reznik, Francisco Sanchez-Vega, Chris Sander, Nikolaus Schultz, Robert Sheridan, S. Onur Sumer, Yichao Sun, Barry S. Taylor, Jioajiao Wang, Hongxin Zhang, Pavana Anur, Myron Peto, Paul Spellman, Christopher Benz, Joshua M. Stuart, Christopher K. Wong, Christina Yau, D. Neil Hayes, Joel S. Parker, Matthew D. Wilkerson, Adrian Ally, Miruna Balasundaram, Reanne Bowlby, Denise Brooks, Rebecca Carlsen, Eric Chuah, Noreen Dhalla, Robert Holt, Steven J.M. Jones, Katayoon Kasaian, Darlene Lee, Yussanne Ma, Marco A. Marra, Michael Mayo, Richard A. Moore, Andrew J. Mungall, Karen Mungall, A. Gordon Robertson, Sara Sadeghi, Jacqueline E. Schein, Payal Sipahimalani, Angela Tam, Nina Thiessen, Kane Tse, Tina Wong, Ashton C. Berger, Rameen Beroukhim, Andrew D. Cherniack, Carrie Cibulskis, Stacey B. Gabriel, Galen F. Gao, Gavin Ha, Matthew Meyerson, Steven E. Schumacher, Juliann Shih, Melanie H. Kucherlapati, Raju S. Kucherlapati, Stephen Baylin, Leslie Cope, Ludmila Danilova, Moiz S. Bootwalla, Phillip H. Lai, Dennis T. Maglinte, David J. Van Den Berg, Daniel J. Weisenberger, J. Todd Auman, Saianand Balu, Tom Bodenheimer, Cheng Fan, Katherine A. Hoadley, Alan P. Hoyle, Stuart R. Jefferys, Corbin D. Jones, Shaowu Meng, Piotr A. Mieczkowski, Lisle E. Mose, Amy H. Perou, Charles M. Perou, Jeffrey Roach, Yan Shi, Janae V. Simons, Tara Skelly, Matthew G. Soloway, Donghui Tan, Umadevi Veluvolu, Huihui Fan, Toshinori Hinoue, Peter W. Laird, Hui Shen, Wanding Zhou, Michelle Bellair, Kyle Chang, Kyle Covington, Chad J. Creighton, Huyen Dinh, HarshaVardhan Doddapaneni, Lawrence A. Donehower, Jennifer Drummond, Richard A. Gibbs, Robert Glenn, Walker Hale, Yi Han, Jianhong Hu, Viktoriya Korchina, Sandra Lee, Lora Lewis, Wei Li, Xiuping Liu, Margaret Morgan, Donna Morton, Donna Muzny, Jireh Santibanez, Margi Sheth, Eve Shinbrot, Linghua Wang, Min Wang, David A. Wheeler, Liu Xi, Fengmei Zhao, Julian Hess, Elizabeth L. Appelbaum, Matthew Bailey, Matthew G. Cordes, Li Ding, Catrina C. Fronick, Lucinda A. Fulton, Robert S. Fulton, Cyriac Kandoth, Elaine R. Mardis, Michael D. McLellan, Christopher A. Miller, Heather K. Schmidt, Richard K. Wilson, Daniel Crain, Erin Curley, Johanna Gardner, Kevin Lau, David Mallery, Scott Morris, Joseph Paulauskis, Robert Penny, Candace Shelton, Troy Shelton, Mark Sherman, Eric Thompson, Peggy Yena, Jay Bowen, Julie M. Gastier-Foster, Mark Gerken, Kristen M. Leraas, Tara M. Lichtenberg, Nilsa C. Ramirez, Lisa Wise, Erik Zmuda, Niall Corcoran, Tony Costello, Christopher Hovens, Andre L. Carvalho, Ana C. de Carvalho, José H. Fregnani, Adhemar Longatto-Filho, Rui M. Reis, Cristovam Scapulatempo-Neto, Henrique C.S. Silveira, Daniel O. Vidal, Andrew Burnette, Jennifer Eschbacher, Beth Hermes, Ardene Noss, Rosy Singh, Matthew L. Anderson, Patricia D. Castro, Michael Ittmann, David Huntsman, Bernard Kohl, Xuan Le, Richard Thorp, Chris Andry, Elizabeth R. Duffy, Vladimir Lyadov, Oxana Paklina, Galiya Setdikova, Alexey Shabunin, Mikhail Tavobilov, Christopher McPherson, Ronald Warnick, Ross Berkowitz, Daniel Cramer, Colleen Feltmate, Neil Horowitz, Adam Kibel, Michael Muto, Chandrajit P. Raut, Andrei Malykh, Jill S. Barnholtz-Sloan, Wendi Barrett, Karen Devine, Jordonna Fulop, Quinn T. Ostrom, Kristen Shimmel, Yingli Wolinsky, Andrew E. Sloan, Agostino De Rose, Felice Giuliante, Marc Goodman, Beth Y. Karlan, Curt H. Hagedorn, John Eckman, Jodi Harr, Jerome Myers, Kelinda Tucker, Leigh Anne Zach, Brenda Deyarmin, Hai Hu, Leonid Kvecher, Caroline Larson, Richard J. Mural, Stella Somiari, Ales Vicha, Tomas Zelinka, Joseph Bennett, Mary Iacocca, Brenda Rabeno, Patricia Swanson, Mathieu Latour, Louis Lacombe, Bernard Têtu, Alain Bergeron, Mary McGraw, Susan M. Staugaitis, John Chabot, Hanina Hibshoosh, Antonia Sepulveda, Tao Su, Timothy Wang, Olga Potapova, Olga Voronina, Laurence Desjardins, Odette Mariani, Sergio Roman-Roman, Xavier Sastre, Marc-Henri Stern, Feixiong Cheng, Sabina Signoretti, Andrew Berchuck, Darell Bigner, Eric Lipp, Jeffrey Marks, Shannon McCall, Roger McLendon, Angeles Secord, Alexis Sharp, Madhusmita Behera, Daniel J. Brat, Amy Chen, Keith Delman, Seth Force, Fadlo Khuri, Kelly Magliocca, Shishir Maithel, Jeffrey J. Olson, Taofeek Owonikoko, Alan Pickens, Suresh Ramalingam, Dong M. Shin, Gabriel Sica, Erwin G. Van Meir, Hongzheng Zhang, Wil Eijckenboom, Ad Gillis, Esther Korpershoek, Leendert Looijenga, Wolter Oosterhuis, Hans Stoop, Kim E. van Kessel, Ellen C. Zwarthoff, Chiara Calatozzolo, Lucia Cuppini, Stefania Cuzzubbo, Francesco DiMeco, Gaetano Finocchiaro, Luca Mattei, Alessandro Perin, Bianca Pollo, Chu Chen, John Houck, Pawadee Lohavanichbutr, Arndt Hartmann, Christine Stoehr, Robert Stoehr, Helge Taubert, Sven Wach, Bernd Wullich, Witold Kycler, Dawid Murawa, Maciej Wiznerowicz, Ki Chung, W. Jeffrey Edenfield, Julie Martin, Eric Baudin, Glenn Bubley, Raphael Bueno, Assunta De Rienzo, William G. Richards, Steven Kalkanis, Tom Mikkelsen, Houtan Noushmehr, Lisa Scarpace, Nicolas Girard, Marta Aymerich, Elias Campo, Eva Giné, Armando López Guillermo, Nguyen Van Bang, Phan Thi Hanh, Bui Duc Phu, Yufang Tang, Howard Colman, Kimberley Evason, Peter R. Dottino, John A. Martignetti, Hani Gabra, Hartmut Juhl, Teniola Akeredolu, Serghei Stepa, Dave Hoon, Keunsoo Ahn, Koo Jeong Kang, Felix Beuschlein, Anne Breggia, Michael Birrer, Debra Bell, Mitesh Borad, Alan H. Bryce, Erik Castle, Vishal Chandan, John Cheville, John A. Copland, Michael Farnell, Thomas Flotte, Nasra Giama, Thai Ho, Michael Kendrick, Jean-Pierre Kocher, Karla Kopp, Catherine Moser, David Nagorney, Daniel O’Brien, Brian Patrick O’Neill, Tushar Patel, Gloria Petersen, Florencia Que, Michael Rivera, Lewis Roberts, Robert Smallridge, Thomas Smyrk, Melissa Stanton, R. Houston Thompson, Michael Torbenson, Ju Dong Yang, Lizhi Zhang, Fadi Brimo, Jaffer A. Ajani, Ana Maria Angulo Gonzalez, Carmen Behrens, Jolanta Bondaruk, Russell Broaddus, Bogdan Czerniak, Bita Esmaeli, Junya Fujimoto, Jeffrey Gershenwald, Charles Guo, Alexander J. Lazar, Christopher Logothetis, Funda Meric-Bernstam, Cesar Moran, Lois Ramondetta, David Rice, Anil Sood, Pheroze Tamboli, Timothy Thompson, Patricia Troncoso, Anne Tsao, Ignacio Wistuba, Candace Carter, Lauren Haydu, Peter Hersey, Valerie Jakrot, Hojabr Kakavand, Richard Kefford, Kenneth Lee, Georgina Long, Graham Mann, Michael Quinn, Robyn Saw, Richard Scolyer, Kerwin Shannon, Andrew Spillane, Jonathan Stretch, Maria Synott, John Thompson, James Wilmott, Hikmat Al-Ahmadie, Timothy A. Chan, Ronald Ghossein, Anuradha Gopalan, Douglas A. Levine, Victor Reuter, Samuel Singer, Bhuvanesh Singh, Nguyen Viet Tien, Thomas Broudy, Cyrus Mirsaidi, Praveen Nair, Paul Drwiega, Judy Miller, Jennifer Smith, Howard Zaren, Joong-Won Park, Nguyen Phi Hung, Electron Kebebew, W. Marston Linehan, Adam R. Metwalli, Karel Pacak, Peter A. Pinto, Mark Schiffman, Laura S. Schmidt, Cathy D. Vocke, Nicolas Wentzensen, Robert Worrell, Hannah Yang, Marc Moncrieff, Chandra Goparaju, Jonathan Melamed, Harvey Pass, Natalia Botnariuc, Irina Caraman, Mircea Cernat, Inga Chemencedji, Adrian Clipca, Serghei Doruc, Ghenadie Gorincioi, Sergiu Mura, Maria Pirtac, Irina Stancul, Diana Tcaciuc, Monique Albert, Iakovina Alexopoulou, Angel Arnaout, John Bartlett, Jay Engel, Sebastien Gilbert, Jeremy Parfitt, Harman Sekhon, George Thomas, Doris M. Rassl, Robert C. Rintoul, Carlo Bifulco, Raina Tamakawa, Walter Urba, Nicholas Hayward, Henri Timmers, Anna Antenucci, Francesco Facciolo, Gianluca Grazi, Mirella Marino, Roberta Merola, Ronald de Krijger, Anne-Paule Gimenez-Roqueplo, Alain Piché, Simone Chevalier, Ginette McKercher, Kivanc Birsoy, Gene Barnett, Cathy Brewer, Carol Farver, Theresa Naska, Nathan A. Pennell, Daniel Raymond, Cathy Schilero, Kathy Smolenski, Felicia Williams, Carl Morrison, Jeffrey A. Borgia, Michael J. Liptay, Mark Pool, Christopher W. Seder, Kerstin Junker, Larsson Omberg, Mikhail Dinkin, George Manikhas, Domenico Alvaro, Maria Consiglia Bragazzi, Vincenzo Cardinale, Guido Carpino, Eugenio Gaudio, David Chesla, Sandra Cottingham, Michael Dubina, Fedor Moiseenko, Renumathy Dhanasekaran, Karl-Friedrich Becker, Klaus-Peter Janssen, Julia Slotta-Huspenina, Mohamed H. Abdel-Rahman, Dina Aziz, Sue Bell, Colleen M. Cebulla, Amy Davis, Rebecca Duell, J. Bradley Elder, Joe Hilty, Bahavna Kumar, James Lang, Norman L. Lehman, Randy Mandt, Phuong Nguyen, Robert Pilarski, Karan Rai, Lynn Schoenfield, Kelly Senecal, Paul Wakely, Paul Hansen, Ronald Lechan, James Powers, Arthur Tischler, William E. Grizzle, Katherine C. Sexton, Alison Kastl, Joel Henderson, Sima Porten, Jens Waldmann, Martin Fassnacht, Sylvia L. Asa, Dirk Schadendorf, Marta Couce, Markus Graefen, Hartwig Huland, Guido Sauter, Thorsten Schlomm, Ronald Simon, Pierre Tennstedt, Oluwole Olabode, Mark Nelson, Oliver Bathe, Peter R. Carroll, June M. Chan, Philip Disaia, Pat Glenn, Robin K. Kelley, Charles N. Landen, Joanna Phillips, Michael Prados, Jeffry Simko, Karen Smith-McCune, Scott VandenBerg, Kevin Roggin, Ashley Fehrenbach, Ady Kendler, Suzanne Sifri, Ruth Steele, Antonio Jimeno, Francis Carey, Ian Forgie, Massimo Mannelli, Michael Carney, Brenda Hernandez, Benito Campos, Christel Herold-Mende, Christin Jungk, Andreas Unterberg, Andreas von Deimling, Aaron Bossler, Joseph Galbraith, Laura Jacobus, Michael Knudson, Tina Knutson, Deqin Ma, Mohammed Milhem, Rita Sigmund, Andrew K. Godwin, Rashna Madan, Howard G. Rosenthal, Clement Adebamowo, Sally N. Adebamowo, Alex Boussioutas, David Beer, Thomas Giordano, Anne-Marie Mes-Masson, Fred Saad, Therese Bocklage, Lisa Landrum, Robert Mannel, Kathleen Moore, Katherine Moxley, Russel Postier, Joan Walker, Rosemary Zuna, Michael Feldman, Federico Valdivieso, Rajiv Dhir, James Luketich, Edna M. Mora Pinero, Mario Quintero-Aguilo, Carlos Gilberto Carlotti, Jr., Jose Sebastião Dos Santos, Rafael Kemp, Ajith Sankarankuty, Daniela Tirapelli, James Catto, Kathy Agnew, Elizabeth Swisher, Jenette Creaney, Bruce Robinson, Carl Simon Shelley, Eryn M. Godwin, Sara Kendall, Cassaundra Shipman, Carol Bradford, Thomas Carey, Andrea Haddad, Jeffey Moyer, Lisa Peterson, Mark Prince, Laura Rozek, Gregory Wolf, Rayleen Bowman, Kwun M. Fong, Ian Yang, Robert Korst, W. Kimryn Rathmell, J. Leigh Fantacone-Campbell, Jeffrey A. Hooke, Albert J. Kovatich, Craig D. Shriver, John DiPersio, Bettina Drake, Ramaswamy Govindan, Sharon Heath, Timothy Ley, Brian Van Tine, Peter Westervelt, Mark A. Rubin, Jung Il Lee, Natália D. Aredes, and Armaz Mariamidze
Web Resources
RNA-Seq data associated with Figure S1: https://www.ebi.ac.uk/ena/data/view/PRJEB21799
LongHorn implementation: http://longhorntool.sourceforge.net
Raw data, processed data, and clinical tumor data: https://portal.gdc.cancer.gov/legacy-archive/search/f
Mutation data: https://gdc.cancer.gov/about-data/publications/mc3-2017
TCGA data: http://gdac.broadinstitute.org, http://www.cbioportal.org
Information about TCGA and investigators and institutions constituting TCGA research network: cancergenome.nih.gov
Supplemental Information
References
- An O., Dall’Olio G.M., Mourikis T.P., Ciccarelli F.D. NCG 5.0: updates of a manually curated repository of cancer genes and associated properties from cancer mutational screenings. Nucleic Acids Res. 2016;44:D992–D999. doi: 10.1093/nar/gkv1123. [DOI] [PMC free article] [PubMed] [Google Scholar]
- Bansal M., Mendiratta G., Anand S., Kushwaha R., Kim R., Kustagi M., Iyer A., Chaganti R.S., Califano A., Sumazin P. Direct ChIP-seq significance analysis improves target prediction. BMC Genomics. 2015;16(Suppl 5):S4. doi: 10.1186/1471-2164-16-S5-S4. [DOI] [PMC free article] [PubMed] [Google Scholar]
- Barretina J., Caponigro G., Stransky N., Venkatesan K., Margolin A.A., Kim S., Wilson C.J., Lehár J., Kryukov G.V., Sonkin D. The Cancer Cell Line Encyclopedia enables predictive modelling of anticancer drug sensitivity. Nature. 2012;483:603–607. doi: 10.1038/nature11003. [DOI] [PMC free article] [PubMed] [Google Scholar]
- Beroukhim R., Mermel C.H., Porter D., Wei G., Raychaudhuri S., Donovan J., Barretina J., Boehm J.S., Dobson J., Urashima M. The landscape of somatic copy-number alteration across human cancers. Nature. 2010;463:899–905. doi: 10.1038/nature08822. [DOI] [PMC free article] [PubMed] [Google Scholar]
- Bovolenta L.A., Acencio M.L., Lemke N. HTRIdb: an open-access database for experimentally verified human transcriptional regulation interactions. BMC Genomics. 2012;13:405. doi: 10.1186/1471-2164-13-405. [DOI] [PMC free article] [PubMed] [Google Scholar]
- Bowman A.W., Azzalini A. Oxford University Press; 1997. Applied Smoothing Techniques for Data Analysis: The Kernel Approach with S-Plus Illustrations. [Google Scholar]
- Buske F.A., Bauer D.C., Mattick J.S., Bailey T.L. Triplexator: detecting nucleic acid triple helices in genomic and transcriptomic data. Genome Res. 2012;22:1372–1381. doi: 10.1101/gr.130237.111. [DOI] [PMC free article] [PubMed] [Google Scholar]
- Cesana M., Cacchiarelli D., Legnini I., Santini T., Sthandier O., Chinappi M., Tramontano A., Bozzoni I. A long noncoding RNA controls muscle differentiation by functioning as a competing endogenous RNA. Cell. 2011;147:358–369. doi: 10.1016/j.cell.2011.09.028. [DOI] [PMC free article] [PubMed] [Google Scholar]
- Chang C.C., Lin C.J. LIBSVM: a library for support vector machines. ACM Trans. Intell. Syst. Technol. 2011;2:1–27. [Google Scholar]
- Chen J., Guo L., Peiffer D.A., Zhou L., Chan O.T.M., Bibikova M., Wickham-Garcia E., Lu S.H., Zhan Q., Wang-Rodriguez J. Genomic profiling of 766 cancer-related genes in archived esophageal normal and carcinoma tissues. Int. J. Cancer. 2008;122:2249–2254. doi: 10.1002/ijc.23397. [DOI] [PubMed] [Google Scholar]
- Cheng W.-Y., Yang T.-H.O., Shen H., Laird P.W., Anastassiou D. Multi-cancer molecular signatures and their interrelationships. 2013. https://arxiv.org/abs/1306.2584 arXiv, arXiv:1306.2584.
- Ching T., Peplowska K., Huang S., Zhu X., Shen Y., Molnar J., Yu H., Tiirikainen M., Fogelgren B., Fan R., Garmire L.X. Pan-cancer analyses reveal long intergenic non-coding RNAs relevant to tumor diagnosis, subtyping and prognosis. EBioMedicine. 2016;7:62–72. doi: 10.1016/j.ebiom.2016.03.023. [DOI] [PMC free article] [PubMed] [Google Scholar]
- Chiu H.S., Llobet-Navas D., Yang X., Chung W.J., Ambesi-Impiombato A., Iyer A., Kim H.R., Seviour E.G., Luo Z., Sehgal V. Cupid: simultaneous reconstruction of microRNA-target and ceRNA networks. Genome Res. 2015;25:257–267. doi: 10.1101/gr.178194.114. [DOI] [PMC free article] [PubMed] [Google Scholar]
- Chiu H.-S., Martínez M.R., Bansal M., Subramanian A., Golub T.R., Yang X., Sumazin P., Califano A. High-throughput validation of ceRNA regulatory networks. BMC Genomics. 2017;18:418. doi: 10.1186/s12864-017-3790-7. [DOI] [PMC free article] [PubMed] [Google Scholar]
- Curtis C., Shah S.P., Chin S.F., Turashvili G., Rueda O.M., Dunning M.J., Speed D., Lynch A.G., Samarajiwa S., Yuan Y., METABRIC Group The genomic and transcriptomic architecture of 2,000 breast tumours reveals novel subgroups. Nature. 2012;486:346–352. doi: 10.1038/nature10983. [DOI] [PMC free article] [PubMed] [Google Scholar]
- da Rocha S.T., Heard E. Novel players in X inactivation: insights into Xist-mediated gene silencing and chromosome conformation. Nat. Struct. Mol. Biol. 2017;24:197–204. doi: 10.1038/nsmb.3370. [DOI] [PubMed] [Google Scholar]
- Djebali S., Davis C.A., Merkel A., Dobin A., Lassmann T., Mortazavi A., Tanzer A., Lagarde J., Lin W., Schlesinger F. Landscape of transcription in human cells. Nature. 2012;489:101–108. doi: 10.1038/nature11233. [DOI] [PMC free article] [PubMed] [Google Scholar]
- Dobin A., Davis C.A., Schlesinger F., Drenkow J., Zaleski C., Jha S., Batut P., Chaisson M., Gingeras T.R. STAR: ultrafast universal RNA-seq aligner. Bioinformatics. 2013;29:15–21. doi: 10.1093/bioinformatics/bts635. [DOI] [PMC free article] [PubMed] [Google Scholar]
- Donnelly C.J., Willis D.E., Xu M., Tep C., Jiang C., Yoo S., Schanen N.C., Kirn-Safran C.B., van Minnen J., English A. Limited availability of ZBP1 restricts axonal mRNA localization and nerve regeneration capacity. EMBO J. 2011;30:4665–4677. doi: 10.1038/emboj.2011.347. [DOI] [PMC free article] [PubMed] [Google Scholar]
- ENCODE Project Consortium An integrated encyclopedia of DNA elements in the human genome. Nature. 2012;489:57–74. doi: 10.1038/nature11247. [DOI] [PMC free article] [PubMed] [Google Scholar]
- Friedman J., Hastie T., Tibshirani R. Regularization Paths for Generalized Linear Models via Coordinate Descent. J. Stat. Softw. 2010;33:1–22. [PMC free article] [PubMed] [Google Scholar]
- Futreal P.A., Coin L., Marshall M., Down T., Hubbard T., Wooster R., Rahman N., Stratton M.R. A census of human cancer genes. Nat. Rev. Cancer. 2004;4:177–183. doi: 10.1038/nrc1299. [DOI] [PMC free article] [PubMed] [Google Scholar]
- Gasri-Plotnitsky L., Ovadia A., Shamalov K., Nizri-Megnaji T., Meir S., Zurer I., Cohen C.J., Ginsberg D. A novel lncRNA, GASL1, inhibits cell proliferation and restricts E2F1 activity. Oncotarget. 2017;8:23775–23786. doi: 10.18632/oncotarget.15864. [DOI] [PMC free article] [PubMed] [Google Scholar]
- Gotea V., Visel A., Westlund J.M., Nobrega M.A., Pennacchio L.A., Ovcharenko I. Homotypic clusters of transcription factor binding sites are a key component of human promoters and enhancers. Genome Res. 2010;20:565–577. doi: 10.1101/gr.104471.109. [DOI] [PMC free article] [PubMed] [Google Scholar]
- Grosswendt S., Filipchyk A., Manzano M., Klironomos F., Schilling M., Herzog M., Gottwein E., Rajewsky N. Unambiguous identification of miRNA:target site interactions by different types of ligation reactions. Mol. Cell. 2014;54:1042–1054. doi: 10.1016/j.molcel.2014.03.049. [DOI] [PMC free article] [PubMed] [Google Scholar]
- Gupta R.A., Shah N., Wang K.C., Kim J., Horlings H.M., Wong D.J., Tsai M.-C., Hung T., Argani P., Rinn J.L. Long non-coding RNA HOTAIR reprograms chromatin state to promote cancer metastasis. Nature. 2010;464:1071–1076. doi: 10.1038/nature08975. [DOI] [PMC free article] [PubMed] [Google Scholar]
- Hansen T.B., Jensen T.I., Clausen B.H., Bramsen J.B., Finsen B., Damgaard C.K., Kjems J. Natural RNA circles function as efficient microRNA sponges. Nature. 2013;495:384–388. doi: 10.1038/nature11993. [DOI] [PubMed] [Google Scholar]
- Hausser J., Syed A.P., Bilen B., Zavolan M. Analysis of CDS-located miRNA target sites suggests that they can effectively inhibit translation. Genome Res. 2013;23:604–615. doi: 10.1101/gr.139758.112. [DOI] [PMC free article] [PubMed] [Google Scholar]
- Higgins M.E., Claremont M., Major J.E., Sander C., Lash A.E. CancerGenes: a gene selection resource for cancer genome projects. Nucleic Acids Res. 2007;35:D721–D726. doi: 10.1093/nar/gkl811. [DOI] [PMC free article] [PubMed] [Google Scholar]
- Hon C.-C., Ramilowski J.A., Harshbarger J., Bertin N., Rackham O.J., Gough J., Denisenko E., Schmeier S., Poulsen T.M., Severin J. An atlas of human long non-coding RNAs with accurate 5′ ends. Nature. 2017;543:199–204. doi: 10.1038/nature21374. [DOI] [PMC free article] [PubMed] [Google Scholar]
- Hu X., Feng Y., Zhang D., Zhao S.D., Hu Z., Greshock J., Zhang Y., Yang L., Zhong X., Wang L.-P. A functional genomic approach identifies FAL1 as an oncogenic long noncoding RNA that associates with BMI1 and represses p21 expression in cancer. Cancer Cell. 2014;26:344–357. doi: 10.1016/j.ccr.2014.07.009. [DOI] [PMC free article] [PubMed] [Google Scholar]
- Huarte M. The emerging role of lncRNAs in cancer. Nat. Med. 2015;21:1253–1261. doi: 10.1038/nm.3981. [DOI] [PubMed] [Google Scholar]
- Hung T., Wang Y., Lin M.F., Koegel A.K., Kotake Y., Grant G.D., Horlings H.M., Shah N., Umbricht C., Wang P. Extensive and coordinated transcription of noncoding RNAs within cell-cycle promoters. Nat. Genet. 2011;43:621–629. doi: 10.1038/ng.848. [DOI] [PMC free article] [PubMed] [Google Scholar]
- Iyer M.K., Niknafs Y.S., Malik R., Singhal U., Sahu A., Hosono Y., Barrette T.R., Prensner J.R., Evans J.R., Zhao S. The landscape of long noncoding RNAs in the human transcriptome. Nat. Genet. 2015;47:199–208. doi: 10.1038/ng.3192. [DOI] [PMC free article] [PubMed] [Google Scholar]
- Jiang M., Anderson J., Gillespie J., Mayne M. uShuffle: a useful tool for shuffling biological sequences while preserving the k-let counts. BMC Bioinformatics. 2008;9:192. doi: 10.1186/1471-2105-9-192. [DOI] [PMC free article] [PubMed] [Google Scholar]
- Jolma A., Yan J., Whitington T., Toivonen J., Nitta K.R., Rastas P., Morgunova E., Enge M., Taipale M., Wei G. DNA-binding specificities of human transcription factors. Cell. 2013;152:327–339. doi: 10.1016/j.cell.2012.12.009. [DOI] [PubMed] [Google Scholar]
- Kim K., Jutooru I., Chadalapaka G., Johnson G., Frank J., Burghardt R., Kim S., Safe S. HOTAIR is a negative prognostic factor and exhibits pro-oncogenic activity in pancreatic cancer. Oncogene. 2013;32:1616–1625. doi: 10.1038/onc.2012.193. [DOI] [PMC free article] [PubMed] [Google Scholar]
- Kino T., Hurt D.E., Ichijo T., Nader N., Chrousos G.P. Noncoding RNA gas5 is a growth arrest- and starvation-associated repressor of the glucocorticoid receptor. Sci. Signal. 2010;3:ra8. doi: 10.1126/scisignal.2000568. [DOI] [PMC free article] [PubMed] [Google Scholar]
- Korn J.M., Kuruvilla F.G., McCarroll S.A., Wysoker A., Nemesh J., Cawley S., Hubbell E., Veitch J., Collins P.J., Darvishi K. Integrated genotype calling and association analysis of SNPs, common copy number polymorphisms and rare CNVs. Nat. Genet. 2008;40:1253–1260. doi: 10.1038/ng.237. [DOI] [PMC free article] [PubMed] [Google Scholar]
- Koudritsky M., Domany E. Positional distribution of human transcription factor binding sites. Nucleic Acids Res. 2008;36:6795–6805. doi: 10.1093/nar/gkn752. [DOI] [PMC free article] [PubMed] [Google Scholar]
- Kozomara A., Griffiths-Jones S. miRBase: annotating high confidence microRNAs using deep sequencing data. Nucleic Acids Res. 2014;42:D68–D73. doi: 10.1093/nar/gkt1181. [DOI] [PMC free article] [PubMed] [Google Scholar]
- Kulakovskiy I.V., Medvedeva Y.A., Schaefer U., Kasianov A.S., Vorontsov I.E., Bajic V.B., Makeev V.J. HOCOMOCO: a comprehensive collection of human transcription factor binding sites models. Nucleic Acids Res. 2013;41:D195–D202. doi: 10.1093/nar/gks1089. [DOI] [PMC free article] [PubMed] [Google Scholar]
- Lawrence M.S., Stojanov P., Mermel C.H., Robinson J.T., Garraway L.A., Golub T.R., Meyerson M., Gabriel S.B., Lander E.S., Getz G. Discovery and saturation analysis of cancer genes across 21 tumour types. Nature. 2014;505:495–501. doi: 10.1038/nature12912. [DOI] [PMC free article] [PubMed] [Google Scholar]
- Lee S., Kopp F., Chang T.-C., Sataluri A., Chen B., Sivakumar S., Yu H., Xie Y., Mendell J.T. Noncoding RNA NORAD regulates genomic stability by sequestering PUMILIO proteins. Cell. 2016;164:69–80. doi: 10.1016/j.cell.2015.12.017. [DOI] [PMC free article] [PubMed] [Google Scholar]
- Lefebvre C., Rajbhandari P., Alvarez M.J., Bandaru P., Lim W.K., Sato M., Wang K., Sumazin P., Kustagi M., Bisikirska B.C. A human B-cell interactome identifies MYB and FOXM1 as master regulators of proliferation in germinal centers. Mol. Syst. Biol. 2010;6:377. doi: 10.1038/msb.2010.31. [DOI] [PMC free article] [PubMed] [Google Scholar]
- Li H., Handsaker B., Wysoker A., Fennell T., Ruan J., Homer N., Marth G., Abecasis G., Durbin R., 1000 Genome Project Data Processing Subgroup The Sequence Alignment/Map format and SAMtools. Bioinformatics. 2009;25:2078–2079. doi: 10.1093/bioinformatics/btp352. [DOI] [PMC free article] [PubMed] [Google Scholar]
- Li J., Han L., Roebuck P., Diao L., Liu L., Yuan Y., Weinstein J.N., Liang H. TANRIC: an interactive open platform to explore the function of lncRNAs in cancer. Cancer Res. 2015;75:3728–3737. doi: 10.1158/0008-5472.CAN-15-0273. [DOI] [PMC free article] [PubMed] [Google Scholar]
- Li S., Li B., Zheng Y., Li M., Shi L., Pu X. Exploring functions of long noncoding RNAs across multiple cancers through co-expression network. Sci. Rep. 2017;7:754. doi: 10.1038/s41598-017-00856-8. [DOI] [PMC free article] [PubMed] [Google Scholar]
- Liberzon A., Birger C., Thorvaldsdóttir H., Ghandi M., Mesirov J.P., Tamayo P. The Molecular Signatures Database (MSigDB) hallmark gene set collection. Cell Syst. 2015;1:417–425. doi: 10.1016/j.cels.2015.12.004. [DOI] [PMC free article] [PubMed] [Google Scholar]
- Liu Y., Zhao M. lnCaNet: pan-cancer co-expression network for human lncRNA and cancer genes. Bioinformatics. 2016;32:1595–1597. doi: 10.1093/bioinformatics/btw017. [DOI] [PubMed] [Google Scholar]
- Liu S.J., Horlbeck M.A., Cho S.W., Birk H.S., Malatesta M., He D., Attenello F.J., Villalta J.E., Cho M.Y., Chen Y. CRISPRi-based genome-scale identification of functional long noncoding RNA loci in human cells. Science. 2017;355:eaah7111. doi: 10.1126/science.aah7111. [DOI] [PMC free article] [PubMed] [Google Scholar]
- Long F., Liu H., Hahn C., Sumazin P., Zhang M.Q., Zilberstein A. Genome-wide prediction and analysis of function-specific transcription factor binding sites. In Silico Biol. (Gedrukt) 2004;4:395–410. [PubMed] [Google Scholar]
- Margolin A.A., Palomero T., Sumazin P., Califano A., Ferrando A.A., Stolovitzky G. ChIP-on-chip significance analysis reveals large-scale binding and regulation by human transcription factor oncogenes. Proc. Natl. Acad. Sci. USA. 2009;106:244–249. doi: 10.1073/pnas.0806445106. [DOI] [PMC free article] [PubMed] [Google Scholar]
- Matys V., Kel-Margoulis O.V., Fricke E., Liebich I., Land S., Barre-Dirrie A., Reuter I., Chekmenev D., Krull M., Hornischer K. TRANSFAC and its module TRANSCompel: transcriptional gene regulation in eukaryotes. Nucleic Acids Res. 2006;34:D108–D110. doi: 10.1093/nar/gkj143. [DOI] [PMC free article] [PubMed] [Google Scholar]
- Mootha V.K., Lindgren C.M., Eriksson K.F., Subramanian A., Sihag S., Lehar J., Puigserver P., Carlsson E., Ridderstråle M., Laurila E. PGC-1alpha-responsive genes involved in oxidative phosphorylation are coordinately downregulated in human diabetes. Nat. Genet. 2003;34:267–273. doi: 10.1038/ng1180. [DOI] [PubMed] [Google Scholar]
- Oliver S. Guilt-by-association goes global. Nature. 2000;403:601–603. doi: 10.1038/35001165. [DOI] [PubMed] [Google Scholar]
- Pachkov M., Erb I., Molina N., van Nimwegen E. SwissRegulon: a database of genome-wide annotations of regulatory sites. Nucleic Acids Res. 2007;35:D127–D131. doi: 10.1093/nar/gkl857. [DOI] [PMC free article] [PubMed] [Google Scholar]
- Pandey G.K., Mitra S., Subhash S., Hertwig F., Kanduri M., Mishra K., Fransson S., Ganeshram A., Mondal T., Bandaru S. The risk-associated long noncoding RNA NBAT-1 controls neuroblastoma progression by regulating cell proliferation and neuronal differentiation. Cancer Cell. 2014;26:722–737. doi: 10.1016/j.ccell.2014.09.014. [DOI] [PubMed] [Google Scholar]
- Prensner J.R., Iyer M.K., Sahu A., Asangani I.A., Cao Q., Patel L., Vergara I.A., Davicioni E., Erho N., Ghadessi M. The long noncoding RNA SChLAP1 promotes aggressive prostate cancer and antagonizes the SWI/SNF complex. Nat. Genet. 2013;45:1392–1398. doi: 10.1038/ng.2771. [DOI] [PMC free article] [PubMed] [Google Scholar]
- Rahman N. Realizing the promise of cancer predisposition genes. Nature. 2014;505:302–308. doi: 10.1038/nature12981. [DOI] [PMC free article] [PubMed] [Google Scholar]
- Rapicavoli N.A., Qu K., Zhang J., Mikhail M., Laberge R.-M., Chang H.Y. A mammalian pseudogene lncRNA at the interface of inflammation and anti-inflammatory therapeutics. eLife. 2013;2:e00762. doi: 10.7554/eLife.00762. [DOI] [PMC free article] [PubMed] [Google Scholar]
- Rousseeuw P.J., Croux C. Alternatives to the median absolute deviation. J. Am. Stat. Assoc. 1993;88:1273–1283. [Google Scholar]
- Sandelin A., Alkema W., Engström P., Wasserman W.W., Lenhard B. JASPAR: an open-access database for eukaryotic transcription factor binding profiles. Nucleic Acids Res. 2004;32:D91–D94. doi: 10.1093/nar/gkh012. [DOI] [PMC free article] [PubMed] [Google Scholar]
- Schmitt A.M., Chang H.Y. Long noncoding RNAs in cancer pathways. Cancer Cell. 2016;29:452–463. doi: 10.1016/j.ccell.2016.03.010. [DOI] [PMC free article] [PubMed] [Google Scholar]
- Schneider C.A., Rasband W.S., Eliceiri K.W. NIH Image to ImageJ: 25 years of image analysis. Nat. Methods. 2012;9:671–675. doi: 10.1038/nmeth.2089. [DOI] [PMC free article] [PubMed] [Google Scholar]
- Shedden K., Taylor J.M., Enkemann S.A., Tsao M.-S., Yeatman T.J., Gerald W.L., Eschrich S., Jurisica I., Giordano T.J., Misek D.E., Director’s Challenge Consortium for the Molecular Classification of Lung Adenocarcinoma Gene expression-based survival prediction in lung adenocarcinoma: a multi-site, blinded validation study. Nat. Med. 2008;14:822–827. doi: 10.1038/nm.1790. [DOI] [PMC free article] [PubMed] [Google Scholar]
- Siepel A., Bejerano G., Pedersen J.S., Hinrichs A.S., Hou M., Rosenbloom K., Clawson H., Spieth J., Hillier L.W., Richards S. Evolutionarily conserved elements in vertebrate, insect, worm, and yeast genomes. Genome Res. 2005;15:1034–1050. doi: 10.1101/gr.3715005. [DOI] [PMC free article] [PubMed] [Google Scholar]
- Sikora-Wohlfeld W., Ackermann M., Christodoulou E.G., Singaravelu K., Beyer A. Assessing computational methods for transcription factor target gene identification based on ChIP-seq data. PLoS Comput. Biol. 2013;9:e1003342. doi: 10.1371/journal.pcbi.1003342. [DOI] [PMC free article] [PubMed] [Google Scholar]
- Smith A.D., Sumazin P., Das D., Zhang M.Q. Mining ChIP-chip data for transcription factor and cofactor binding sites. Bioinformatics. 2005;21(Suppl 1):i403–i412. doi: 10.1093/bioinformatics/bti1043. [DOI] [PubMed] [Google Scholar]
- Smith A.D., Sumazin P., Xuan Z., Zhang M.Q. DNA motifs in human and mouse proximal promoters predict tissue-specific expression. Proc. Natl. Acad. Sci. USA. 2006;103:6275–6280. doi: 10.1073/pnas.0508169103. [DOI] [PMC free article] [PubMed] [Google Scholar]
- Smith A.D., Sumazin P., Zhang M.Q. Tissue-specific regulatory elements in mammalian promoters. Mol. Syst. Biol. 2007;3:73. doi: 10.1038/msb4100114. [DOI] [PMC free article] [PubMed] [Google Scholar]
- Stouffer S.A., Suchman E.A., Devinney L.C., Star S.A., Williams R.M., Jr. Princeton University Press; 1949. The American Soldier: Adjustment during Army Life (Studies in Social Psychology in World War II, Vol. 1) [Google Scholar]
- Subramanian A., Tamayo P., Mootha V.K., Mukherjee S., Ebert B.L., Gillette M.A., Paulovich A., Pomeroy S.L., Golub T.R., Lander E.S., Mesirov J.P. Gene set enrichment analysis: a knowledge-based approach for interpreting genome-wide expression profiles. Proc. Natl. Acad. Sci. USA. 2005;102:15545–15550. doi: 10.1073/pnas.0506580102. [DOI] [PMC free article] [PubMed] [Google Scholar]
- Subramanian A., Kuehn H., Gould J., Tamayo P., Mesirov J.P. GSEA-P: a desktop application for Gene Set Enrichment Analysis. Bioinformatics. 2007;23:3251–3253. doi: 10.1093/bioinformatics/btm369. [DOI] [PubMed] [Google Scholar]
- Sullenger B.A., Nair S. From the RNA world to the clinic. Science. 2016;352:1417–1420. doi: 10.1126/science.aad8709. [DOI] [PMC free article] [PubMed] [Google Scholar]
- Sumazin P., Yang X., Chiu H.S., Chung W.J., Iyer A., Llobet-Navas D., Rajbhandari P., Bansal M., Guarnieri P., Silva J., Califano A. An extensive microRNA-mediated network of RNA-RNA interactions regulates established oncogenic pathways in glioblastoma. Cell. 2011;147:370–381. doi: 10.1016/j.cell.2011.09.041. [DOI] [PMC free article] [PubMed] [Google Scholar]
- Sun M., Xia R., Jin F., Xu T., Liu Z., De W., Liu X. Downregulated long noncoding RNA MEG3 is associated with poor prognosis and promotes cell proliferation in gastric cancer. Tumour Biol. 2014;35:1065–1073. doi: 10.1007/s13277-013-1142-z. [DOI] [PubMed] [Google Scholar]
- Székely G.J., Rizzo M.L., Bakirov N.K. Measuring and testing dependence by correlation of distances. Ann. Stat. 2007;35:2769–2794. [Google Scholar]
- Tamborero D., Gonzalez-Perez A., Perez-Llamas C., Deu-Pons J., Kandoth C., Reimand J., Lawrence M.S., Getz G., Bader G.D., Ding L., Lopez-Bigas N. Comprehensive identification of mutational cancer driver genes across 12 tumor types. Sci. Rep. 2013;3:2650. doi: 10.1038/srep02650. [DOI] [PMC free article] [PubMed] [Google Scholar]
- Tibshirani R. Regression shrinkage and selection via the lasso. J. R. Stat. Soc. Series B Stat. Methodol. 1996;58:267–288. [Google Scholar]
- Trapnell C., Roberts A., Goff L., Pertea G., Kim D., Kelley D.R., Pimentel H., Salzberg S.L., Rinn J.L., Pachter L. Differential gene and transcript expression analysis of RNA-seq experiments with TopHat and Cufflinks. Nat. Protoc. 2012;7:562–578. doi: 10.1038/nprot.2012.016. [DOI] [PMC free article] [PubMed] [Google Scholar]
- Tripathi V., Shen Z., Chakraborty A., Giri S., Freier S.M., Wu X., Zhang Y., Gorospe M., Prasanth S.G., Lal A., Prasanth K.V. Long noncoding RNA MALAT1 controls cell cycle progression by regulating the expression of oncogenic transcription factor B-MYB. PLoS Genet. 2013;9:e1003368. doi: 10.1371/journal.pgen.1003368. [DOI] [PMC free article] [PubMed] [Google Scholar]
- Van Nostrand E.L., Pratt G.A., Shishkin A.A., Gelboin-Burkhart C., Fang M.Y., Sundararaman B., Blue S.M., Nguyen T.B., Surka C., Elkins K. Robust transcriptome-wide discovery of RNA-binding protein binding sites with enhanced CLIP (eCLIP) Nat. Methods. 2016;13:508–514. doi: 10.1038/nmeth.3810. [DOI] [PMC free article] [PubMed] [Google Scholar]
- Vlachos I.S., Paraskevopoulou M.D., Karagkouni D., Georgakilas G., Vergoulis T., Kanellos I., Anastasopoulos I.L., Maniou S., Karathanou K., Kalfakakou D. DIANA-TarBase v7.0: indexing more than half a million experimentally supported miRNA:mRNA interactions. Nucleic Acids Res. 2015;43:D153–D159. doi: 10.1093/nar/gku1215. [DOI] [PMC free article] [PubMed] [Google Scholar]
- Wang K., Saito M., Bisikirska B.C., Alvarez M.J., Lim W.K., Rajbhandari P., Shen Q., Nemenman I., Basso K., Margolin A.A. Genome-wide identification of post-translational modulators of transcription factor activity in human B cells. Nat. Biotechnol. 2009;27:829–839. doi: 10.1038/nbt.1563. [DOI] [PMC free article] [PubMed] [Google Scholar]
- Wang J., Zhuang J., Iyer S., Lin X., Whitfield T.W., Greven M.C., Pierce B.G., Dong X., Kundaje A., Cheng Y. Sequence features and chromatin structure around the genomic regions bound by 119 human transcription factors. Genome Res. 2012;22:1798–1812. doi: 10.1101/gr.139105.112. [DOI] [PMC free article] [PubMed] [Google Scholar]
- Wang Y., He H., Li W., Phay J., Shen R., Yu L., Hancioglu B., De La Chapelle A. MYH9 binds to lncRNA gene PTCSC2 and regulates FOXE1 in the 9q22 thyroid cancer risk locus. Proc. Natl. Acad. Sci. USA. 2017;114:474–479. doi: 10.1073/pnas.1619917114. [DOI] [PMC free article] [PubMed] [Google Scholar]
- Weirauch M.T., Cote A., Norel R., Annala M., Zhao Y., Riley T.R., Saez-Rodriguez J., Cokelaer T., Vedenko A., Talukder S., DREAM5 Consortium Evaluation of methods for modeling transcription factor sequence specificity. Nat. Biotechnol. 2013;31:126–134. doi: 10.1038/nbt.2486. [DOI] [PMC free article] [PubMed] [Google Scholar]
- West J.A., Davis C.P., Sunwoo H., Simon M.D., Sadreyev R.I., Wang P.I., Tolstorukov M.Y., Kingston R.E. The long noncoding RNAs NEAT1 and MALAT1 bind active chromatin sites. Mol. Cell. 2014;55:791–802. doi: 10.1016/j.molcel.2014.07.012. [DOI] [PMC free article] [PubMed] [Google Scholar]
- Whitfield T.W., Wang J., Collins P.J., Partridge E.C., Aldred S.F., Trinklein N.D., Myers R.M., Weng Z. Functional analysis of transcription factor binding sites in human promoters. Genome Biol. 2012;13:R50. doi: 10.1186/gb-2012-13-9-r50. [DOI] [PMC free article] [PubMed] [Google Scholar]
- Xiao F., Zuo Z., Cai G., Kang S., Gao X., Li T. miRecords: an integrated resource for microRNA-target interactions. Nucleic Acids Res. 2009;37:D105–D110. doi: 10.1093/nar/gkn851. [DOI] [PMC free article] [PubMed] [Google Scholar]
- Yan X., Hu Z., Feng Y., Hu X., Yuan J., Zhao S.D., Zhang Y., Yang L., Shan W., He Q. Comprehensive genomic characterization of long non-coding RNAs across human cancers. Cancer Cell. 2015;28:529–540. doi: 10.1016/j.ccell.2015.09.006. [DOI] [PMC free article] [PubMed] [Google Scholar]
- Yoon J.-H., Abdelmohsen K., Srikantan S., Yang X., Martindale J.L., De S., Huarte M., Zhan M., Becker K.G., Gorospe M. LincRNA-p21 suppresses target mRNA translation. Mol. Cell. 2012;47:648–655. doi: 10.1016/j.molcel.2012.06.027. [DOI] [PMC free article] [PubMed] [Google Scholar]
- Zhang W., Liu H.T. MAPK signal pathways in the regulation of cell proliferation in mammalian cells. Cell Res. 2002;12:9–18. doi: 10.1038/sj.cr.7290105. [DOI] [PubMed] [Google Scholar]
- Zhang T., Tan P., Wang L., Jin N., Li Y., Zhang L., Yang H., Hu Z., Zhang L., Hu C. RNALocate: a resource for RNA subcellular localizations. Nucleic Acids Res. 2017;45:D135–D138. doi: 10.1093/nar/gkw728. [DOI] [PMC free article] [PubMed] [Google Scholar]
- Zhou X., Sumazin P., Rajbhandari P., Califano A. A systems biology approach to transcription factor binding site prediction. PLoS One. 2010;5:e9878. doi: 10.1371/journal.pone.0009878. [DOI] [PMC free article] [PubMed] [Google Scholar]
- Zou H., Hastie T. Regularization and variable selection via the elastic net (vol B 67, pg 301, 2005) J. R. Stat. Soc. Series B Stat. Methodol. 2005;67:768. [Google Scholar]
Associated Data
This section collects any data citations, data availability statements, or supplementary materials included in this article.