

Abstract
Amyotrophic lateral sclerosis (ALS) and Parkinson’s disease (PD) are devastating neurodegenerative diseases involving the progressive degeneration of neurons. No cure is available for patients diagnosed with these diseases. A prominent feature of both ALS and PD is the accumulation of protein inclusions in the cytoplasm of degenerating neurons; however, the particular proteins constituting these inclusions vary: the RNA-binding proteins TDP-43 and FUS are most notable in ALS, while α-synuclein aggregates into Lewy bodies in PD. In both diseases, genetic causes fail to explain the occurrence of a large proportion of cases, and thus, both are considered mostly sporadic. Despite mounting evidence for a possible role of epigenetics in the occurrence and progression of ALS and PD, epigenetic mechanisms in the context of these diseases remain mostly unexplored. Here we comprehensively delineate histone post-translational modification (PTM) profiles in ALS and PD yeast proteinopathy models. Remarkably, we find distinct changes in histone modification profiles for each. We detect the most striking changes in the context of FUS aggregation: changes in several histone marks support a global decrease in gene transcription. We also detect more modest changes in histone modifications in cells overexpressing TDP-43 or α-synuclein. Our results highlight a great need for the inclusion of epigenetic mechanisms in the study of neurodegeneration. We hope our work will pave the way for the discovery of more effective therapies to treat patients suffering from ALS, PD, and other neurodegenerative diseases.
Keywords: ALS, Parkinson’s disease, FUS, TDP-43, α-synuclein, epigenetics, histone modifications
Graphical Abstract
INTRODUCTION
Neurodegenerative diseases are devastating illnesses with few treatment options. Among these, amyotrophic lateral sclerosis (ALS) and Parkinson’s disease (PD) are characterized by the occurrence of protein inclusions leading to the premature demise of neurons. There is no definitively established cause or cure for either disease, and available treatments ultimately fail to stop their progression.1–4 For both ALS and PD, most cases occur in people with no known family history of the disease and have not been linked to a genetic cause; thus, these ailments are considered mostly sporadic. Only a relatively small proportion of ALS and PD cases are associated with genetic mutations, and within these cases a multitude of genes have been implicated.5,6 In ALS, mutations in TAR DNA binding protein 43 (TDP-43) and fused in sarcoma/translocated in liposarcoma (FUS) are known to lead to protein aggregation and formation of cytoplasmic inclusions in motor neurons, while α-synuclein aggregates to form Lewy bodies in dopaminergic neurons in PD.3,7–15 Remarkably, protein aggregation occurs in both familial and sporadic forms of ALS, as 97% of patients display TDP-43 inclusions regardless of whether they present mutations in this protein.16 It is thus far clear that genetic causes alone fail to explain the development of ALS and PD.5,6
Eukaryotic DNA is tightly packed around a complex network of proteins called chromatin.17 The organization of chromatin controls gene expression: euchromatin is loosely packed and easily transcribed, while heterochromatin is tightly packed and transcriptionally silent.18 Changes in the architecture of chromatin and the consequent changes in gene expression are sufficient to cause heritable phenotypic alterations. These alterations—occurring without changes in DNA sequence—are termed epigenetic. Epigenetic mechanisms involve mainly methylation of DNA and post-translational modification (PTM) of histone proteins.19
The basic unit of chromatin comprises approximately 146 base pairs of DNA wrapped around a protein core made up of an octamer of histone proteins comprising two H2A–H2B dimers and one H3 and H4 tetramer.20 Each histone protein has a long, protruding N-terminal tail that can be post-translationally modified with chemical moieties, including phosphorylation, acetylation, methylation, ubiquitination, and sumoylation. These modifications are installed on specific residues.18 The way in which these modifications are “read” by other proteins has led to the “histone code hypothesis”, which states that specific modifications can be read by “reader” proteins and recruit transcription or silencing factors, ultimately leading to repression or activation of transcription.21,22 Histone PTMs are dynamically added and removed; for instance, acetyl groups are added by histone acetyltransferases and removed by histone deacetylases (HDACs).17 Specific modifications can also affect how other amino acids in the same or another histone molecule are modified (as reviewed in ref 23). For example, phosphosphorylation of histone H3 on serine 10 (H3S10ph) blocks methylation of histone H3 on lysine 9.24 Conversely, H3S10ph increases acetylation of histone H4 on lysine 16 and creates a nucleosome platform that increases transcription.25
Is there a role for epigenetics in neurogenerative diseases? Recent evidence has linked ALS and PD to epigenetic mechanisms (as reviewed in refs 6, 26, and 27). To date, DNA methylation has been the dominant subject of research on epigenetics of neurodegenerative diseases. Nevertheless, there is evidence for the importance of histone modification in this context. For instance, overexpression of wild-type FUS induces hypoacetylation of histone H3 on a specific gene promoter.28 Moreover, the levels of HDAC1, HDAC2, and sirtuins (a family of class III HDACs) are impaired in post-mortem ALS tissues.29,30 Indeed, FUS itself has been shown to interact with HDAC1 to recruit the latter to sites of DNA damage.31 More recently, redistribution of wild-type or mutant FUS to the cytoplasm has been associated with a loss of function in protein arginine methyltransferase 1 (PRMT1), resulting in alterations in histone PTMs.32 PD models have also provided evidence that epigenetics and histone PTMs may play a role in that disease. For instance, SIRT2 inhibitors alleviate α-synuclein toxicity in vitro and in a Drosophila model.33 Mitochondrial dysfunction has also been observed in PD and is related to hypoacetylation of histone H3.34 Furthermore, α-synuclein itself binds to the promoter region of certain genes, blocking histone acetylation and leading to reduced transcription.35 Despite all of the evidence for an epigenetic component in ALS and PD, a comprehensive study of the histone modifications involved in these diseases has not been carried out to date.
Yeast is a useful model for studying neurodegenerative diseases because it preserves many neuronal cellular pathways and upon TDP-43, FUS, or α-synuclein overexpression it recapitulates proteinopathies and cytoplasmic foci seen in ALS and PD.36–40 In contrast to other ALS and PD model systems, yeast is inexpensive, expeditious, and easy to work with. In fact, yeast models have enabled the identification of ALS genetic risk factors.41 Interestingly, deletion of Set3—a member of a histone deacetylase complex, homologue to the human protein ASH1—suppresses the toxicity of TDP-43 inclusions in a yeast model.42 Furthermore, yeast models for other ALS-related proteinopathies have also identified chromatin proteins as modifiers of protein aggregation cytotoxicity.37 Here we exploit FUS, TDP-43, and α-synuclein yeast proteinopathy models to identify perturbations in histone PTM patterns by way of Western blotting using modification-specific antibodies. To the best of our knowledge, this is the first comprehensive characterization of histone PTMs in any ALS or PD models. Remarkably, we find distinct changes in histone modification profiles for each proteinopathy model. We show that FUS aggregation is associated with the most pronounced changes in several histone marks, including phosphorylation of histone H2B, phosphorylation and acetylation of histone H3, and histone H4 arginine dimethylation. Furthermore, we observe a global decrease in gene transcription in the context of FUS proteinopathy. We also identify more moderate histone PTM disturbances in cells overexpressing TDP-43 and α-synuclein. Small increases in the levels of histone acetylation on lysines 12 and 16 of histone H4 as well as a small decrease in the level of trimethylation on lysine 36 of histone H3 are apparent in the context of TDP-43 overexpression, while small changes in the levels of dimethylation on lysine 36 of histone H3 and a significant change in the phosphorylation of H2B accompany α-synuclein aggregation. Overall, our results highlight a great need for the inclusion of epigenetic mechanisms in the study of neurodegenerative diseases and the search for more effective treatments for these disorders.
RESULTS AND DISCUSSION
TDP-43, FUS, and α-Synuclein Proteinopathies Elicit Distinct Perturbations in the Histone PTM Landscape
Using modification-specific antibodies, we have delineated the global epigenetic makeup of TDP-43, FUS, and α-synuclein proteinopathies. To do this, we exploited well-established yeast models for ALS and PD.38,40,43,46 Previous investigations have found that these show cytoplasmic foci in 90% of cells in TDP-43 and FUS models and in 60% of cells for the α-synuclein model.47 Yeast were transformed with either a control vector or a vector expressing TDP-43, FUS, or α-synuclein. Spotting assays on inducing-selective media corroborated the growth of control cells and the cytotoxicity of TDP-43, FUS, and α-synuclein. In our experiments, FUS overexpression was the most toxic, followed by TDP-43 and α-synuclein overexpression, respectively (Supplementary Figure 1a,b). Galactose-induced protein expression was verified by Western blotting for all three constructs (Supplementary Figure 1c–e). In liquid culture, cytotoxic phenotypes are much less severe (Supplementary Figure 1f). After galactose induction, we harvested and lysed both control yeast and yeast overexpressing TDP-43, FUS, or α-synuclein. The time frame of cell harvest for histone modification analysis precedes the point of toxicity in liquid culture (Supplementary Figure 1f). Cell lysates were subjected to SDS-PAGE to separate histone proteins from all other proteins. We then probed for individual histone modifications using commercially available modification-specific antibodies. We selected immunoblotting methods because of their high sensitivity of detection for low-abundance proteins and modifications.48 In this work, we focused primarily on histones H3 and H4, as these histones are most pervasively modified.49 Furthermore, we included histone modifications involved in both transcriptional activation and repression. Altogether, we incorporated 24 histone modifications in our experiments. Individual histone modifications were quantitated by blot image analysis, normalized to the loading control, and compared with the control sample to obtain fold change measurements. Remarkably, we identified distinct histone PTM panoramas for each proteinopathy (Figure 1). To assess the statistical significance of observed changes, p values were used. Because of the large variations observed in some of the histone modifications, the p values provide a better representation of the observed PTM changes than the averages and were thus used to construct the heat map in Figure 1. Overall, we found that TDP-43 overexpression is associated with increases in several histone PTMs, while FUS overexpression is associated with highly significant decreases in histone modification levels. Aligning with its mild cytotoxicity, α-synuclein overexpression resulted in the least amount of changes (Figure 1). As a positive control illustrating the potential range of changes in histone modification levels, we treated wild-type cells with the DNA damage agent bleomycin, which induces both single-stranded and double-stranded DNA damage.50 We explored the levels of phosphor-ylation of histone H2A on serine 129, which is homologous to phosphorylation on S139 in humans and a notable histone modification occurring in response to a DNA double strand break.51,52 Bleomycin induces an ~2.5-fold increase in the phosphorylation of histone H2A on serine 129 (Supplementary Figure 2). In general, it is important to note that statistical significance does not correlate with the magnitude of the change in histone PTM levels. For instance, in the context of TDP-43 overexpression, changes in histone H3K36me3 levels are highly reproducible and thus significant statistically (Figure 1) but are very modest in magnitude (Figure 2c). Altogether, our results suggest that the observed epigenetic changes are specific to each individual proteinopathy and not associated with general protein aggregation toxicity pathways. Furthermore, we found that ALS and PD proteinopathies are connected to widespread changes in histone modifications throughout the genome that are detectable without the need for enrichment of any particular genomic regions.
Figure 1.
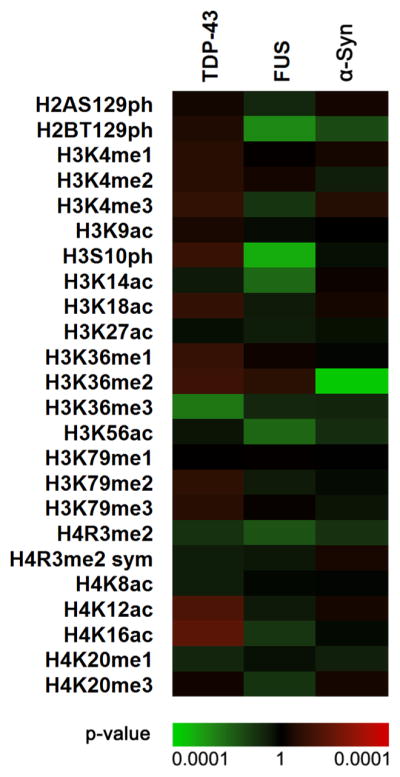
Histone modifications are altered in the context of yeast overexpressing TDP-43, FUS, and α-synuclein (α-Syn). Shown are p values for the ratios of histone H2A, H2B, H3, and H4 PTM abundances in yeast strains expressing TDP-43, FUS, and α-Syn relative to control cells. The scale is based on p values derived from statistical analysis of Western blotting experiments. The p values were calculated using a two-tailed t test with Welch’s modification. Green indicates more statistically significant decreased modification levels, while red indicates more statistically significant increased modification levels.
Figure 2.

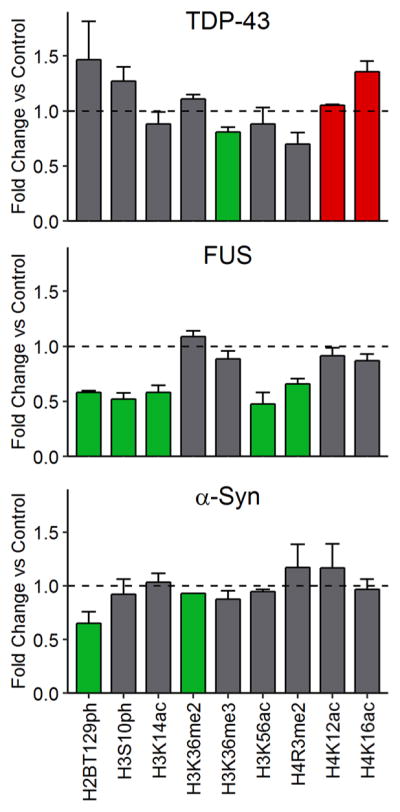
α-Synuclein and TDP-43 proteinopathy models display decreases in histone H3 di- and trimethylation, respectively, on lysine 36. Shown are representative immunoblots displaying the levels of (a, c) H3K36me2 and (b, d) H3K36me3 for TDP-43 and FUS and for α-synuclein yeast proteinopathy models, respectively. Quantitation histograms compiling multiple biological replicates are presented alongside the blots. All of the graphs display the mean fold change in modification levels for each group based on densitometric analysis of Western blots. Error bars indicate the +SEM (n = 3–7) for each modification. **, p < 0.01; ***, p < 0.001.
TDP-43 and α-Synuclein Overexpression Is Linked to Modest Decreases in Histone H3 Methylation on Lysine 36
To our surprise, many histone H3 methylation sites display similar modification levels in control cells and proteinopathy models. In particular, all degrees of methylation (me1, me2, and me3) on lysine 4 and lysine 79 showed no changes (Supplementary Figures 3 and 4b–d,f–h). We did not study methylation on lysine 9 because this modification is not present in budding yeast.53 We note no genome-level disturbances in the levels of H3K79me3, which along with H3K9me3, H3K27me3, and H4K20me3 has been implicated in particular genetic loci in other proteinopathies related to ALS.54 However, we found an exception in changes in the levels of di- and trimethylation of histone H3 on lysine 36. In yeast, H3K36 is methylated by the methyltransferase Set2, which can install up to three methyl groups on the lysine side chain.55 Interestingly, the human counterpart of Set2, SETD2, interacts with huntingtin protein, pointing to a potential role for this modification in neuro-degenerative disease.56 H3K36 methylation is involved in transcriptional elongation, suppressing histone exchange and hyperacetylation, and promoting maintenance of chromatin structure over coding regions in order to prevent aberrant transcriptional initiation within coding sequences.57 While the levels of H3K36me2 do not change in FUS and TDP-43 models (Figure 2a), the levels of this modification are slightly but consistently decreased in the context of α-synuclein over-expression (Figure 2b). Conversely, the levels of H3K36me3 are modestly decreased when TDP-43 is overexpressed (Figure 2c) but remained unchanged in the FUS and α-synuclein models (Figure 2c,d). The levels of monomethylation of H3K36 remained unchanged in all of the proteinopathy models (Supplementary Figure 4a,e).
FUS Overexpression Is Associated with Important Changes in the Phosphorylation and Acetylation of Histone H3
The most sizable changes in histone H3 PTMs levels occurred in the context of FUS overexpression. In particular, we detected a 50% decrease in the levels of phosphorylation of H3 on serine 10 (Figure 3a). This change in H3S10ph is unmatched in either TDP-43 or α-synuclein overexpression models (Figure 3a,d). H3S10ph is linked to both transcriptional activation and repression. Ipl1, the yeast homologue of the mammalian Aurora B kinase, is responsible for its installation.58 Highlighting its importance, this modification is remarkably conserved throughout the eukaryotic kingdom.59 The striking alteration in the levels of H3S10ph might point to an important role for Aurora B kinase in ALS etiology. Indeed, Aurora B kinase is able to phosphorylate ataxin-10, a key protein in spinocerebellar ataxia type 10, another neurodegenerative disorder.60 Unfortunately, we were unable to pinpoint whether decreases in H3S10ph arise from alterations in the levels of Ipl1 because antibodies for this protein are unavailable. To clarify whether the observed alterations in histone modifications are related to protein toxicity and/or expression levels, we lowered the toxic protein expression levels by growing cells on a combination of galactose and sucrose. Sucrose gets slowly metabolized to glucose, and glucose in turn represses the galactose promoter.61 First we verified that the sucrose/galactose setup reduced FUS expression (Supplementary Figure 5c). Unsurprisingly, decreased expression of FUS lessened the toxic phenotypes observed on solid and liquid media (Supplementary Figure 5a,b, respectively). Indeed, we find that lowering the level of FUS resulted in a decreased magnitude of change in the level of phosphorylation of histone H3 on serine 10 (Supplementary Figure 5d,e).
Figure 3.

FUS overexpression correlates with changes in phosphorylation on serine 10 and acetylation on lysine 14 and lysine 56 of histone H3. Shown are representative immunoblots displaying the levels of (a, d) H3S10ph, (b, e) H3K14ac, and (c, f) H3K56ac for TDP-43 and FUS and for α-synuclein yeast proteinopathy models, respectively. Quantitation histograms compiling multiple biological replicates are presented alongside the blots. All of the graphs display the mean fold change in modification levels for each group based on densitometric analysis of Western blots. Error bars indicate +SEM (n = 3–6) for each modification. **, p < 0.01; ***, p < 0.001.
FUS overexpression also resulted in hypoacetylation of H3 on lysine 14 (Figure 3b). We did not observe parallel acetylation changes in the TDP-43 or α-synuclein overexpression models (Figure 3b,e). Furthermore, we detected no alternations in the acetylation levels of histone H3 on lysine 9, lysine 18, or lysine 27 in any of our proteinopathy models (Supplementary Figure 6). Overexpression of wild-type FUS has been linked to hypoacetylation on both K9/K14 in the cyclin D1 gene promoter in human cells.28 However, as this investigation used an antibody that recognized K9/K14 acetylation in tandem, it is hard to compare our findings. Generally, hypoacetylation is correlated with tighter association between histones and DNA and the establishment of transcriptionally inactive heterochromatin.18,62,63 However, it is striking that we did not observe a general reduction in acetylation for all sites; rather FUS proteinopathy is associated with loss of acetylation at specific histone H3 sites. H3K14ac is involved in DNA damage checkpoint activation and DNA repair,64,65 and thus, lowered levels suggest that DNA repair is impaired in the FUS model. Furthering this hypothesis, H3K56ac—an acetylation site in the core domain of H3—is also significantly lowered in the FUS proteinopathy model (Figure 3c). This modification is required to reinstate chromatin structure over repaired DNA and is critical for signaling completion of repair.66 Akin to H3K14ac, we did not detect statistically significant changes in the levels of H3K56ac in the TDP-43 or α-synuclein overexpression models (Figure 3c,f).
Dimethylation of Histone H4 Is Decreased in the Context of FUS Overexpression
In conjunction with the changes in H3 modification outlined above, we also identified a decrease in the levels of dimethylation on arginine 3 of histone H4 in the FUS model (Figure 4a). This agrees with the observed hypoacetylation on H3K14, as H4R3me2 is associated with H3 acetylation at both lysine 9 and lysine 14.67 In yeast, Hmt1, the yeast homologue of PRMT1, catalyzes the formation of H4R3me2.68 PRMT1 is known to interact with and methylate FUS, affecting its cellular localization.69–73 Consistent with our findings, expression and mislocalization of wild-type or mutant human FUS in cultured murine motor neurons leads to nuclear depletion of PRMT1 and a consequent reduction in the levels of H4R3me2.32 It is possible that FUS sequesters Hmt1 and localizes to the cytoplasm, resulting in hypomethylation at this site. It is also conceivable that mislocalized protein sequesters other histone modifiers, resulting in the various changes in histone modification levels we detect. Moreover, H4R3me2 is associated with transcriptional activation.74 Together with lowered acetylation on H3K14 and H3K56, decreased H4R3me2 would suggest a decrease in gene transcription. We found no statistically significant changes in the level of H4R3me2 in TDP-43 or α-synuclein models (Figure 4a–b). Furthermore, we observed no alterations in any of the other histone H4 modifications studied in the FUS overexpression background, including symmetric dimethylation on R3 (Figure 4b,c and Supplementary Figure 7a–d).
Figure 4.

FUS and TDP-43 overexpression correlate with changes in arginine dimethylation and lysine acetylation of histone H4. Shown are representative immunoblots displaying the levels of (a, d) H4R3me2, (b, e) H4K12ac, and (c, f) H4K16ac for TDP-43 and FUS and for α-synuclein yeast proteinopathy models, respectively. Quantitation histograms compiling multiple biological replicates are presented alongside the blots. All of the graphs display the mean fold change in modification levels for each group based on densitometric analysis of Western blots. Error bars indicate +SEM (n = 3–6) for each modification. *, p < 0.05.
TDP-43 Overexpression Is Associated with Modest Increases in Histone H4 Acetylation
In contrast to the FUS model, we encountered modest hyperacetylation of histone H4 on lysine 12 and lysine 16 in the TDP-43 proteinopathy background (Figure 4b,c). Histone acetylation has long been correlated with transcriptional activation.75 In yeast, the specific removal of H4K16ac enables the formation of a heritably silent state,76 and thus, increases in this modification would suggest enhanced gene transcription in the TDP-43 background. Interestingly, increased levels of H4K12ac have been found in Alzheimer’s disease mouse models during early development of the disease.77 These changes in H4 acetylation are unique to TDP-43 overexpression and were not present in FUS or α-synuclein models (Figure 4b,c,e,f)
Phosphorylation of Histone H2B Is Decreased in Both FUS and α-Synuclein Proteinopathy Models
In both FUS and α-synuclein proteinopathy models, we discovered considerable hypophosphorylation of histone H2B on threonine 129 (Figure 5). Loss of phosphorylation at this site is associated with decreased gene expression as well as DNA damage.78,79 While this modification is not conserved in humans, we included it in our analysis because we anticipated that it could yield important information on the biological pathways linked to ALS and PD pathology. Cells overexpressing FUS show a 50% decrease in the level of H2BT129ph (Figure 5a). Changes in this modification fit together with changes in H3K14ac and H3K56ac (Figure 3b,c) and stress a role for DNA damage and repair in FUS proteinopathy. Furthermore, activation of poly(ADP-ribose) polymerase 1 (PARP-1) in response to DNA damage inhibits Aurora B kinase,80 and thus, changes in H3S10ph levels in the FUS model would also correspond to triggering of DNA damage signaling. Puzzlingly, we found no significant differences in the levels of phosphorylation of histone H2A on serine 129 in any of the proteinopathy models (Supplementary Figure 8). This raises the possibility that the combination of modifications observed in the FUS model does not occur in association with DNA damage but is instead related to other processes. It is plausible that the histone modifications we observe arise in association with unidentified defense mechanisms triggered by the protein aggregates.
Figure 5.

FUS and α-synuclein proteinopathies are associated with changes in histone H2B phosphorylation levels. Shown are representative immunoblots displaying the levels of H2BT129ph for (a) TDP-43 and FUS and (b) α-synuclein yeast proteinopathy models. Quantitation histograms compiling multiple biological replicates are presented alongside the blots. All of the graphs display the mean fold change in modification levels for each group based on densitometric analysis of Western blots. Error bars indicate +SEM (n ≥ 3) for each modification. *, p < 0.05; **, p < 0.01.
Unexpectedly, we also find profound differences in the levels of H2BT129ph in the α-synuclein overexpression background (Figure 5b). There is approximately a 40% decrease in the levels of this modification in the context of α-synuclein overexpression. By far, this is the most severe histone PTM alteration we detect for this model. This modification is associated with DNA damage in yeast.79 As other DNA damage and repair histone modification disturbances (i.e., H2AS129ph; Supplementary Figure 2) are absent in the α-synuclein proteinopathy background, this suggests that yet-undiscovered functions of H2BT129ph are likely. Such unknown functions could point to pathways that are important in the occurrence and progression of PD.
FUS Overexpression Is Associated with a Decrease in Total RNA Levels
Collectively, many of the histone PTM alterations observed in the FUS model point to decreased gene transcription. To further validate this hypothesis, we chose a straightforward approach in which we extracted and quantitated total RNA levels in each proteinopathy model and compared them with the control values. As we expected, total RNA levels were lower in the FUS overexpression background compared with the control (Figure 6a). Together with our histone modification data, we interpret this result to indicate that a global decrease in gene expression occurs in the FUS model. This finding agrees with previous investigations, which found that transcriptional activity is decreased in neurons presenting FUS mislocalization.32 Notably, we observed this effect despite protein overexpression. As FUS is an RNA-binding protein, it is possible that it sequesters RNA in protein aggregates. However, we did not observe a similar effect in the context of TDP-43 overexpression. TDP-43 is also a RNA-binding protein, and thus, if the change in RNA levels resulted from sequestration, then this effect should be present in the TDP-43 samples as well. We observed no significant differences in total RNA levels in cells overexpressing TDP-43 (Figure 6a) or cells overexpressing α-synuclein (Figure 6b). While the histone modification changes observed in the TDP-43 model (increases in histone H4 acetylation as well as H3K36me3) support transcriptional activation, it is possible that the increased gene transcription corresponds to specific genomic loci and thus would not be detected by changes in total RNA levels.
Figure 6.
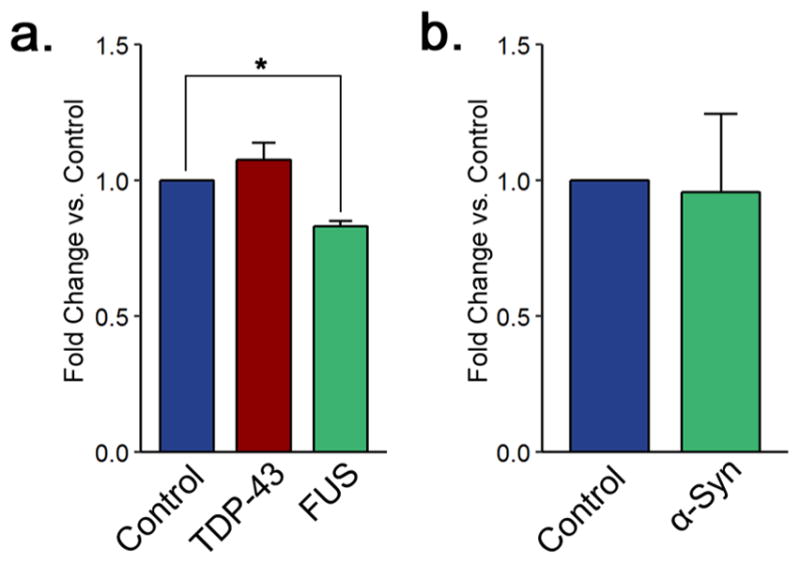
RNA levels are decreased in a FUS overexpression ALS model. (a) Total RNA levels in yeast control cells and cells overexpressing TDP-43 and FUS. (b) Total RNA levels in yeast control cells and cells overexpressing α-synuclein. All of the graphs display the mean fold change in total RNA levels for each group. Error bars indicate +SEM (n = 3) for each group. *, p < 0.05.
Distinct, Non-overlapping Histone PTM Landscapes for Each Proteinopathy Model Emphasize Histone Crosstalk
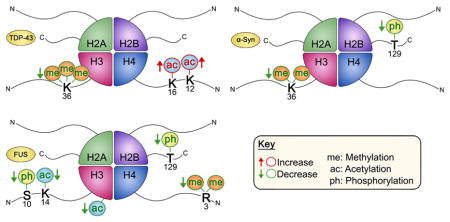
We present a summary of all of the observed histone PTM changes in Figure 7. Extraordinarily, we found very little overlap between the histone PTM alterations elicited in each proteinopathy model. Indeed, only H2BT129ph is altered in both the FUS and α-synuclein models. Overall, the most intense modification changes are associated with FUS proteinopathy, followed by TDP-43 and α-synuclein proteinopathies. Unsurprisingly, the number and magnitude of changes appear to correlate with the cytotoxicity of protein expression. Remarkably, overexpression of TDP-43 is the only one to correlate with increases in any modifications. Altogether, our data indicate that important decreases in histone phosphorylation and acetylation are associated with cytotoxic phenotypes.
Figure 7.
Yeast models of neurodegenerative disease proteinopathies are connected to distinct histone post-translational modification landscapes. Green bars indicate significant decreases and red bars significant increases relative to control samples. Error bars indicate +SEM (n ≥ 3) for each modification.
Our data also underscore histone crosstalk between modifications and provide hints regarding the mechanisms of PTM interaction. For instance, we observed decreases in both H3S10ph and H3K14ac in the FUS proteinopathy background (Figure 7). In yeast, H3S10ph promotes acetylation of H3K14 at specific gene promoters.81 Thus, it is not surprising to observe that these two modifications decrease in tandem. In the context of FUS overexpression, we also observe decreases in H2BT129ph (Figure 7). Ipl1—the yeast homologue of Aurora B kinase—is also able to phosphorylate H2B.82 Therefore, decreases in the phosphorylation of these two sites might be pointing at Ipl1 impairment in FUS proteinopathy. Lastly, we observed evidence for interhistone crosstalk, as we identified decreases in both H4R3me2 and H3K14ac (Figure 7). H4R3me2 has previously been linked to histone H3 acetylation on both lysine 9 and lysine 14.67 Other correlations present in our data could arise from yet-undiscovered crosstalk processes.
It is important to note that our data are limited to yeast models of ALS and PD, and thus, verification in other model systems is still lacking. Furthermore, it is difficult to establish causal relationships from our experiments: do changes in histone modifications lead to disease processes, or do disease processes lead to changes in histone modifications? Issues of causality are a struggle for the field of histone modifications at large.83 Nevertheless, we have established a clear association of strong decreases in histone phosphorylation and acetylation with the most severe cytotoxic phenotypes. Furthermore, changes in histone PTMs occur as early as 5 h into protein overexpression. Regardless of causation, histone modification pathways are highly accessible pharmacologically, and thus, they hold great promise for disease treatment.
Recent work has targeted several histone “writers” and “erasers” to ameliorate ALS and PD phenotypes. Notably, HDAC inhibitors have been used with success in mice ALS models.84 In ALS mice models, treatment with an HDAC inhibitor led to neuroprotection and improved motor function,85 while treatment with phenylbutyrate (a general HDAC inhibitor) significantly extended survival and improved clinical and neuropathological phenotypes.86 Our findings highlight further histone modifiers as potential targets for pharmaceutical intervention. In addition to reversing decreases in histone acetylation, novel chemical intervention strategies aimed at reversing decreases in histone phosphorylation and methylation could potentially improve cell survival in the context of neurodegenerative disease. On the basis of our results, inhibitors of protein phosphatase 1 and 2, which remove H3S10ph,59,87 as well as inhibitors of JMJD6, a Jumonji-domain-containing protein reported to demethylate H4R3me2,88 could become useful therapeutic avenues for ALS.
CONCLUSIONS
We have carried out the first comprehensive characterization of histone post-translational modifications in any ALS or PD models. Remarkably, we have discovered distinct changes in histone modification profiles for each proteinopathy model, evidencing that histone PTM changes are not associated with general protein aggregation toxicity pathways. Furthermore, we have found widespread changes detectable in whole-genome samples. We have shown that FUS aggregation is associated with many pronounced changes in several histone marks, including phosphorylation of histone H2B, lysine phosphorylation and acetylation of histone H3, and histone H4 arginine methylation. We have also observed a global decrease in gene transcription in the context of FUS proteinopathy. Furthermore, we have identified moderate disturbances in histone modification patterns in cells overexpressing TDP-43 and α-synuclein. Our data corroborate previous findings in different model systems while significantly broadening our knowledge of the epigenetic landscape of neurodegenerative diseases. The expanded set of modifications presented here could uncover novel histone “writer” and “eraser” targets for pharmacological intervention. Overall, our results underscore the potential importance of epigenetic mechanisms in the occurrence and progression of ALS, PD, and other neurodegenerative diseases and may lead to novel, more effective therapies for these ailments.
METHODS
Materials
All chemicals were purchased from Sigma-Aldrich (St. Louis, MO) unless otherwise specified.
Yeast Strains, Media, and Plasmids
All yeasts were W303a (MATa, can1–100, his3–11,15, leu2,3,112, trp1–1, ura3–1, ade2–1).39 Yeasts were grown in synthetic dropout medium (Clontech Laboratories, Mountain View, CA) supplemented with 2% glucose, raffinose, or galactose. Vectors encoding TDP-43, FUS, and α-synuclein (pAG303GAL-TDP-43, pAG303GAL-FUS, and pAG303GAL-α-synu-clein-GFP, respectively) were a gift from A. Gitler.36,40,43 A pAG303GAL-ccdB vector, which was used as a control, was a gift from Susan Lindquist (Addgene plasmid no. 14133).
Yeast Transformation, Spotting Assays, and Liquid Culture Growth Assay
Yeasts were transformed according to standard protocols using poly(ethylene glycol) and lithium acetate.44 For spotting assays, yeasts were grown to saturation overnight in raffinose-supplemented dropout medium at 30 °C. Cultures were diluted 2-fold, serially diluted 2-fold, and then spotted in duplicate onto synthetic dropout medium containing glucose, sucrose, galactose, or mixtures of sucrose and galactose. Plates were analyzed after growth for 2–3 days at 30 °C. For liquid culture growth assays, yeasts were grown in galactose-supplemented or sucrose/galactose-supplemented medium for 48 h at 30°C. Optical density measurements were taken every 24 h.
Bleomycin Treatment
Wild-type W303a yeasts were grown to saturation overnight at 30 °C on YPD medium (Dot Scientific, Burton, MI; cat. no. DSY20092-1000). Yeasts were standardized to an optical density of 0.3 and grown for 4 h at 30 °C. Cultures were then checked to verify log phase growth and treated with 20 μg/mL bleomycin (EMD Millipore, Billerica, MA; cat. no. 203401-10MG) for 1 h. After treatment, cultures were normalized to an optical density of 0.9; 10 mL aliquots of cells were then harvested and frozen at −80 °C.
Protein Overexpression
Protein overexpression in yeast was induced in galactose- or sucrose/galactose-containing medium for 5 h (TDP-43 and FUS) or 8 h (α-synuclein-GFP) at 30 °C. After induction, cultures were normalized to an optical density of 0.9; 10 mL aliquots of cells were then harvested and frozen at −80 °C.
Western Blotting
Frozen yeast cell pellets were thawed and treated with 0.2 M NaOH for 10 min on ice, pelleted again, and subsequently resuspended in 100 μL of 1× SDS sample buffer and boiled for 10 min. Cell lysates were separated using SDS-PAGE (15%) and then transferred to a PVDF membrane (EMD Millipore). Membranes were blocked using LI-COR blocking buffer (LI-COR Biosciences, Lincoln, NE) for 1 h at room temperature. Primary antibody incubations were performed at 4 °C overnight. Antibodies used were rabbit anti-GFP polyclonal (Sigma-Aldrich, cat. no. G1544), rabbit anti-TDP-43 polyclonal (Proteintech, Chicago, IL; cat. no. 10782-2-AP), rabbit anti-FUS polyclonal (Bethyl Laboratories, Montgomery, TX; cat. no. A300–302A), and mouse anti-3-phosphoglycerate kinase (PGK) monoclonal (Novex, Frederick, MD; cat. no. 459250). For histone modifications, all of the antibodies were purchased from Abcam (Cambridge, MA) unless otherwise specified: H3 (cat. no. ab24834), H3K4me1 (cat. no. ab8895), H3K4me2 (cat. no. ab7766), H3K4me3 (cat. no. ab8580), H3K9ac (cat. no. ab10812), H3K14ac (Millipore, cat. no. 07-353), H3K18ac (cat. no. ab1191), H3K27ac (cat. no. ab45173), H3K36me1 (cat. no. ab9048), H3K36me2 (cat. no. ab9049), H3K36me3 (cat. no. ab9050), H3K56ac (ActiveMotif, Carlsbad, CA; cat. no. 39281), H3K79me1 (Millipore, cat. no. ABE213), H3K79me2 (cat. no. ab3594), H3K79me3 (cat. no. ab2621), H3S10ph (cat. no. ab5176), H4 (cat. no. ab10158), H4K8ac (cat. no. ab15823), H4K12ac (cat. no. ab46983), H4K16ac (cat. no. ab109463), H4K20me1 (cat. no. ab9051), H4K20me3 (cat. no. ab9053), symmetric H4R3me2 (cat. no. ab5823), H4R3me2 (cat. no. ab194696), H2AS129ph (cat. no. ab15083), and H2BT129ph (cat. no. ab188292). Blots were processed using goat anti-mouse and anti-rabbit secondary antibodies from LI-COR Biosciences and imaged using an Odyssey Fc imaging system (LI-COR Biosciences). All of the immunoblotting experiments were repeated a minimum of three times with independent cell samples. As blots for TDP-43 and FUS were performed separately from blots for α-synuclein, these are shown separately throughout our results.
RNA Purification
Yeast were grown and induced in galactose-containing medium for 5 h (TDP-43 and FUS) or 8 h (α-synuclein-GFP). Cells (2 × 10⁷) were harvested for each sample and treated with 100 units of Zymolyase-20T (Nacalai USA, San Diego, CA; cat. no. 07663-91) for 30 min at 30 °C. RNA was isolated using the RNeasy Mini Kit from Qiagen (Germantown, MD) according to the manufacturer’s instructions. Total RNA levels were measured using a NanoDrop Lite spectrophotometer (Thermo Fisher Scientific, Waltham, MA). All experiments were repeated a minimum of three times with independent cell samples.
Data Analysis
Densitometric analysis of Western blots was performed using Image Studio (LI-COR Biosciences). The signals obtained for histone modifications were normalized to their respective total histone H3 signals (modification/total H3). These values were then compared with the control-sample values to obtain fold change values (sample/control), which were used for statistical analysis. A similar procedure was used to analyze Western blot data from sucrose experiments; the normalized signals were compared with the signals of the sucrose samples. RNA concentrations were normalized against controls to obtain fold change values, which were used for further analysis.
Statistical Analysis
Statistical analysis of data was performed in R 3.3.1 using the built-in stats package (R-Project, Vienna, Austria). Significant differences between sample groups (control vs TDP-43, control vs FUS, and control vs α-synuclein) were determined using Welch’s t test with p = 0.05 as the cutoff for significance. Error bars on the graphs represent the standard error of the mean (SEM) calculated from values obtained in the data analysis step described above. Figure 1 was constructed from these p values, which were transformed according to a previously described method using the equation −log(x) × y, where x represents the p value and y represents the sign of the test statistic.45 Western blot data from sucrose experiments were analyzed using one-way ANOVA followed by Tukey’s test for pairwise comparison of the group means.
Supplementary Material
Acknowledgments
Funding
Brooklyn College and the Advanced Science Research Center (CUNY) as well as an NIH NINDS Advanced Postdoctoral Career Transition Award (K22NS09131401) supported M.P.T.
We thank Prof. James Shorter and Prof. Aaron Gitler for kindly sharing reagents. We also thank Marcella Meykler, Farrah Benoit, Farzanna Mohamed, and Royena Tanaz for technical help.
Footnotes
Author Contributions
Conceived and designed the experiments: K.C., S.A.B., M.P.T. Performed the experiments: K.C., S.A.B., N.R., M.S., H.Y., S.T., N.M., S.M.M. Analyzed the data: K.C., S.A.B., N.R., M.S., H.Y., S.T., N.M., S.M.M., M.P.T. Contributed reagents/materials/analysis tools: K.C., S.A.B., M.P.T. Wrote the paper: K.C., S.A.B., M.P.T. All of the authors reviewed the manuscript.
Notes
The authors declare no competing financial interest.
The Supporting Information is available free of charge on the ACS Publications website at DOI:10.1021/acschemneur-o.7b00297.
Growth assays, overexpression verification, positive controls, expression tuning experiments, and representative immunoblots for unchanging histone modifications and their quantitation (Supplementary Figures 1–8) (PDF)
References
- 1.Beitz JM. Parkinson’s disease: a review. Front Biosci, Scholar Ed. 2014;S6:65–74. doi: 10.2741/s415. [DOI] [PubMed] [Google Scholar]
- 2.Kim HJ, Kim NC, Wang YD, Scarborough EA, Moore J, Diaz Z, MacLea KS, Freibaum B, Li S, Molliex A, Kanagaraj AP, Carter R, Boylan KB, Wojtas AM, Rademakers R, Pinkus JL, Greenberg SA, Trojanowski JQ, Traynor BJ, Smith BN, Topp S, Gkazi AS, Miller J, Shaw CE, Kottlors M, Kirschner J, Pestronk A, Li YR, Ford AF, Gitler AD, Benatar M, King OD, Kimonis VE, Ross ED, Weihl CC, Shorter J, Taylor JP. Mutations in prion-like domains in hnRNPA2B1 and hnRNPA1 cause multisystem proteinopathy and ALS. Nature. 2013;495:467–473. doi: 10.1038/nature11922. [DOI] [PMC free article] [PubMed] [Google Scholar]
- 3.Poewe W, Seppi K, Tanner CM, Halliday GM, Brundin P, Volkmann J, Schrag AE, Lang AE. Parkinson disease. Nature reviews Disease primers. 2017;3:17013. doi: 10.1038/nrdp.2017.13. [DOI] [PubMed] [Google Scholar]
- 4.Robberecht W, Philips T. The changing scene of amyotrophic lateral sclerosis. Nat Rev Neurosci. 2013;14:248–264. doi: 10.1038/nrn3430. [DOI] [PubMed] [Google Scholar]
- 5.Landgrave-Gomez J, Mercado-Gomez O, Guevara-Guzman R. Epigenetic mechanisms in neurological and neurodegenerative diseases. Front Cell Neurosci. 2015;9:58. doi: 10.3389/fncel.2015.00058. [DOI] [PMC free article] [PubMed] [Google Scholar]
- 6.Paez-Colasante X, Figueroa-Romero C, Sakowski SA, Goutman SA, Feldman EL. Amyotrophic lateral sclerosis: mechanisms and therapeutics in the epigenomic era. Nat Rev Neurol. 2015;11:266–279. doi: 10.1038/nrneurol.2015.57. [DOI] [PubMed] [Google Scholar]
- 7.Chen-Plotkin AS, Lee VMY, Trojanowski JQ. TAR DNA-binding protein 43 in neurodegenerative disease. Nat Rev Neurol. 2010;6:211–220. doi: 10.1038/nrneurol.2010.18. [DOI] [PMC free article] [PubMed] [Google Scholar]
- 8.Couthouis J, Hart MP, Shorter J, DeJesus-Hernandez M, Erion R, Oristano R, Liu AX, Ramos D, Jethava N, Hosangadi D, Epstein J, Chiang A, Diaz Z, Nakaya T, Ibrahim F, Kim HJ, Solski JA, Williams KL, Mojsilovic-Petrovic J, Ingre C, Boylan K, Graff-Radford NR, Dickson DW, Clay-Falcone D, Elman L, McCluskey L, Greene R, Kalb RG, Lee VM, Trojanowski JQ, Ludolph A, Robberecht W, Andersen PM, Nicholson GA, Blair IP, King OD, Bonini NM, Van Deerlin V, Rademakers R, Mourelatos Z, Gitler AD. A yeast functional screen predicts new candidate ALS disease genes. Proc Natl Acad Sci U S A. 2011;108:20881–20890. doi: 10.1073/pnas.1109434108. [DOI] [PMC free article] [PubMed] [Google Scholar]
- 9.Da Cruz S, Cleveland DW. Understanding the role of TDP-43 and FUS/TLS in ALS and beyond. Curr Opin Neurobiol. 2011;21:904–919. doi: 10.1016/j.conb.2011.05.029. [DOI] [PMC free article] [PubMed] [Google Scholar]
- 10.King OD, Gitler AD, Shorter J. The tip of the iceberg: RNA-binding proteins with prion-like domains in neuro-degenerative disease. Brain Res. 2012;1462:61–80. doi: 10.1016/j.brainres.2012.01.016. [DOI] [PMC free article] [PubMed] [Google Scholar]
- 11.Neumann M, Bentmann E, Dormann D, Jawaid A, DeJesus-Hernandez M, Ansorge O, Roeber S, Kretzschmar HA, Munoz DG, Kusaka H, Yokota O, Ang LC, Bilbao J, Rademakers R, Haass C, Mackenzie IRA. FET proteins TAF15 and EWS are selective markers that distinguish FTLD with FUS pathology from amyotrophic lateral sclerosis with FUS mutations. Brain. 2011;134:2595–2609. doi: 10.1093/brain/awr201. [DOI] [PMC free article] [PubMed] [Google Scholar]
- 12.Neumann M, Sampathu DM, Kwong LK, Truax AC, Micsenyi MC, Chou TT, Bruce J, Schuck T, Grossman M, Clark CM, McCluskey LF, Miller BL, Masliah E, Mackenzie IR, Feldman H, Feiden W, Kretzschmar HA, Trojanowski JQ, Lee VM. Ubiquitinated TDP-43 in frontotemporal lobar degeneration and amyotrophic lateral sclerosis. Science. 2006;314:130–133. doi: 10.1126/science.1134108. [DOI] [PubMed] [Google Scholar]
- 13.Baba M, Nakajo S, Tu PH, Tomita T, Nakaya K, Lee VM, Trojanowski JQ, Iwatsubo T. Aggregation of alpha-synuclein in Lewy bodies of sporadic Parkinson’s disease and dementia with Lewy bodies. Am J Pathol. 1998;152:879–884. [PMC free article] [PubMed] [Google Scholar]
- 14.Lotharius J, Brundin P. Pathogenesis of parkinson’s disease: dopamine, vesicles and [alpha]-synuclein. Nat Rev Neurosci. 2002;3:932. doi: 10.1038/nrn983. [DOI] [PubMed] [Google Scholar]
- 15.Spillantini MG, Schmidt ML, Lee VM, Trojanowski JQ, Jakes R, Goedert M. Alpha-synuclein in Lewy bodies. Nature. 1997;388:839–840. doi: 10.1038/42166. [DOI] [PubMed] [Google Scholar]
- 16.Scotter EL, Chen HJ, Shaw CE. TDP-43 Proteinopathy and ALS: Insights into Disease Mechanisms and Therapeutic Targets. Neurotherapeutics. 2015;12:352–363. doi: 10.1007/s13311-015-0338-x. [DOI] [PMC free article] [PubMed] [Google Scholar]
- 17.Grunstein M. Histone acetylation in chromatin structure and transcription. Nature. 1997;389:349. doi: 10.1038/38664. [DOI] [PubMed] [Google Scholar]
- 18.Mazzio EA, Soliman KF. Basic concepts of epigenetics: impact of environmental signals on gene expression. Epigenetics. 2012;7:119–130. doi: 10.4161/epi.7.2.18764. [DOI] [PMC free article] [PubMed] [Google Scholar]
- 19.Probst AV, Dunleavy E, Almouzni G. Epigenetic inheritance during the cell cycle. Nat Rev Mol Cell Biol. 2009;10:192–206. doi: 10.1038/nrm2640. [DOI] [PubMed] [Google Scholar]
- 20.Luger K, Mader AW, Richmond RK, Sargent DF, Richmond TJ. Crystal structure of the nucleosome core particle at 2.8 Å resolution. Nature. 1997;389:251–260. doi: 10.1038/38444. [DOI] [PubMed] [Google Scholar]
- 21.Garcia BA, Shabanowitz J, Hunt DF. Characterization of histones and their post-translational modifications by mass spectrometry. Curr Opin Chem Biol. 2007;11:66–73. doi: 10.1016/j.cbpa.2006.11.022. [DOI] [PubMed] [Google Scholar]
- 22.Strahl BD, Allis CD. The language of covalent histone modifications. Nature. 2000;403:41–45. doi: 10.1038/47412. [DOI] [PubMed] [Google Scholar]
- 23.Latham JA, Dent SY. Cross-regulation of histone modifications. Nat Struct Mol Biol. 2007;14:1017–1024. doi: 10.1038/nsmb1307. [DOI] [PubMed] [Google Scholar]
- 24.Fischle W, Tseng BS, Dormann HL, Ueberheide BM, Garcia BA, Shabanowitz J, Hunt DF, Funabiki H, Allis CD. Regulation of HP1-chromatin binding by histone H3 methylation and phosphorylation. Nature. 2005;438:1116–1122. doi: 10.1038/nature04219. [DOI] [PubMed] [Google Scholar]
- 25.Zippo A, Serafini R, Rocchigiani M, Pennacchini S, Krepelova A, Oliviero S. Histone crosstalk between H3S10ph and H4K16ac generates a histone code that mediates transcription elongation. Cell. 2009;138:1122–1136. doi: 10.1016/j.cell.2009.07.031. [DOI] [PubMed] [Google Scholar]
- 26.Belzil VV, Katzman RB, Petrucelli L. ALS and FTD: an epigenetic perspective. Acta Neuropathol. 2016;132:487–502. doi: 10.1007/s00401-016-1587-4. [DOI] [PMC free article] [PubMed] [Google Scholar]
- 27.Feng Y, Jankovic J, Wu YC. Epigenetic mechanisms in Parkinson’s disease. J Neurol Sci. 2015;349:3–9. doi: 10.1016/j.jns.2014.12.017. [DOI] [PubMed] [Google Scholar]
- 28.Wang X, Arai S, Song X, Reichart D, Du K, Pascual G, Tempst P, Rosenfeld MG, Glass CK, Kurokawa R. Induced ncRNAs allosterically modify RNA-binding proteins in cis to inhibit transcription. Nature. 2008;454:126–130. doi: 10.1038/nature06992. [DOI] [PMC free article] [PubMed] [Google Scholar]
- 29.Janssen C, Schmalbach S, Boeselt S, Sarlette A, Dengler R, Petri S. Differential histone deacetylase mRNA expression patterns in amyotrophic lateral sclerosis. J Neuropathol Exp Neurol. 2010;69:573–581. doi: 10.1097/NEN.0b013e3181ddd404. [DOI] [PubMed] [Google Scholar]
- 30.Korner S, Boselt S, Thau N, Rath KJ, Dengler R, Petri S. Differential sirtuin expression patterns in amyotrophic lateral sclerosis (ALS) postmortem tissue: neuroprotective or neurotoxic properties of sirtuins in ALS? Neurodegener Dis. 2013;11:141–152. doi: 10.1159/000338048. [DOI] [PubMed] [Google Scholar]
- 31.Wang WY, Pan L, Su SC, Quinn EJ, Sasaki M, Jimenez JC, Mackenzie IR, Huang EJ, Tsai LH. Interaction of FUS and HDAC1 regulates DNA damage response and repair in neurons. Nat Neurosci. 2013;16:1383–1391. doi: 10.1038/nn.3514. [DOI] [PMC free article] [PubMed] [Google Scholar]
- 32.Tibshirani M, Tradewell ML, Mattina KR, Minotti S, Yang W, Zhou H, Strong MJ, Hayward LJ, Durham HD. Cytoplasmic sequestration of FUS/TLS associated with ALS alters histone marks through loss of nuclear protein arginine methyltransferase 1. Hum Mol Genet. 2015;24:773–786. doi: 10.1093/hmg/ddu494. [DOI] [PMC free article] [PubMed] [Google Scholar]
- 33.Outeiro TF, Kontopoulos E, Altmann SM, Kufareva I, Strathearn KE, Amore AM, Volk CB, Maxwell MM, Rochet JC, McLean PJ, Young AB, Abagyan R, Feany MB, Hyman BT, Kazantsev AG. Sirtuin 2 inhibitors rescue alpha-synuclein-mediated toxicity in models of Parkinson’s disease. Science. 2007;317:516–519. doi: 10.1126/science.1143780. [DOI] [PubMed] [Google Scholar]
- 34.Siddiqui A, Chinta SJ, Mallajosyula JK, Rajagopolan S, Hanson I, Rane A, Melov S, Andersen JK. Selective binding of nuclear alpha-synuclein to the PGC1alpha promoter under conditions of oxidative stress may contribute to losses in mitochondrial function: Implications for Parkinson’s disease. Free Radical Biol Med. 2012;53:993–1003. doi: 10.1016/j.freeradbiomed.2012.05.024. [DOI] [PMC free article] [PubMed] [Google Scholar]
- 35.Harrison IF, Dexter DT. Epigenetic targeting of histone deacetylase: Therapeutic potential in Parkinson’s disease? Pharmacol Ther. 2013;140:34–52. doi: 10.1016/j.pharmthera.2013.05.010. [DOI] [PubMed] [Google Scholar]
- 36.Johnson BS, Snead D, Lee JJ, McCaffery JM, Shorter J, Gitler AD. TDP-43 is intrinsically aggregation-prone, and amyotrophic lateral sclerosis-linked mutations accelerate aggregation and increase toxicity. J Biol Chem. 2009;284:20329–20339. doi: 10.1074/jbc.M109.010264. [DOI] [PMC free article] [PubMed] [Google Scholar]
- 37.Jovicic A, Mertens J, Boeynaems S, Bogaert E, Chai N, Yamada SB, Paul JW, 3rd, Sun S, Herdy JR, Bieri G, Kramer NJ, Gage FH, Van Den Bosch L, Robberecht W, Gitler AD. Modifiers of C9orf72 dipeptide repeat toxicity connect nucleocytoplasmic transport defects to FTD/ALS. Nat Neurosci. 2015;18:1226–1229. doi: 10.1038/nn.4085. [DOI] [PMC free article] [PubMed] [Google Scholar]
- 38.Outeiro TF, Lindquist S. Yeast Cells Provide Insight into Alpha-Synuclein Biology and Pathobiology. Science. 2003;302:1772–1775. doi: 10.1126/science.1090439. [DOI] [PMC free article] [PubMed] [Google Scholar]
- 39.Sanchez Y, Lindquist SL. HSP104 required for induced thermotolerance. Science. 1990;248:1112–1115. doi: 10.1126/science.2188365. [DOI] [PubMed] [Google Scholar]
- 40.Sun Z, Diaz Z, Fang X, Hart MP, Chesi A, Shorter J, Gitler AD. Molecular determinants and genetic modifiers of aggregation and toxicity for the ALS disease protein FUS/TLS. PLoS Biol. 2011;9:e1000614. doi: 10.1371/journal.pbio.1000614. [DOI] [PMC free article] [PubMed] [Google Scholar]
- 41.Elden AC, Kim HJ, Hart MP, Chen-Plotkin AS, Johnson BS, Fang X, Armakola M, Geser F, Greene R, Lu MM, Padmanabhan A, Clay-Falcone D, McCluskey L, Elman L, Juhr D, Gruber PJ, Rub U, Auburger G, Trojanowski JQ, Lee VM, Van Deerlin VM, Bonini NM, Gitler AD. Ataxin-2 intermediate-length polyglutamine expansions are associated with increased risk for ALS. Nature. 2010;466:1069–1075. doi: 10.1038/nature09320. [DOI] [PMC free article] [PubMed] [Google Scholar]
- 42.Armakola M, Higgins MJ, Figley MD, Barmada SJ, Scarborough EA, Diaz Z, Fang X, Shorter J, Krogan NJ, Finkbeiner S, Farese RV, Gitler AD. Inhibition of RNA lariat debranching enzyme suppresses TDP-43 toxicity in ALS disease models. Nat Genet. 2012;44:1302–1309. doi: 10.1038/ng.2434. [DOI] [PMC free article] [PubMed] [Google Scholar]
- 43.Johnson BS, McCaffery JM, Lindquist S, Gitler AD. A yeast TDP-43 proteinopathy model: Exploring the molecular determinants of TDP-43 aggregation and cellular toxicity. Proc Natl Acad Sci U S A. 2008;105:6439–6444. doi: 10.1073/pnas.0802082105. [DOI] [PMC free article] [PubMed] [Google Scholar]
- 44.Gietz RD, Schiestl RH. High-efficiency yeast transformation using the LiAc/SS carrier DNA/PEG method. Nature protocols. 2007;2:31–34. doi: 10.1038/nprot.2007.13. [DOI] [PubMed] [Google Scholar]
- 45.Key M. A tutorial in displaying mass spectrometry-based proteomic data using heat maps. BMC Bioinf. 2012;13(Suppl 16):S10. doi: 10.1186/1471-2105-13-S16-S10. [DOI] [PMC free article] [PubMed] [Google Scholar]
- 46.Fushimi K, Long C, Jayaram N, Chen X, Li L, Wu JY. Expression of human FUS/TLS in yeast leads to protein aggregation and cytotoxicity, recapitulating key features of FUS proteinopathy. Protein Cell. 2011;2:141–149. doi: 10.1007/s13238-011-1014-5. [DOI] [PMC free article] [PubMed] [Google Scholar]
- 47.Jackrel ME, DeSantis ME, Martinez BA, Castellano LM, Stewart RM, Caldwell KA, Caldwell GA, Shorter J. Potentiated Hsp104 variants antagonize diverse proteotoxic misfolding events. Cell. 2014;156:170–182. doi: 10.1016/j.cell.2013.11.047. [DOI] [PMC free article] [PubMed] [Google Scholar]
- 48.Nature Methods Editors. Method of the Year 2012. Nat Methods. 2013;10:1. doi: 10.1038/nmeth.2329. [DOI] [PubMed] [Google Scholar]
- 49.Santos-Rosa H, Caldas C. Chromatin modifier enzymes, the histone code and cancer. Eur J Cancer. 2005;41:2381–2402. doi: 10.1016/j.ejca.2005.08.010. [DOI] [PubMed] [Google Scholar]
- 50.Chen J, Ghorai MK, Kenney G, Stubbe J. Mechanistic studies on bleomycin-mediated DNA damage: multiple binding modes can result in double-stranded DNA cleavage. Nucleic Acids Res. 2008;36:3781–3790. doi: 10.1093/nar/gkn302. [DOI] [PMC free article] [PubMed] [Google Scholar]
- 51.House NC, Koch MR, Freudenreich CH. Chromatin modifications and DNA repair: beyond double-strand breaks. Front Genet. 2014;5:296. doi: 10.3389/fgene.2014.00296. [DOI] [PMC free article] [PubMed] [Google Scholar]
- 52.Redon C, Pilch DR, Rogakou EP, Orr AH, Lowndes NF, Bonner WM. Yeast histone 2A serine 129 is essential for the efficient repair of checkpoint-blind DNA damage. EMBO Rep. 2003;4:678–684. doi: 10.1038/sj.embor.embor871. [DOI] [PMC free article] [PubMed] [Google Scholar]
- 53.Millar CB, Grunstein M. Genome-wide patterns of histone modifications in yeast. Nat Rev Mol Cell Biol. 2006;7:657–666. doi: 10.1038/nrm1986. [DOI] [PubMed] [Google Scholar]
- 54.Belzil VV, Bauer PO, Prudencio M, Gendron TF, Stetler CT, Yan IK, Pregent L, Daughrity L, Baker MC, Rademakers R, Boylan K, Patel TC, Dickson DW, Petrucelli L. Reduced C9orf72 gene expression in c9FTD/ALS is caused by histone trimethylation, an epigenetic event detectable in blood. Acta Neuropathol. 2013;126:895–905. doi: 10.1007/s00401-013-1199-1. [DOI] [PMC free article] [PubMed] [Google Scholar]
- 55.Strahl BD, Grant PA, Briggs SD, Sun ZW, Bone JR, Caldwell JA, Mollah S, Cook RG, Shabanowitz J, Hunt DF, Allis CD. Set2 is a nucleosomal histone H3-selective methyltransferase that mediates transcriptional repression. Mol Cell Biol. 2002;22:1298–1306. doi: 10.1128/mcb.22.5.1298-1306.2002. [DOI] [PMC free article] [PubMed] [Google Scholar]
- 56.Wagner EJ, Carpenter PB. Understanding the language of Lys36 methylation at histone H3. Nat Rev Mol Cell Biol. 2012;13:115–126. doi: 10.1038/nrm3274. [DOI] [PMC free article] [PubMed] [Google Scholar]
- 57.Venkatesh S, Workman JL. Set2 mediated H3 lysine 36 methylation: regulation of transcription elongation and implications in organismal development. Wiley Interdiscip Rev Dev Biol. 2013;2:685–700. doi: 10.1002/wdev.109. [DOI] [PMC free article] [PubMed] [Google Scholar]
- 58.Sawicka A, Seiser C. Histone H3 phosphorylation - a versatile chromatin modification for different occasions. Biochimie. 2012;94:2193–2201. doi: 10.1016/j.biochi.2012.04.018. [DOI] [PMC free article] [PubMed] [Google Scholar]
- 59.Nowak SJ, Pai CY, Corces VG. Protein Phosphatase 2A Activity Affects Histone H3 Phosphorylation and Transcription in Drosophila melanogaster. Mol Cell Biol. 2003;23:6129–6138. doi: 10.1128/MCB.23.17.6129-6138.2003. [DOI] [PMC free article] [PubMed] [Google Scholar]
- 60.Tian J, Tian C, Ding Y, Li Z, Geng Q, Xiahou Z, Wang J, Hou W, Liao J, Dong MQ, Xu X, Li J. Aurora B-dependent phosphorylation of Ataxin-10 promotes the interaction between Ataxin-10 and Plk1 in cytokinesis. Sci Rep. 2015;5:8360. doi: 10.1038/srep08360. [DOI] [PMC free article] [PubMed] [Google Scholar]
- 61.Flick JS, Johnston M. Two systems of glucose repression of the GAL1 promoter in Saccharomyces cerevisiae. Mol Cell Biol. 1990;10:4757–4769. doi: 10.1128/mcb.10.9.4757. [DOI] [PMC free article] [PubMed] [Google Scholar]
- 62.Cesarini E, D’Alfonso A, Camilloni G. H416 acetylation affects recombination and ncRNA at rDNA in Saccharomyces cerevisiae. Mol Biol Cell. 2012;23:2770–2781. doi: 10.1091/mbc.E12-02-0095. [DOI] [PMC free article] [PubMed] [Google Scholar]
- 63.Lo W, Duggan L, Emre NCT, Belotserkovskya R, Lane WS, Shiekhattar R, Berger SL. Snf1—a histone kinase that works in concert with the histone acetyltransferase Gcn5 to regulate transcription. Science. 2001;293:1142–1146. doi: 10.1126/science.1062322. [DOI] [PubMed] [Google Scholar]
- 64.Duan MR, Smerdon MJ. Histone H3 lysine 14 (H3K14) acetylation facilitates DNA repair in a positioned nucleosome by stabilizing the binding of the chromatin Remodeler RSC (Remodels Structure of Chromatin) J Biol Chem. 2014;289:8353–8363. doi: 10.1074/jbc.M113.540732. [DOI] [PMC free article] [PubMed] [Google Scholar]
- 65.Wang Y, Kallgren SP, Reddy BD, Kuntz K, Lopez-Maury L, Thompson J, Watt S, Ma C, Hou H, Shi Y, Yates JR, 3rd, Bahler J, O’Connell MJ, Jia S. Histone H3 lysine 14 acetylation is required for activation of a DNA damage checkpoint in fission yeast. J Biol Chem. 2012;287:4386–4393. doi: 10.1074/jbc.M111.329417. [DOI] [PMC free article] [PubMed] [Google Scholar]
- 66.Chen CC, Carson JJ, Feser J, Tamburini B, Zabaronick S, Linger J, Tyler JK. Acetylated lysine 56 on histone H3 drives chromatin assembly after repair and signals for the completion of repair. Cell. 2008;134:231–243. doi: 10.1016/j.cell.2008.06.035. [DOI] [PMC free article] [PubMed] [Google Scholar]
- 67.Huang S, Litt M, Felsenfeld G. Methylation of histone H4 by arginine methyltransferase PRMT1 is essential in vivo for many subsequent histone modifications. Genes Dev. 2005;19:1885–1893. doi: 10.1101/gad.1333905. [DOI] [PMC free article] [PubMed] [Google Scholar]
- 68.Gary JD, Lin WJ, Yang MC, Herschman HR, Clarke S. The predominant protein-arginine methyltransferase from Saccharomyces cerevisiae. J Biol Chem. 1996;271:12585–12594. doi: 10.1074/jbc.271.21.12585. [DOI] [PubMed] [Google Scholar]
- 69.Dormann D, Madl T, Valori CF, Bentmann E, Tahirovic S, Abou-Ajram C, Kremmer E, Ansorge O, Mackenzie IR, Neumann M, Haass C. Arginine methylation next to the PY-NLS modulates Transportin binding and nuclear import of FUS. EMBO J. 2012;31:4258–4275. doi: 10.1038/emboj.2012.261. [DOI] [PMC free article] [PubMed] [Google Scholar]
- 70.Du K, Arai S, Kawamura T, Matsushita A, Kurokawa R. TLS and PRMT1 synergistically coactivate transcription at the survivin promoter through TLS arginine methylation. Biochem Biophys Res Commun. 2011;404:991–996. doi: 10.1016/j.bbrc.2010.12.097. [DOI] [PubMed] [Google Scholar]
- 71.Scaramuzzino C, Monaghan J, Milioto C, Lanson NA, Jr, Maltare A, Aggarwal T, Casci I, Fackelmayer FO, Pennuto M, Pandey UB. Protein arginine methyltransferase 1 and 8 interact with FUS to modify its sub-cellular distribution and toxicity in vitro and in vivo. PLoS One. 2013;8:e61576. doi: 10.1371/journal.pone.0061576. [DOI] [PMC free article] [PubMed] [Google Scholar]
- 72.Tradewell ML, Yu Z, Tibshirani M, Boulanger MC, Durham HD, Richard S. Arginine methylation by PRMT1 regulates nuclear-cytoplasmic localization and toxicity of FUS/TLS harbouring ALS-linked mutations. Hum Mol Genet. 2012;21:136–149. doi: 10.1093/hmg/ddr448. [DOI] [PubMed] [Google Scholar]
- 73.Yamaguchi A, Kitajo K. The effect of PRMT1-mediated arginine methylation on the subcellular localization, stress granules, and detergent-insoluble aggregates of FUS/TLS. PLoS One. 2012;7:e49267. doi: 10.1371/journal.pone.0049267. [DOI] [PMC free article] [PubMed] [Google Scholar]
- 74.Di Lorenzo A, Bedford MT. Histone arginine methylation. FEBS Lett. 2011;585:2024–2031. doi: 10.1016/j.febslet.2010.11.010. [DOI] [PMC free article] [PubMed] [Google Scholar]
- 75.Peterson CL, Laniel MA. Histones and histone modifications. Curr Biol. 2004;14:R546–551. doi: 10.1016/j.cub.2004.07.007. [DOI] [PubMed] [Google Scholar]
- 76.Oppikofer M, Kueng S, Gasser SM. SIR-nucleosome interactions: structure-function relationships in yeast silent chromatin. Gene. 2013;527:10–25. doi: 10.1016/j.gene.2013.05.088. [DOI] [PubMed] [Google Scholar]
- 77.Plagg B, Ehrlich D, Kniewallner KM, Marksteiner J, Humpel C. Increased Acetylation of Histone H4 at Lysine 12 (H4K12) in Monocytes of Transgenic Alzheimer’s Mice and in Human Patients. Curr Alzheimer Res. 2015;12:752–760. doi: 10.2174/1567205012666150710114256. [DOI] [PMC free article] [PubMed] [Google Scholar]
- 78.Kyriss MN, Jin Y, Gallegos IJ, Sanford JA, Wyrick JJ. Novel functional residues in the core domain of histone H2B regulate yeast gene expression and silencing and affect the response to DNA damage. Mol Cell Biol. 2010;30:3503–3518. doi: 10.1128/MCB.00290-10. [DOI] [PMC free article] [PubMed] [Google Scholar]
- 79.Lee CS, Lee K, Legube G, Haber JE. Dynamics of yeast histone H2A and H2B phosphorylation in response to a double-strand break. Nat Struct Mol Biol. 2014;21:103–109. doi: 10.1038/nsmb.2737. [DOI] [PMC free article] [PubMed] [Google Scholar]
- 80.Monaco L, Kolthur-Seetharam U, Loury R, Murcia JM, de Murcia G, Sassone-Corsi P. Inhibition of Aurora-B kinase activity by poly(ADP-ribosyl)ation in response to DNA damage. Proc Natl Acad Sci U S A. 2005;102:14244–14248. doi: 10.1073/pnas.0506252102. [DOI] [PMC free article] [PubMed] [Google Scholar]
- 81.Lo WS, Trievel RC, Rojas JR, Duggan L, Hsu JY, Allis CD, Marmorstein R, Berger SL. Phosphorylation of serine 10 in histone H3 is functionally linked in vitro and in vivo to Gcn5-mediated acetylation at lysine 14. Mol Cell. 2000;5:917–926. doi: 10.1016/s1097-2765(00)80257-9. [DOI] [PubMed] [Google Scholar]
- 82.Hsu JY, Sun ZW, Li X, Reuben M, Tatchell K, Bishop DK, Grushcow JM, Brame CJ, Caldwell JA, Hunt DF, Lin R, Smith MM, Allis CD. Mitotic phosphorylation of histone H3 is governed by Ipl1/aurora kinase and Glc7/PP1 phosphatase in budding yeast and nematodes. Cell. 2000;102:279–291. doi: 10.1016/s0092-8674(00)00034-9. [DOI] [PubMed] [Google Scholar]
- 83.Henikoff S, Shilatifard A. Histone modification: cause or cog? Trends Genet. 2011;27:389–396. doi: 10.1016/j.tig.2011.06.006. [DOI] [PubMed] [Google Scholar]
- 84.Lazo-Gomez R, Ramirez-Jarquin UN, Tovar-y-Romo LB, Tapia R. Histone deacetylases and their role in motor neuron degeneration. Front Cell Neurosci. 2013;7:243. doi: 10.3389/fncel.2013.00243. [DOI] [PMC free article] [PubMed] [Google Scholar]
- 85.Corcoran LJ, Mitchison TJ, Liu Q. A novel action of histone deacetylase inhibitors in a protein aggresome disease model. Curr Biol. 2004;14:488–492. doi: 10.1016/j.cub.2004.03.003. [DOI] [PubMed] [Google Scholar]
- 86.Ryu H, Smith K, Camelo SI, Carreras I, Lee J, Iglesias AH, Dangond F, Cormier KA, Cudkowicz ME, Brown RH, Jr, Ferrante RJ. Sodium phenylbutyrate prolongs survival and regulates expression of anti-apoptotic genes in transgenic amyotrophic lateral sclerosis mice. J Neurochem. 2005;93:1087–1098. doi: 10.1111/j.1471-4159.2005.03077.x. [DOI] [PubMed] [Google Scholar]
- 87.Murnion ME, Adams RR, Callister DM, Allis CD, Earnshaw WC, Swedlow JR. Chromatin-associated protein phosphatase 1 regulates aurora-B and histone H3 phosphorylation. J Biol Chem. 2001;276:26656–26665. doi: 10.1074/jbc.M102288200. [DOI] [PubMed] [Google Scholar]
- 88.Chang B, Chen Y, Zhao Y, Bruick RK. JMJD6 is a histone arginine demethylase. Science. 2007;318:444–447. doi: 10.1126/science.1145801. [DOI] [PubMed] [Google Scholar]
Associated Data
This section collects any data citations, data availability statements, or supplementary materials included in this article.