Abstract
Continuous approaching and detaching displacement usually occurs in an adhesion test. Here, we found a transient adhesion force at the end of a non-fully detached contact. This force occurred when the nominal detaching displacement was less than the traditional quasi-static theory predicted zero force point. The transient adhesion force was ascribed to interfacial adhesion hysteresis, which was caused by the cracking process of the contact and the deformation competition between the sphere and supporting spring. Results indicated that the testing of adhesion can be significantly affected by different combinations of stiffnesses of the contact objects and the supporting spring cantilever. This combination should be carefully designed in an adhesion test. All these results enabled increased understanding of the nature of adhesion and can guide the design of adhesive actuators.
Introduction
Adhesion widely exists in nature and greatly affects the activities of humans, creatures, and machines. As an example of exceptional control of adhesion, geckos can use setae on their toes to reliably adhere to various walls and ceilings1. As an invented product, pressure sensitive adhesives have been widely used in medical treatment and the daily lives of people2. Therefore, the study of adhesion has long been an interest for both scientists and engineers. Various contact models have been developed to describe the relationship between the applied load, surface energy, and the elastic deformation in a sphere/sphere contact3–6. Hertz contact theory described the pure elastic deformation of a sphere under an external load3. Johnson–Kendall–Roberts (JKR) theory considered the internal surface force4. Dejaguin–Muller–Toporov (DMT) theory considered the energy of the non-contact adhesion forces acting surrounding the contact area5. The two theories were subsequently integrated into the Maugis–Dugdale (MD) theory to incorporate the two extreme situations of material with compliant large radius and rigid small radius6,7. Furthermore, for polymers, such as polydimethylsiloxane (PDMS) and polyurethane (PU), the adhesion was strongly related with the detaching velocity8. The crack propagation was also introduced into the detaching procedure to calculate the adhesion between viscoelastic solids9–12. In addition to the traditional researches on adhesion phenomena and theories3–6,13,14, many researchers studied high-performance biomimetic dry and wet adhesive surfaces15–22.
In a theoretical analysis of adhesion, the force-displacement relationship is one of the key factors needed to be disclosed23–34. In a typical adhesion test, the experiment was usually carried out as follows. One of the adhesion surfaces was usually fixed on a spring cantilever. First, the sphere was brought into contact with a rigid substrate and continuously loaded up to a pre-set value. After dwelling for a certain time, the sphere/plate contact was continuously separated. During the detaching, the repulsive force between the sphere and the plate gradually changed to be attractive and then suddenly dropped to zero after the maximum attractive force. The peak of attractive force (i.e., adhesion force) is usually used as the adhesive strength between the two surfaces.
A typical adhesion test analysis usually only considers the deformation of the sphere. However, in a real adhesion test, the loading is usually conducted via a cantilever, whose deformation is generally not discussed. In fact, in one former adhesion test between a gecko setal array and a glass slide, the stiffness of the cantilever in the adhesion test can significantly affect the tested adhesion force value; alternatively, no adhesion was tested35. In a detaching process, the adhesion force usually appears when the unloading displacement is near or over the nominal loading displacement. In this study, the unloading displacement was divided into two steps. A transient adhesion force was observed when the unloading displacement did not exceed the theoretical critical zero force point. The phenomenon was ascribed to the interfacial viscoelasticity of the contact and the deformation compatibility between the sphere and the cantilever. These results can provide additional insights on the comprehension of the tested adhesion, and can guide the selection of cantilever spring stiffness and a proper design of adhesion test procedure.
Methods and Materials
Adhesion test system
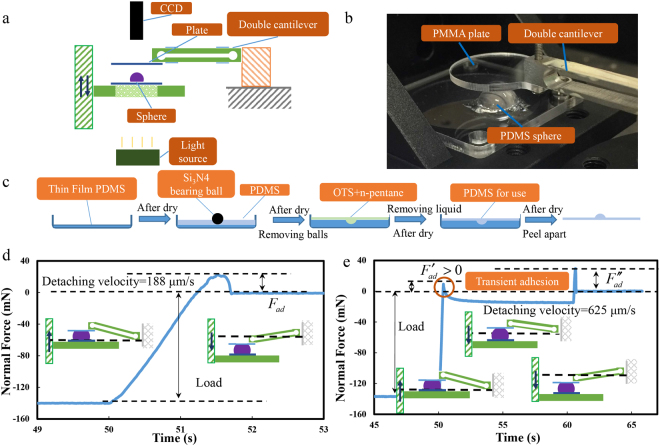
The adhesion test system was sketched in Fig. 1. A double-cantilever glued with strain gauges was used for measuring the normal forces (Fig. 1a,b). The strain gauge signal was processed by an amplifier (BSFY-1, Shijiazhuang Bufson Instrument Technology Co., Ltd.), and recorded at a frequency of 1000 Hz (USB-6002 data acquisition card, National Instrument Co., Ltd.). The movement of the lower plate (glued with a sphere) was driven by a one-dimensional linear stage (TSA30-C, Beijing Zolix Instruments Co., Ltd.) with a resolution of 0.6 μm, which was monitored with a linear encoder (KA-500, Guangdong Sino Grating Digital Display Co., Ltd.).
Figure 1.
Sketch of the adhesion test system and typical test curves. (a) Diagram of the test system; (b) Oblique view of the sphere/plate contact; (c) Manufacturing procedure of the PDMS sphere; (d) Typical force curve of an one-step detachment (a loading displacement L0 and detaching displacement L′0 > L0); (e) Typical force curve of a two-step detachment showing an transient adhesion, the first detaching L1 and the second detaching L2.
Sphere manufacturing
Smooth polymer spheres used in this study were made by reversely molding Si3N4 ceramic balls (diameter: 4.8 and 11.1 mm, respectively, precision level: G5, Ra = 0.014 μm, Shanghai Bujin Advanced Ceramics Co., Ltd.) with PDMS (Sylgard 184, Dow Corning Co., Ltd.) with weight ratios of component A to component B of 20:1, 10:1 and 5:1 (Fig. 1c). Samples were cured in an oven for 2 h at 65 °C. The plate used in the test was made from polymethylmethacrylate (PMMA, Ra = 3.58 nm). The plate was replaced by a new one after a serial of tests was finished. The experiment was carried out at room temperature and a humidity of 40%–60%.
Experiment procedure
In a one-step detachment (OSD), the sphere was loaded on the plate with a loading displacement L0 = 200 μm and the velocity of 625 μm /s. After 40 s, the sphere was fully separated at the set velocity. A typical result of OSD was shown in Fig. 1d. In a two-step detachment (TSD), the sphere was only separated part of the total loading displacement L1. Then, after 10 s, a detaching of the rest displacement L2 was conducted, thereby ensuring a full separation. A typical result of TSD was shown in Fig. 1e. The maximum attractive detaching force in OSD was marked as Fad. In TSD, the first detaching force peak was marked as F′ad and the second was F″ad. The force curve in OSD is different from that of TSD. The F′ad point in TSD was a sharp needle-like peak, whereas the Fad peak and F″ad peak were parabolic. The detaching velocity of the stage was discrete around the peak F′ad in TSD, leading to a needle-like force curve. A continuous separation in OSD resulted in a parabolic peak.
Determination of the contact radius
Before the experiments, the position of the camera (MQ013MG-ON, XIMEA GmbH) was fixed after the focusing. And the plane light source was placed in a proper position so that the edge of the contact radius can be obviously distinguished. The coordinates of the center of the contact area were recorded before the tests. The change of the contact area during the experiments was recorded by the camera with 500 frames per second. Then the video was converted into a series of pictures frame by frame. These pictures was processed in Halcon HDevelop (MVTec Software GmbH) to identify the difference of the gray level near the edge of the contact area to pick up the coordinates of the boundary point. The contact radius as a function of time was obtained by calculating the relative distance between the center and the boundary point.
Data availability statement
All the data of manuscript data is available.
Results and Discussions
Transient adhesion
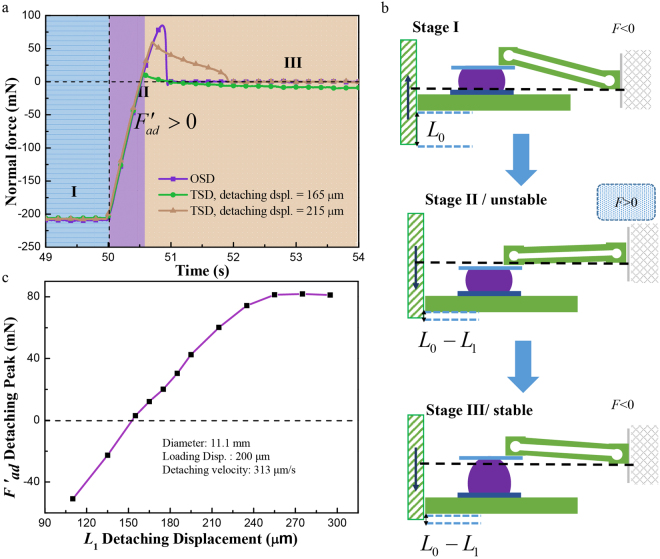
When the first detaching displacement was larger than a certain value, F′ad in the TSD curve was positive, indicating an adhesive force, as shown in Fig. 2a. Then the contact was relaxed and the force can be turned into negative and repulsive again. This adhesion, when the applied unloading displacement is obviously below the loading displacement, is called transient adhesion force in this study.
Figure 2.
Procedure of the first detaching peak in TSD. (a) Normal force vs. time curve of OSD and TSD for a sphere diameter of 11.1 mm, the detaching velocity of 313 μm/s, L0 = 200 μm, L1 = 165 or 215 μm; (b) Sketch of the deformation procedure around the transient adhesion force peak; (c) F′ad vs. detaching displacement for a sphere diameter of 11.1 mm, the detaching velocity of 313 μm/s and a loading displacement of 200 μm.
When the sphere was loaded in Stage I, the double-cantilever was bended upward to press the sphere, as shown in Fig. 2b. Then, the sphere was moved down as the plate (in blue) followed the moving in Stage II. The interfacial viscoelasticity of the contact hindered the crack propagation, and the normal force was positive and adhesive. The contact reached a stable state (Stage III) after some time, and the force was negative and repulsive again. As shown in Fig. 2c, F′ad increased with L1. After L1 reached the displacement where the max adhesion force was achieved, F′ad became saturated. F′ad for the experiment condition of the sphere with a radius 11.1 mm, the detaching velocity of 313 μm/s, L0 = 200 μm, became positive at the critical point L′1 = 155 μm. In fact, the first detachment is a cut-off in the full detachment, as shown in Fig. 2a. So the value of L′1, affected by the interfacial viscoelasticity of sphere-plate contact and the detaching velocity, is related to the zero-force point in the full detachment. Based on the diagram in Fig. 2b, the deformations in this adhesion measuring system should satisfy
| 1 |
where δ is the deformation displacement of the sphere and Δ1 is the deflection of the cantilever. However, the brown line in Fig. 2a indicated another detaching situation. In this situation, the detaching displacement (215 μm) was beyond the loading displacement, whereas the contact was not fully separated before the stop of the motion. The measured adhesion force was obviously smaller than that in OSD. The mechanism of this phenomenon is the same as that of the transient adhesion. Furthermore, this adhesion might be mistakenly taken as the fully-detached adhesion in a real adhesion test because the contact was fully broken after the relaxation, similar to that in OSD.
Effect of the elastic modulus
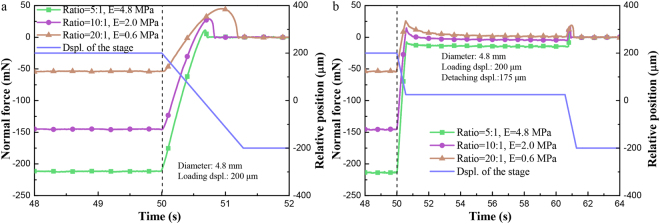
The effect of the elastic modulus on adhesion forces was experimentally studied. The PDMS sphere in A/B component ratio of 5:1 (E = 4.8 MPa) indicates the largest Young’s modulus compared with that in ratio 10:1 (E = 2.0 MPa) and 20:1 (E = 0.6 MPa). As shown in Fig. 3a, the sphere with a smaller Young’s modulus led to a larger F′ad. In fact, the tested adhesion force is the result of competition between the surface force and the elastic force. Thus with a smaller elastic force that results from a smaller Young’s modulus, the adhesion force increased, as shown in Fig. 3a. The similar result for TSD was shown in Fig. 3b that F′ad and F″ad followed the same trend.
Figure 3.
Force–time curves in OSD and TSD for PDMS sphere made of ratio 5:1, 10:1 and 20:1, respectively. (a) Curve in OSD, a loading displacement of 200 μm with different PDMS ratios (diameter D = 4.8 mm, detaching velocity v = 313 μm/s); (b) Curve in TSD, first detaching displacement of 175 μm and a loading displacement of 200 μm with different PDMS ratios (diameter D = 4.8 mm, detaching velocity v = 313 μm/s).
Effect of the cantilever stiffness
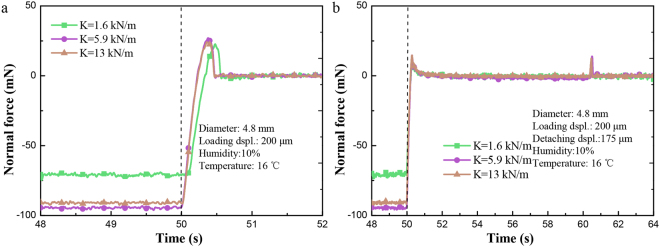
As the elastic modulus of the sphere had a great effect on the adhesion forces, the effect of the cantilever stiffness was also studied. As shown in Fig. 4, F′ad and Fad with a larger cantilever stiffness were slightly larger due to the comparably larger peeling velocity at the edge of the contact area. Besides, compared with the stiffer cantilever, it took less time to reach the adhesion peak for the softer one in OSD.
Figure 4.
Force–time curves in OSD and TSD for different cantilever stiffness of 1.6, 5.9, 13 kN/m, respectively, with the humidity of 10% and environment temperature of 16 degrees Celsius. (a) Curve in OSD and a loading displacement of 200 μm with different cantilever stiffness (diameter D = 4.8 mm, detaching velocity v = 625 μm/s); (b) Curve in TSD, first detaching displacement of 175 μm and a loading displacement of 200 μm with different cantilever stiffness (diameter D = 4.8 mm, detaching velocity v = 625 μm/s).
Effect of the detaching velocity
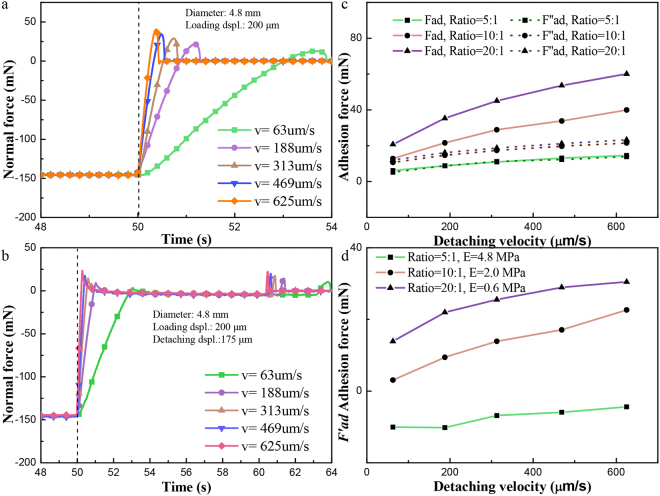
Experiments have also been conducted to research on the effects of detaching velocity. Results were shown in Fig. 5a and b. The adhesion force Fad and F″ad revealed a significant velocity effect and increased monotonously with the detaching velocity. The difference between Fad and F″ad in the same loading displacement and detaching velocity was not significant for the hardest sphere but were separated for the softer spheres, as shown in Fig. 5c. The change of F′ad agreed with the velocity effect well (Fig. 5d). Furthermore, Fad and F″ad for the spheres with a larger Young’s modulus changed less along the increasing of detaching velocity. F′ad also increased with the detaching velocity, as shown in Fig. 5d.
Figure 5.
Normal force vs. time in OSD and TSD with different detaching velocities. (a) curve in OSD, totally detaching and a loading displacement of 200 μm at different detaching velocities v (diameter D = 4.8 mm); (b) curve in TSD, first detaching displacement of 175 μm and a loading displacement of 200 μm with different detaching velocities v (diameter D = 4.8 mm).
We switched the positions of sphere and plate (i.e., the sphere was fixed and the plate moved) to eliminate system error. With the same material, sphere diameter, detaching velocity and experimental procedure, Fad, F′ad and F″ad showed little difference.
Theoretical analysis
By neglecting the viscoelasticity of sphere and the deflection of the plate (PMMA is stiffer), the adhesion measuring system used in our experiments can be simplified as two springs in series bounded, with a fixed spring constant k1 for the double-cantilever and a displacement-dependent equivalent spring constant k2 for the sphere, as illustrated in Fig. 6a. The pull force Fc, which equals the max adhesion force −Pc satisfies
| 2 |
where δc and Δ1c are the deformation displacement of sphere and deflection of the cantilever that correspond to the max adhesion force −Pc, respectively.
Figure 6.
The spring model of the adhesion measuring system.
Although the measured adhesion force Fc seems to be independent of the spring constant k1 based on Eq. (2), k1 can influence the shape of measured force-time curve36. The relationships between normal forces and displacements (or deflections) can be obtained by JKR model37 and Hooke’s law38, as follows:
| 3 |
where 1/K = (1 − v12)/E1 + (1 − v22)/E2, v and E is the Poisson’s ratio and Young’s modulus for the materials of the sphere and plate, respectively. The signs of Δ1, δ, L and F were determined via Fig. 6b. Based on Eq. (1), the total displacement of the plate LA from a loading displacement L to obtaining the max adhesion force can be calculated by
| 4 |
LA monotonically increases with the decreasing of k1. Given the same detaching velocity and loading displacement, more time is needed for attaining the max adhesion force for the cantilever with a smaller spring constant. The equivalent spring constant k2, determined by the elastic modulus of sphere, affects the measuring curve similarly. In Figs 3a and 4a, the sphere with a lower Young’s modulus or lower cantilever stiffness requires more time to reach the max adhesion force.
We have presented that the value of the F′ad in TSD may appear as a positive transient force. Theoretically, the value of transient adhesion in TSD sets on the JKR plot (OSD curve, in purple of Fig. 7a) where P = FN < 0 but P does not reach −Pc. Thus, this value can be estimated by using the modified JKR theory. Based on JKR theory, the normal force in OSD can be described as10,39
| 5 |
where E* = K, r0 is the radius of real contact area. γeff is different from the γ in JKR equation and represents the equivalent change of surface energy per contact area. γeff is strongly related with the crack velocity vr (i.e., the change velocity of contact radius) and temperature T. At the same temperature T, the relationship γeff ~ (vr)α has been obtained by researchers with α ≈ 0.69,11,40–42, which was used in our calculation.
Figure 7.
Calculation of the transient adhesion F′ad. (a) plot of P/Pc vs. δ/δc in Hertz (marked 1) and JKR theory (marked 2)37 (Permitted reprint from ‘Myshkin, N. K., Petrokovets, M. I. and Kovalev, A. V. Tribol. Internat. 38, 910–21 (2005)’); (b) The CCD camera image of the contact area; (c) change of contact radius for three types of situations (OSD and TSD with first detaching displacement = 110 and 175 μm), measuring force during the one-step detachment and numerical fitting force-time curve.
By analyzing pictures of contact zone (Fig. 7b), the differential of r0 to time (crack velocity vr) can be acquired from the r0 - t plot (Fig. 7c). Thus, we can use Eq. (5) to calculate F′ad. The fitting force-time curve in OSD was shown in Fig. 7c. The calculated results, for the PDMS sphere of diameter 11.1 mm with the detaching velocity of 313 μm/s and a loading displacement 200 μm, were shown in Table 1. The error between calculated Fcad (or F′cad) and measured Fad (or F′ad) is given as Δ = |(Fcad − Fad)/Fad| × 100% (or Δ = |(F′cad − F′ad)/F′ad| × 100%). Table 1 indicated that the calculation error was within an acceptable level. Contact radius at the transient peak in TSD (or the only peak in OSD) decreased as the increasing of the detaching displacement, also shown in Fig. 7c. A larger detaching displacement led to a higher loss of contact area along with the time.
Table 1.
F′ad (or Fad) and F′cad (or Fcad) for the PDMS sphere of diameter 11.1 mm with the detaching velocity of 313 μm/s and a loading displacement 200 μm.
| OSD | TSD | TSD | TSD | TSD | |
|---|---|---|---|---|---|
| Detaching Dspl. L1/μm | — | 100 | 130 | 190 | 220 |
| Measured Fad/mN | 85.5 | — | — | — | — |
| Measured F′ad/mN | — | −78.8 | −34.1 | 35.2 | 63.8 |
| Calculated Fcad or F′cad/mN | 91.0 | −80.0 | −36.5 | 39.0 | 63.7 |
| Error Δ/% | 6.4 | 1.5 | 7.0 | 10.8 | 0.2 |
| Radius at F′ad peak r/μm | 358.8 | 783.6 | 749.2 | 640.1 | 564.2 |
According to the analysis, this transient adhesion would be more likely to appear in the adhesion tests with soft materials such as some polymers (PDMS, PU and so on) and hydrogels where we may need to concern about the effect of deformation compatibility of the cantilever measuring system. The short of detaching displacement led to an incomplete detachment, caused a loss of adhesion (see the brown line shown in the Fig. 2a), where it also appeared to be fully detached at the end. Thus it has a meaning in general adhesion tests. Besides, for the instruments such as atomic force microscopy (AFM)43 and surface force apparatus (SFA)44, the selection of the cantilever significantly affects the measuring results. To measure forces at the micro/nanoscale (molecular45 and cell interaction43 forces) with AFM, the softer cantilevers should be selected for accurately measuring the tip-sample interaction. However, the mechanical instability of the cantilever would lead to a jump-to-contact in the approaching procedure when the force gradient becomes larger than the spring constant of the free cantilever45–47. This jump shortens the measuring distance; however, the stiffer cantilevers can eliminate this jump but sacrifice the sensitivity46. In the adhesion test of gecko setae, the adhesion force may not be detected if the spring constant is not properly chosen35. On the other hand, the transient adhesion intrinsically results from interfacial viscoelasticity, which also leads to the adhesion hysteresis47 (the difference between the work needed to separate two surfaces and that to bring them together) in adhesion tests. For the silicone elastomers, the entanglement between the dangling chains on the surface mainly contributes to this contact hysteresis48 that researchers chemically treated (hydrolyzed49 or extracted50) the PDMS surface to investigate the effect of this mechanism on the adhesion. Thus, the study of the transient adhesion aids in complementarily understanding the cantilever-compatibility problem and the adhesion hysteresis in the adhesion tests.
Conclusions
We found the transient adhesion in a non-full detachment of an adhesive contact. The detaching procedure is the compatibility among the sphere deformation, cantilever deflection, and stage movement. The origin of this transient adhesive force was ascribed to the recovery delay because of the crack propagation of the interface and the interfacial viscoelasticity of the contact. The transient adhesive force can be calculated by using a viscoelastic-modified JKR theory, and the fitting curve well agreed with the experimental one. These results disclosed that adhesion tests can be significantly affected by the stiffness of contact objects and the supporting spring cantilever, and that such tests should be carefully designed. All these results elucidated the nature of adhesion and can guide the design of adhesive tests and their applications.
Acknowledgements
This work was sponsored by the National Natural Science Foundation of China, Grant No. 51425502.
Author Contributions
Y.T. conceived the project. Z.L. performed the experiments. Z.L., H.L., Y.Z., D.T., Y.M., and Y.T. analyzed the data. Z.L. and Y.T. wrote the main manuscript text and prepared all the figures. All authors contributed to the discussion of the data and reviewed the manuscript.
Competing Interests
The authors declare no competing interests.
Footnotes
Publisher's note: Springer Nature remains neutral with regard to jurisdictional claims in published maps and institutional affiliations.
References
- 1.Autumn K, et al. Adhesive force of a single gecko foot-hair. Nature. 2000;405:681–685. doi: 10.1038/35015073. [DOI] [PubMed] [Google Scholar]
- 2.Bush, R. L. Bag seal utilizing pressure sensitive tape having weakened transverse zones. USA patent (1967).
- 3.Hertz H. On the contact of elastic solids. J. Reine Angew. Math. 1881;92:156–171. [Google Scholar]
- 4.Johnson KL, Kendall K, Roberts AD. Surface energy and the contact of elastic solids. Proc. Roy. Soc. A. 1971;324:301–313. doi: 10.1098/rspa.1971.0141. [DOI] [Google Scholar]
- 5.Derjaguin BV, Muller VM, Toporov YP. Effect of contact deformations on the adhesion of particles. J. Colloid Interface Sci. 1975;53:314–326. doi: 10.1016/0021-9797(75)90018-1. [DOI] [Google Scholar]
- 6.Maugis D. Adhesion of spheres: The JKR-DMT transition using a dugdale model. J. Colloid Interface Sci. 1992;150:243–269. doi: 10.1016/0021-9797(92)90285-T. [DOI] [Google Scholar]
- 7.Shi X, Zhao Y. Comparison of various adhesion contact theories and the influence of dimensionless load parameter. J. Adhes. Sci. Technol. 2004;18:55–68. doi: 10.1163/156856104322747009. [DOI] [Google Scholar]
- 8.Lamblet M, et al. Adhesion Enhancement through Micropatterning at Polydimethylsiloxane−Acrylic Adhesive Interfaces. Langmuir. 2007;23:6966–6974. doi: 10.1021/la063104h. [DOI] [PubMed] [Google Scholar]
- 9.Greenwood J, Johnson K. The mechanics of adhesion of viscoelastic solids. Philos. Mag. A. 1981;43:697–711. doi: 10.1080/01418618108240402. [DOI] [Google Scholar]
- 10.Persson BNJ, Albohr O, Heinrich G, Ueba H. Crack propagation in rubber-like materials. J. Phys.: Condens. Matter. 2005;17:R1071. [Google Scholar]
- 11.Maugis, D. & Barquins, M. In Adhesion and adsorption of polymers 203-277 (Springer US, 1980).
- 12.Yu H, Li Z, Jane Wang Q. Viscoelastic-adhesive contact modeling: Application to the characterization of the viscoelastic behavior of materials. Mech. Mater. 2013;60:55–65. doi: 10.1016/j.mechmat.2013.01.004. [DOI] [Google Scholar]
- 13.Yu Y, Sanchez D, Lu N. Work of adhesion/separation between soft elastomers of different mixing ratios. J. Mater. Res. 2015;30:2702–2712. doi: 10.1557/jmr.2015.242. [DOI] [Google Scholar]
- 14.Zhao Y. Stiction and anti-stiction in MEMS and NEMS. Act. Mec. Sin. 2003;19:1–10. doi: 10.1007/BF02487448. [DOI] [Google Scholar]
- 15.Zhou M, et al. Anisotropic interfacial friction of inclined multiwall carbon nanotube array surface. Carbon. 2012;50:5372–5379. doi: 10.1016/j.carbon.2012.07.017. [DOI] [Google Scholar]
- 16.Zhou M, et al. Controllable Interfacial Adhesion Applied to Transfer Light and Fragile Objects by Using Gecko Inspired Mushroom-Shaped Pillar Surface. ACS Appl. Mater. Interfaces. 2013;5:10137–10144. doi: 10.1021/am402815x. [DOI] [PubMed] [Google Scholar]
- 17.Kim S, Sitti M, Hui C-Y, Long R, Jagota A. Effect of backing layer thickness on adhesion of single-level elastomer fiber arrays. Appl. Phys. Lett. 2007;91:161905–161903. doi: 10.1063/1.2801371. [DOI] [Google Scholar]
- 18.Davies J, Haq S, Hawke T, Sargent J. A practical approach to the development of a synthetic Gecko tape. Int. J. Adhes. Adhes. 2009;29:380–390. doi: 10.1016/j.ijadhadh.2008.07.009. [DOI] [Google Scholar]
- 19.Murphy MP, Kim S, Sitti M. Enhanced Adhesion by Gecko-Inspired Hierarchical Fibrillar Adhesives. ACS Appl. Mater. Interfaces. 2009;1:849–855. doi: 10.1021/am8002439. [DOI] [PubMed] [Google Scholar]
- 20.Jeong HE, Lee J-K, Kim HN, Moon SH, Suh KY. A nontransferring dry adhesive with hierarchical polymer nanohairs. Proc. Natl. Acad. Sci. USA. 2009;106:5639–5644. doi: 10.1073/pnas.0900323106. [DOI] [PMC free article] [PubMed] [Google Scholar]
- 21.Asbeck, A. et al. In IEEE International Conference on Robotics and Automation (ICRA). 2675-2680 (IEEE).
- 22.Lee H, Scherer NF, Messersmith PB. Single-molecule mechanics of mussel adhesion. Proc. Natl. Acad. Sci. USA. 2006;103:12999–13003. doi: 10.1073/pnas.0605552103. [DOI] [PMC free article] [PubMed] [Google Scholar]
- 23.Shull KR. Contact mechanics and the adhesion of soft solids. Mater. Sci. Eng. R: Rep. 2002;36:1–45. doi: 10.1016/S0927-796X(01)00039-0. [DOI] [Google Scholar]
- 24.Hui C-Y, Baney J, Kramer E. Contact mechanics and adhesion of viscoelastic spheres. Langmuir. 1998;14:6570–6578. doi: 10.1021/la980273w. [DOI] [Google Scholar]
- 25.Heim L-O, Blum J, Preuss M, Butt H-J. Adhesion and friction forces between spherical micrometer-sized particles. Phys. Rev. Lett. 1999;83:3328. doi: 10.1103/PhysRevLett.83.3328. [DOI] [Google Scholar]
- 26.Ziskind G, Fichman M, Gutfinger C. Adhesion moment model for estimating particle detachment from a surface. J. Aerosol Sci. 1997;28:623–634. doi: 10.1016/S0021-8502(96)00460-0. [DOI] [Google Scholar]
- 27.Crosby AJ, Shull KR, Lakrout H, Creton C. Deformation and failure modes of adhesively bonded elastic layers. J. Appl. Phys. 2000;88:2956–2966. doi: 10.1063/1.1288017. [DOI] [Google Scholar]
- 28.Creton C, Lakrout H. Micromechanics of flat-probe adhesion tests of soft viscoelastic polymer films. J. Polym. Sci. Part B: Polym. Phys. 2000;38:965–979. doi: 10.1002/(SICI)1099-0488(20000401)38:7<965::AID-POLB7>3.0.CO;2-8. [DOI] [Google Scholar]
- 29.Haiat G, Huy MP, Barthel E. The adhesive contact of viscoelastic spheres. J. Mech. Phys. Solids. 2003;51:69–99. doi: 10.1016/S0022-5096(02)00059-5. [DOI] [Google Scholar]
- 30.Josse G, Sergot P, Creton C, Dorget M. Measuring interfacial adhesion between a soft viscoelastic layer and a rigid surface using a probe method. J. Adhes. 2004;80:87–118. doi: 10.1080/00218460490276821. [DOI] [Google Scholar]
- 31.Cohen D, Kligerman Y, Etsion I. A model for contact and static friction of nominally flat rough surfaces under full stick contact condition. J. Tribol. 2008;130:031401. doi: 10.1115/1.2908925. [DOI] [Google Scholar]
- 32.Barthel E. Adhesive elastic contacts: JKR and more. J. Phys. D: Appl. Phys. 2008;41:163001. doi: 10.1088/0022-3727/41/16/163001. [DOI] [Google Scholar]
- 33.Kendall K. The adhesion and surface energy of elastic solids. J. Phys. D: Appl. Phys. 1971;4:1186. doi: 10.1088/0022-3727/4/8/320. [DOI] [Google Scholar]
- 34.Lin YY, Hui CY, Baney JM. Viscoelastic contract, work of adhesion and the JKR technique. J. Phys. D: Appl. Phys. 1999;32:2250. doi: 10.1088/0022-3727/32/17/316. [DOI] [Google Scholar]
- 35.Tian, Y., Wan, J., Pesika, N. & Zhou, M. Bridging nanocontacts to macroscale gecko adhesion by sliding soft lamellar skin supported setal array. Sci. Rep. 3 (2013). [DOI] [PMC free article] [PubMed]
- 36.Fuqian Y. Load–displacement relation in adhesion measurement. J. Phys. D: Appl. Phys. 2003;36:2417. doi: 10.1088/0022-3727/36/19/016. [DOI] [Google Scholar]
- 37.Myshkin NK, Petrokovets MI, Kovalev AV. Tribology of polymers: Adhesion, friction, wear, and mass-transfer. Tribol. Internat. 2005;38:910–921. doi: 10.1016/j.triboint.2005.07.016. [DOI] [Google Scholar]
- 38.Sokolnikoff, I. S. Mathematical Theory of Elasticity. (MCGRAW-HILL, 1956).
- 39.Johnson, K. L. Contact mechanics. (Cambridge university press, 1987).
- 40.Andrews E, Kinloch A. Mechanics of adhesive failure. II. Proc. Roy. Soc. A. 1973;332:401–414. doi: 10.1098/rspa.1973.0033. [DOI] [Google Scholar]
- 41.Roberts AD, Thomas AG. The adhesion and friction of smooth rubber surfaces. Wear. 1975;33:45–64. doi: 10.1016/0043-1648(75)90223-9. [DOI] [Google Scholar]
- 42.Lorenz B, et al. Adhesion: role of bulk viscoelasticity and surface roughness. J. Phys.: Condens. Matter. 2013;25:225004. doi: 10.1088/0953-8984/25/22/225004. [DOI] [PubMed] [Google Scholar]
- 43.Puech P-H, Poole K, Knebel D, Muller DJ. A new technical approach to quantify cell–cell adhesion forces by AFM. Ultramicroscopy. 2006;106:637–644. doi: 10.1016/j.ultramic.2005.08.003. [DOI] [PubMed] [Google Scholar]
- 44.Israelachvili J, et al. Recent advances in the surface forces apparatus (SFA) technique. Rep. Prog. Phys. 2010;73:036601. doi: 10.1088/0034-4885/73/3/036601. [DOI] [Google Scholar]
- 45.Thomas RC, Houston J, Crooks RM, Kim T, Michalske TA. Probing adhesion forces at the molecular scale. J. Am. Chem. Soc. 1995;117:3830–3834. doi: 10.1021/ja00118a019. [DOI] [Google Scholar]
- 46.Gotsmann B, Seidel C, Anczykowski B, Fuchs H. Conservative and dissipative tip-sample interaction forces probed with dynamic AFM. Phys. Rev. B. 1999;60:11051. doi: 10.1103/PhysRevB.60.11051. [DOI] [Google Scholar]
- 47.Szoszkiewicz R, Bhushan B, Huey B, Kulik A, Gremaud G. Correlations between adhesion hysteresis and friction at molecular scales. J. Chem. Phys. 2005;122:144708. doi: 10.1063/1.1886751. [DOI] [PubMed] [Google Scholar]
- 48.Amouroux N, Léger L. Effect of dangling chains on adhesion hysteresis of silicone elastomers, probed by JKR test. Langmuir. 2003;19:1396–1401. doi: 10.1021/la020680e. [DOI] [Google Scholar]
- 49.Perutz S, Kramer E, Baney J, Hui C-Y. Adhesion between hydrolyzed surfaces of poly (dimethylsiloxane) networks. Macromolecules. 1997;30:7964–7969. doi: 10.1021/ma970063a. [DOI] [Google Scholar]
- 50.Choi GY, Kim S, Ulman A. Adhesion hysteresis studies of extracted poly (dimethylsiloxane) using contact mechanics. Langmuir. 1997;13:6333–6338. doi: 10.1021/la970525d. [DOI] [Google Scholar]
Associated Data
This section collects any data citations, data availability statements, or supplementary materials included in this article.
Data Availability Statement
All the data of manuscript data is available.


