

Abstract
Several low-volume inlets (flow rates ≤16.7 liters per minute (Lpm)) are commercially available as components of low-cost, portable ambient particulate matter samplers. Because the inlets themselves do not contain internal fractionators, they are often assumed to representatively sample “total” mass concentrations from the ambient air, independent of aerodynamic particle size and wind speed. To date, none of these so-called “TSP” inlets have been rigorously tested under controlled conditions. To determine their actual size-selective performance under conditions of expected use, wind tunnel tests of six commonly used omnidirectional, low-volume inlets were conducted using solid, polydisperse aerosols at wind speeds of 2, 8, and 24 km/hr. With the exception of axially-oriented, isokinetic sharp-edge nozzles operating at 5 and 10 Lpm, all low-volume inlets showed some degree of non-ideal sampling performance as a function of aerodynamic particle size and wind speed. Depending upon wind speed and assumed ambient particle size distribution, total mass concentration measurements were estimated to be negatively biased by as much as 66%. As expected from particle inertial considerations, inlet efficiency tended to degrade with increasing wind speed and particle size, although some exceptions were noted. The implications of each inlet’s non-ideal behavior are discussed with regards to expected total mass concentration measurement during ambient sampling and the ability to obtain representative sampling for size ranges of interest, such as PM2.5 and PM10. Overall test results will aid in low-volume inlet selection and with proper interpretation of results obtained with their ambient field use.
Introduction
Ambient samples of particulate matter (PM) are routinely collected for purposes of determining their mass concentrations and chemical constituents, assessing health effects associated with their exposure, determining the effectiveness of PM control strategies, and for determining compliance with regulatory standards designed to protect public health (Dockery et al. 1993, Chow 1995, McMurray 1999, Wilson et al. 2002). Critical to the accurate collection and characterization of ambient PM is the ability of the sampler’s inlet to representatively obtain ambient aerosol samples independent of aerodynamic particle size, wind speed, and wind direction. Ideally, the sampler’s inlet would sample all particles of interest with 100% efficiency independent of sampling conditions, while minimizing the inadvertent intrusion of insects, rain, snow, and other airborne debris. Further, particles aspirated by the inlet would ideally be transported without loss to the sampler’s internal fractionator (if any) and to its collection/sensing zone.
With the exception of isoaxially oriented, isokinetic samplers (whose inherent design is impractical to implement into routine field monitoring), all sampling inlets display some degree of measurement bias particularly with regard to their ability to effectively sample large airborne particles at high ambient wind speeds (Durham and Lundgren 1980, Liu and Pui 1981). As a result, a “total” suspended particulate sampler cannot be realistically achieved for all ambient size distributions and wind conditions. For example, the actual size-selective performance of the high-volume TSP sampler specified by the U.S. Environmental Protection Agency (EPA) for ambient Pb compliance testing (U.S. EPA 1987) has long been recognized to depend upon wind direction, wind speed, and aerodynamic particle size (Wedding et al. 1977, McFarland et al. 1980, Krug et al. 2017). This variability in sampling performance is despite the sampler’s high sampling flow rate (1100 Lpm to 1950 Lpm), the large geometries of the sampler’s inlet, and the fact that its upward suction velocity is designed to approximately match the settling velocity of a 100 μm aerodynamic diameter particle.
The successful development of efficient low-volume inlets has long been a goal in ambient aerosol sampling (Chow 1995). Low-volume samplers are relatively inexpensive, have a small footprint, are lightweight and portable, and often do not require line power for operation. These features lend themselves to supporting special studies to “saturate” an area of interest with multiple low-volume samplers for purposes of determining spatial aerosol distributions, optimizing compliance monitoring siting, and conducting spatial PM exposure studies (Baldauf et al. 2001). Moreover, these low-volume samplers employ smaller filters (47 mm diameter or less) than do high-volume samplers, thus making the filters more directly compatible with modern microbalances and sensitive analytical techniques for chemical and elemental analysis. However, due to the appreciable inertia of large airborne particles at elevated wind speeds, biases in efficient sampling may be unacceptably high when low sampling flow rates are used in conjunction with the small inlet geometries that are typically associated with low-volume samplers.
In theory, low-volume samplers could be designed and evaluated solely from numerical modeling of fluid streamlines and the predicted behavior of airborne particles within those streamlines. In reality, the complex interaction of ambient wind speed, wind direction, and turbulence levels with an inlet’s complicated geometry typically results in uncertain predictions of a sampler’s ability to extract representative aerosols from ambient airstreams (Liu and Pui 1981). Moreover, it is often difficult to fully account for particle loss mechanisms of particle settling, inertial deposition, diffusion, and electrostatic effects inside the sampler itself as a function of location and particle size. These loss mechanisms are also often a function of the local properties of both the loss surface and of the aspirated particles, and are thus difficult to accurately predict (Kenny et al. 2005). In practice, therefore, the development of low-volume inlets has historically been based on a qualitative understanding of inlet performance. Unfortunately, these qualitative considerations often result in the fabrication and use of inlets whose performance is not subsequently verified in the laboratory under controlled conditions. As a result, use of the inlet and its resulting measurement data may result in inaccurate observations and decisions regarding the PM concentrations under consideration and the intended purpose of the data.
The goal of this study was to review the design and operational characteristics of several commonly used “TSP” low-volume inlets, and summarize published literature regarding their laboratory and/or field use. Comprehensive wind tunnel tests of each these omnidirectional inlets were then conducted at wind speeds of 2, 8, and 24 km/hr to determine their actual size-selective sampling characteristics as a function of wind speed. In some cases, inlets were evaluated as a function of multiple operating flow rates and different inlet materials. Implications regarding these empirical test results will be discussed regarding potential selection of these inlets, interpretation of PM field data collected with their use, and their potential as inlets for candidate reference method samplers for PM.
Description of Low-Volume Inlets
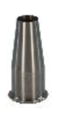
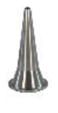
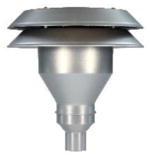
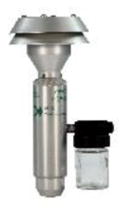
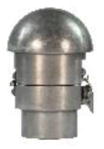
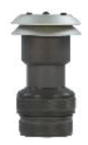
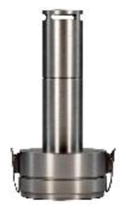
Following a survey of widely used and commercially available low-volume TSP samplers, six omni-directional inlet designs from five separate manufacturers were selected for wind tunnel evaluation as a function of aerodynamic particle size and wind speed. All inlets are omni-directional about a vertical axis and operate in the low-flow rate range of 16.7 Lpm or less. Table 1 provides key specifications for these inlets including manufacturer, model number, volumetric flow rate(s), exterior dimensions, inlet suction velocity, filter diameter, and whether optional internal fractionators are available. This table also includes scaled photographs of each inlet’s design to illustrate geometry and to show relative size to one another. These inlet designs had not been quantitatively developed using computational fluid/particle modeling, had not previously undergone extensive wind tunnel evaluations prior to this study, nor are currently a component of an EPA-approved Federal Reference Method (FRM) or Federal Equivalent Method (FEM) sampler or analyzer for PM2.5, PM10-2.5, or PM10 compliance determinations.
Table 1.
Design and operation™al specifications of the wind tunnel tested low-volume TSP inlets.
| Inlet | 16.7 Lpm ISOKINETIC Nozzle | 5 Lpm Isokinetic Nozzle | PQTSP | URG TSP | miniPM | LVTSP | MiniVol | MS&T Area Sampler (Harvard Impactor) |
|---|---|---|---|---|---|---|---|---|
| Scaled Photo |
|
|
|

|
|
|
|
|
| Manufacturer | U.S. EPA | U.S. EPA | Mesa Laboratories Inc. | URG Inc. | Mesa Laboratories Inc. | Texas A&M | Airmetrics | Air Diagnostics and Engineering Inc. |
| Flow Rate (Lpm) | 16.7 | 5 | 16.7 | 16.7 | 5 | 16.7 | 5 | 4 and 10 |
| Dimensions (cm) | 10.2 (H). ID = 2.52, 1.26, 0.73 |
10.2 (H). ID =1.4, 0.7, 0.4 | 38.7 (H) x 24.6(OD) | 6.7 (H) x 6.4(OD) | 19 (H) x 8.3(OD) | 13.6 (H) x 9.2(OD) | 3.4 (H) x 6.8(OD) | 7.2 (H) x 4.3(OD) |
| Filter Diameter (mm) | 47 | 47 | 47 | 47 | 47 | 47 | 47 | 37 |
| Inlet Suction Velocity (cm s−1) | 56, 222,667 | 56, 222, 667 | 1.1 | 25.3 | 2.7 | 22.0 | 6.9 (PVC) 3.1 (louvered Al) |
10.2 (4 Lpm), 25.6 (10 Lpm) |
| Inlet Material | Machined SS | Machined SS | Spun and machined Al | Teflon coated machined Al | Spun and machined Al | Machined Al | PVC, Spun Al | Machined Al |
| Inlet Screen? | No | No | Yes | No | Yes | No | PVC (no), Al (yes) | No |
| Optional Internal Fractionator? | No | No | 10 μm | No | 1, 2.5, 4, and 10 μm | No | 1, 2.5, and 10 μm | 2.5 and 10 μm |
Isokinetic, Sharp-Edged Nozzles
To demonstrate the overall feasibility of the aerosol collection, extraction, and analysis system, a series of sharp-edged, isokinetic nozzles were fabricated of stainless-steel by the U.S. EPA. Designed to operate at a fixed volumetric flow rate of 16.7 Lpm, nozzles of 2.52, 1.26, and 0.73 cm internal diameters were fabricated to sample isokinetically at wind speeds of 2, 8, and 24 km/hr, respectively. Isokinetic nozzles of 1.4, 0.7, and 0.4 cm internal diameters were also fabricated for operation at a flow rate of 5 Lpm at these same wind speeds. The nozzles were designed to mate with commercially available stainless-steel filter holders (Pall Life Sciences, Port Washington, NY) which housed 47 mm diameter collection filters.
Mesa Laboratories PQTSP
The 16.7 Lpm PQTSP inlet from Mesa Laboratories is of identical geometry to that of EPA’s PM10 louvered inlet specified in 40 CFR Part 50 Appendix L except that the internal fractionator of the PM10 inlet has been eliminated from the design. Under the assumption that all particles aspirated by the inlet are efficiently transported to the sampler’s collection filter, the PQTSP inlet is marketed as being capable of measuring “total” suspended particle concentrations. To date, the PQTSP inlet has not been widely deployed nor has its “total” measurement performance been demonstrated in published field studies.
Kenny et al. (2005) conducted limited wind tunnel tests of the PQTSP inlet using solid Aloxite polydisperse aerosols. At the sampler’s 16.7 Lpm sampling flow rate, the measured 50% sampling efficiencies (i.e., Dp50 cutpoints) at winds speeds of 5.4 km/hr and 10.8 km/hr were determined to be approximately 28 μm and 35 μm aerodynamic diameter, respectively. The noted increase in sampling efficiency with increasing wind speed supports the conjecture that the airborne particles efficiently enter the inlet through the motion of the approaching air through the inlet’s parallel louvers, rather than solely through active suction by the sampler’s flow rate itself.
URG TSP (Model 200-30G)
The URG Incorporated (Chapel Hill, NC) model 200–30g inlet is designed to fit directly over any FRM or FEM’s standard 1.25 inch (3.18 cm) diameter downtube as a replacement for the sampler’s conventional PM10 inlet, thus providing a “TSP” sample. The inlet’s downward-oriented annular aspiration slot was designed to provide a mean upward suction velocity of 25.3 cm/sec at 16.7 Lpm, to match the settling velocity of a 100 μm aerodynamic diameter particle. All surfaces of the machined aluminum inlet are Teflon coated and the inlet does not contain an insect screen. The inlet does not appear to have been widely deployed and no published data exists regarding its actual size-selective performance in the field.
Kenny et al. (2005) conducted limited wind tunnel tests of a prototype inlet of similar geometry and flow rate as the URG TSP sampler. Sampling efficiency was close to 100% for small particles and observed to decrease monotonically with increasing aerodynamic particle size. For simulated wind speeds of 3.6 km/hr and 7.2 km/hr, the inlet displayed cutpoints of approximately 14 μm and 12 μm aerodynamic diameter, respectively.
Mesa Laboratories OmniFT
Designed as a geometrically scaled-down version of EPA’s 16.7 Lpm louvered PM10 inlet, the Mesa OmniFT sampler operates at a flow rate of 5 Lpm, is battery operated, and can be deployed in numbers for spatial characterization of ambient aerosol over a wide area of interest. The miniPM inlet of the OmniFT sampler is louvered, contains an insect screen, and incorporates a 47 mm diameter collection filter. The OmniFT’s optional internal fractionators are designed to provide cutpoints of 1, 2.5, 4, or 10 μm.
Limited wind tunnel tests were conducted by Kenny et al. (2005) of a 1/3 scale version of the EPA louvered inlet, operating at 5.57 Lpm. This tested inlet was thus slightly larger than the miniPM inlet, operated a higher flow rate, and did not contain an insect screen. For the tests of the 1/3 inlet, the measured 50% sampling efficiencies (i.e. cutpoints) at winds speeds of 5.4 km/hr and 10.8 km/hr were determined to be approximately 18 μm and 17 μm aerodynamic diameter, respectively.
To date, field deployment of the Mesa miniPM inlet has been relatively limited. Watson et al. (2010) conducted fugitive PM10 emission measurements around aggregate producing plants in Irwindale, CA and Upland, CA. However, each sampling event’s 5-hour sampling time did not permit sufficient mass to be collected by the Mesa sampling systems to permit either intra-sampler precision measurements or comparison with other collocated PM10 FRM samplers.
Texas A&M LVTSP
As designed by Wanjura et al. (2005), the Texas A&M LVTSP (Low-Volume Total Suspended Particulate) inlet was intended to enable TSP sampling at a flow rate of 16.7 Lpm, thus avoiding field deployment of more expensive and less portable high-volume TSP samplers. The design of the LVTSP is similar to that of the URG TSP inlet in that its downward-oriented aspiration slot is intended to provide a mean upward suction velocity similar to the settling velocity of a 100 μm aerodynamic diameter particle. However, the diameter of the LVTSP is considerable larger than URG’s inlet which results in a much narrower aspiration slot than that of the URG inlet. Fabricated from machined aluminum, the LVTSP inlet has no insect screen and collects aspirated aerosols on a 47 mm diameter filter for subsequent quantitation. To date, the LVTSP inlet has been used primarily for collection and characterization of particulate emissions from rural agricultural operations (Hughs et al. 2008, Park et al. 2009, Thelan et al. 2009, Faulkner et al. 2011).
Airmetrics MiniVol
The battery operated MiniVol sampler (Airmetrics, Springfield, OR) was designed to offer a low-cost means of determining spatial distributions of ambient PM relative to fixed site FRM or FEM samplers. Operating at a fixed flow rate of 5 Lpm, the MiniVol can be equipped with PM2.5 or PM10 internal fractionators and collects particles on 47 mm diameter filters for subsequent gravimetric and/or chemical analysis. Prior to 2007, the MiniVol’s inlet cap was composed of PVC and featured a downward-oriented annular aspiration slot with a mean suction velocity of 6.9 cm/sec. As part of the overall sampler’s redesign in 2007, the inlet is now composed of spun aluminum and its louvered geometry (including integral insect screen) is a geometrically scaled down version of EPA’s louvered PM10 inlet. The PM2.5 and PM10 internal fractionators of the MiniVol sampler have been independently calibrated in the laboratory under controlled conditions for their size selective performance (Hill et al. 1999).
The MiniVol sampler has been widely deployed during field studies to determine spatial distributions of PM mass and its chemical composition (Salter and Parsons 1999, Heal et al. 2000, Chung et al. 2001, Baldauf et al. 2001, Chow et al. 2002, Kingham et al. 2006, Martinez et al. 2012). The value of the battery-operated MiniVol sampler to saturate areas of interest was clearly demonstrated in these studies and favorable correlation of the MiniVol was generally observed with collocated FRM samplers.
MS&T Area Sampler
Commercially available from Air Diagnostics and Engineering Inc. (Harrison, ME), the inlet for the MS&T Area Sampler (commonly termed the Harvard Impactor) consists of a vertically oriented, capped tube with four, horizontal aspiration slots located immediately below the rain cap. Designed initially for indoor sampling (Marple et al. 1987), the MS&T sampler has also been widely deployed in outdoor environments during specialized health and sampler comparison studies (Lioy et al. 1988, Babich et al. 2000). In the 7-City Babich et al. (2000) study, the 10 Lpm MS&T sampler was configured with 2.5 μm internal fractionators and good mass concentration precision (CV=4.8%) was observed for the sampler during 243 separate 24-hour sampling events. At two of these sites (Rubidoux, CA and Riverside, CA), excellent agreement and correlation was observed between the MS&T sampler and collocated Rupprecht and Pataschnick (Albany, NY) FRM samplers for PM2.5 mass concentration measurements. Cutpoints of 1, 2.5, and 10 μm have been experimentally determined under static conditions for the MS&T’s internal impactors at operational flow rates of 4, 10, 20, and 23 Lpm (Marple et al. 1987, Turner et al. 2000). Lai and Chen (2000) conducted sampling tests of the 10 Lpm MS&T under calm air conditions (i.e., zero wind speed), both with and without the 10 μm cutpoint impactor installed. With the impactor installed, the overall sampling cutpoint of the sampler was measured to be 10.1 μm, and increased to approximately 16 μm with the impactor removed. During our study, wind tunnel tests of the MS&T inlet were conducted at its two most commonly used flow rates of 4 Lpm and 10 Lpm.
Experimental
All procedures for aerosol generation, aerosol collection, size distribution measurement, sampler effectiveness determination, and sampler setup and operation have been detailed by Krug et al. (2017) and will be discussed only briefly in this paper.
Aerosol Generation
All size-selective tests of the low-volume inlets were conducted in EPA’s Aerosol Test Facility located in RTP, NC. Based on the recognition that use of liquid test aerosols may not accurately represent the bounce and collection characteristics typical of large atmospheric particles (Wang and John, 1987, Koehler et al., 2011), all size-selective tests conducted with the low-volume samplers were conducted using dry, solid polydisperse aerosols composed of naturally occurring Arizona Test Dust (ATD, Powder Technology Inc., Arden Hill, MN). For all generation tests, custom mixtures of various ATD sizes were dispensed from a volumetric feeder (Model 102, Schenck Accurate, Whitewater, WI) equipped with a variable-speed, screw-type rotary drive. At the output of the feeder, the dispensed bulk material was aerosolized into discrete particles through the use of stainless-steel sonic nozzles (Model JS-90M-316SS, Vaccon Company, Medway, MA) operating at controlled supply pressures of 5400 mmHg (90 psig). During aerosol generation, excess electrical charge on the discrete particles was minimized through use of a pulsed DC controller (Model 977CM, Meech International, Oxfordshire, England) equipped with a 5-port array of Meech Model 261 in-line nozzles to ionize the generation system’s dispersion air. Generation of test aerosols at each wind speed was achieved using a single point source aerosol generator centered vertically and horizontally in the tunnel’s exposure test section, and located approximately 11 m upstream of the sampler test section. Spatially uniform aerosol concentrations were produced in the sampler test section using an array of five strategically-placed, oscillating 0.75 m diameter mixing fans. This combination of aerosol generation and dispersion components was identical at all three wind speeds and did not require the use of large mixing baffles and/or turbulence grids in order to achieve sufficient aerosol uniformity during the sampler performance tests.
Wind speeds of 2, 8, and 24 km/hr in the sampler test section (W = 1.8 m; H = 1.5 m) were achieved by controlling the tunnel’s volumetric flow rate via a direct-drive, vane-axial fan (Twin City Fan and Blower, Minneapolis, MN). As determined by conducting multi-point velocity profiles using a thermal anemometer (Model AQTI-01, Dwyer Instruments, Michigan City, IN), this aerosol generation and dispersion configuration resulted in acceptable velocity profiles in the test section at all three wind speeds. As in the case of aerosol uniformity, all wind tunnel procedures for the determination of velocity profiles were based on EPA’s wind tunnel testing requirements and acceptance criteria specified in 40 CFR Part 53 Subpart D (U.S. EPA, 1987).
Aerosol Collection
Determination of a candidate inlet’s size-selective performance requires measurement of the size distribution of the challenge aerosols in the wind tunnel’s test section. For this purpose, reference aerosol samples were collected using two identical, custom-designed 90 mm diameter filter holders designed to operate at an inlet flow rate of 100 Lpm. For the 90 mm filter holders, a series of custom-designed sharp-edged, stainless-steel isokinetic nozzles were machined with internal diameters of 6.18, 3.09, and 1.78 cm, which correspond to use at simulated wind speeds of 2, 8, and 24 km/hr, respectively. The correct volumetric flow rate through the 90 mm reference samplers was maintained by a custom-designed flow control system equipped with automatic flow valves, and flows were continuously monitored using calibrated flow sensors (Model 4045, TSI Inc., Shoreview, MN).
To assist in the efficient removal of collected particles for subsequent size distribution determination, all candidate samplers and reference samplers were equipped with precleaned, 1 μm pore size polycarbonate Whatman filters (GE Healthcare, Piscataway, NJ). Specialized techniques were developed and adopted to minimize inadvertent loss of collected particles from the smooth polycarbonate filters during post-sampling filter removal, handling, and extraction operations.
Sampler Setup and Operation
Each candidate sampler inlet was cleaned prior to each day’s test, equipped with a 1 μm pore size polycarbonate filter, and then installed in the vertical and horizontal center of the wind tunnel’s sampler test section. The two precleaned and preloaded isokinetic samplers were then positioned approximately 30 cm on either side of the candidate inlet and at the same elevation. Each candidate inlet was operated at its design flow rate, with flow provided by connection to a calibrated PM2.5 FRM vacuum system. Prior to each test series, the sampling inlet and vacuum system were leaked checked and the volumetric flow rate verified using a TetraCal flow calibration system (Mesa Laboratories, Butler, NJ). Run times for each effectiveness test were typically 90 minutes but varied from 45 to 120 minutes in order to optimize analytical particle counts as a function of candidate inlet flow rate and expected airborne particle concentration. Typically, 5 to 10 replicate tests were conducted with each inlet at each of the three wind speeds to obtain confident test results.
Size Distribution Measurement
Extraction of collected particles from all filters involved the use of pre-filtered electrolyte consisting of an 80:20 (m/m) mixture of Isoton II and glycerol including a trace amount of Triton X-100 dispersant. The volume of electrolyte used for each filter depended upon the filter size and the sampling event’s expected loading but was typically 100 mL for 47 mm diameter filters and 800 mL for reference sampler’s 90 mm diameter filters. To properly account for any inadvertent particle losses within the 100 Lpm isokinetic reference nozzles, the internal surfaces of the nozzles were carefully rinsed and the nozzle extracts were included in the determination of the total reference sampler’s particle concentration. To mimic the conditions of their actual field use, internal losses within the candidate low-volume inlets were not routinely quantified and added to the collected filter concentrations. Instead, only the filters of the low-volume inlets were extracted for determination of overall inlet sampling efficiency.
The size distribution (number concentration versus physical particle size) of particles in each solution was determined using a Coulter Counter (Model Multisizer IV, Beckman Coulter, Bree, CA) equipped with a 100 μm aperture. Because the Coulter Counter’s measurement principle provides sizing data in equivalent volume diameter, the aerodynamic diameter of each measured particle was calculated by accounting for the particle density of 2.5462 g/cm3 (measured by ultrapycnometry) and a dynamic shape factor for ATD of 1.4 (Endo et al., 1998, Mohler et al., 2008). The size selective performance of each ambient sampler was determined by proper consideration of the low-volume sampler’s and isokinetic sampler’s flow rates, extraction volumes, and measured particle counts as a function of particle size in each extracted solution.
Estimation of Ambient Mass Concentration Measurement Performance
Numerous multi-site field studies of ambient particle size distributions have consistently shown that ambient aerosols encompass a wide range of particles sizes (Lundgren 1970; Lundgren and Paulus 1975; Whitby 1978; John et al. 1990). These studies have further characterized distributions as typically lognormally distributed and bimodal in nature, with modal peaks of mass concentration due primarily to differences in particle formation mechanisms. In general, submicrometer particles are formed by processes of combustion, condensation, gas-to-particle conversion, and coagulation. Processes which involve the mechanical breakup of larger parent material, such as grinding, crushing, and mechanical abrasion operations result in airborne particles which are in the supermicrometer size range. Ambient aerosols almost always include both submicrometer and supermicrometer modes with their relative mass contributions and peak locations varying with time, location, and local and regional emission activities.
During a given sampling event, the actual total mass concentration measured by an ambient particulate sampler depends on both the sampler’s known fractionator characteristics and the aerodynamic particle size distribution of the aspirated ambient aerosol. Based on research by Kenny and Bartley (1995), the expected mass concentration of a size selective aerosol sampler used to sample an aerosol with normalized mass distribution A(Dp) can be numerically estimated as:
| (1) |
where C is the estimated mass concentration, E(Dp) is the sampler’s effectiveness curve, A(Dp) is the ambient particle size distribution under consideration, and Dp is the aerodynamic particle diameter. For a given sampler with known sampling characteristics, total mass concentration estimates can be made using either known ambient size distributions or idealized ambient size distributions.
As described by Vanderpool et al. (2001) modal parameters (i.e., mass median diameter (MMD), geometric standard deviations (GSD), and mass concentrations) of idealized “fine”, “typical”, and “coarse” ambient distributions were based on previous ambient field measurements and codified in 40 CFR Part 53 Subparts F and D for testing criteria for candidate PM2.5 and PM10 samplers, respectively. To estimate the mass concentration measurement efficiency of very large airborne particles, parameters based on field studies conducted during windblown conditions outside of Phoenix, AZ during EPA’s development of the Federal Reference Method for PM10-2.5 (Vanderpool et al. 2006) were used. As depicted by the distribution parameters listed in Table 2, these four distributions are expected to encompass the range of sampling situations for which the low-volume samplers would typically be used.
Table 2.
Bimodal parameters of the four idealized ambient particle distributions (MMD = mass median diameter, GSD = geometric standard deviation).
| Idealized Ambient Size Distribution | ||||
|---|---|---|---|---|
| Fine | Typical | Coarse | Very Coarse | |
| Fine particle mode | ||||
| MMD | 0.85 | 0.50 | 0.50 | 0.50 |
| GSD | 2.0 | 2.0 | 2.0 | 2.0 |
| Conc. μg/m3 | 85.0 | 33.3 | 12 | 7.0 |
| Coarse particle mode | ||||
| MMD | 15 | 10 | 15 | 15 |
| GSD | 2.0 | 2.0 | 2.0 | 2.0 |
| Conc. μg/m3 | 15.0 | 66.7 | 88.0 | 93.0 |
| Total Conc. μg/m3 | 100 | 100 | 100 | 100 |
For this study, each of the low-volume samplers’ effectiveness curves were numerically integrated with each of these four distinct idealized ambient distributions. Ranges of the effectiveness curves were based on the Coulter Counter’s operational range of 3.38 to 30 μm aerodynamic diameter. As will be discussed, the fractional effectiveness of the smallest measured sizes typically approached unity (i.e., 100% sampling effectiveness) independent of the sampler tested. As a result, particles in the 0.01 to 3.38 μm size range were assigned effectiveness values of 100% for the numerical analysis. Particles larger than 30 μm aerodynamic diameter were excluded from the calculation due to increased uncertainty in their effectiveness values, resulting from their low airborne particle concentrations. Even for the “very coarse” idealized size distribution, particles below 30 μm aerodynamic diameter encompass 95% of the estimated mass concentration. Therefore, excluding particles above this size range does not adversely affect the overall conclusions made from the use of particles solely in the 0.01 to 30 μm aerodynamic diameter size range. For the numerical analysis of a given sampler at a particular wind speed, the 0.01 to 30 μm size range was divided into 74 equally spaced intervals and the expected mass concentration for that interval was calculated as the mass associated with each interval times the measured effectiveness value for that interval. The total expected mass concentration for the sampler was then calculated as the numerical sum of all the calculated interval mass concentrations. Comparing this estimated total mass concentration to the idealized mass concentration in the 0.01 to 30 μm size range resulted in the total mass concentration measurement efficiency for the sampler under these conditions.
To assist in statistical interpretation of the inlets’ size-selective performance test results, a comparison was made of each inlet’s effectiveness curve as a function of changes in wind speed. For this purpose, sum of the squares of the difference (SSD) analysis was conducted for each sampler at each of the three wind speeds using the 74 particle sizes in the tested 5 to 30 μm aerodynamic diameter size range. Based on subsequent observation that a 10% change in expected total mass concentration was typically associated with SSD values greater than 2.0, this SSD value was adopted as the level of significance to numerically determine whether a given change in wind speed provided statistically significant differences in expected mass concentration measurement performance for each inlet.
Results
16.7 Lpm Isokinetic Nozzle
Figure 1 presents results of the wind tunnel evaluation of the 16.7 Lpm isoaxial, isokinetic nozzle at a wind speed of 24 km/hr. For the 13 replicate tests conducted under identical conditions, plotted is the mean measured sampling effectiveness for each of the Coulter Counter’s size channels as a function of aerodynamic diameter. For each data point, whisker plots represent ± 1 standard deviation of the replicate analyses. As is typical for all samplers involved in this study, Figure 1 illustrates that the standard deviation of replicate analyses tends to increase with particle size due to inherently lower particle concentrations downstream of the aerosol generator than exists for smaller particles.
Figure 1.

Measured sampling effectiveness of the 16.7 Lpm isokinetic sampler at 24 km/hr. Whiskers represent ±1 standard deviation of the 13 replicate tests.
For all particles in the tested size range, the mean effectiveness at 24 km/hr (n=13) was determined to be 96%. In other words, the 16.7 axial, isokinetic sampler was measured to be nearly 100% efficient independent of aerodynamic particle size at this wind speed. This result is in strong agreement with predictions of classical sampling theory for sharp-edged, isokinetic nozzles facing directly upstream (Durham and Lundgren 1980). As depicted in Figure 2, similar results were obtained at wind speeds of 2 km/hr (n=14) and 8 km/hr (n=10) where the mean effectiveness for all particles was determined to be 94% and 100%, respectively. For the three tested wind speeds, the mean sampling effectiveness of all data (n=37) was determined to be 96% for the 16.7 Lpm isokinetic nozzle. For purposes of legibility, whisker plots have been omitted from this figure, as well as from all subsequent plots in this paper.
Figure 2.

Measured sampling effectiveness of the 16.7 Lpm isokinetic sampler as a function of ambient wind speed and aerodynamic particle diameter.
Table 3 tabulates results from integrating each sampler’s measured effectiveness curve with the four idealized ambient particle size distributions. As would be expected from the 16.7 Lpm isokinetic nozzle’s effectiveness curves, the estimated total mass measurement performance of the isokinetic sampler was close to 100% at all wind speeds. For the twelve combinations of the three wind speeds and the four idealized size distributions, the mean estimated mass measurement performance was 98% with a CV of only 3%. This low CV value indicates only minor variations in predicted mass measurement behavior of this nozzle independent of wind speed and measured ambient size distribution.
Table 3.
Estimated total mass concentration collection efficiency of each low-volume sampler as a function of wind speed and idealized ambient particle size distribution. Tabulated values resulted from numerical integration of each sampler’s measured particle collection effectiveness curve with each assumed ambient distribution.
| Estimated Total Mass Concentration Collection Efficiency | |||||||||||||||
|---|---|---|---|---|---|---|---|---|---|---|---|---|---|---|---|
| Idealized Ambient Particle Size Distribution | |||||||||||||||
| Fine | Typical | Coarse | Very Coarse | ||||||||||||
| Sampler | 2 km/hr | 8 km/hr | 24 km/hr | 2 km/hr | 8 km/hr | 24 km/hr | 2 km/hr | 8 km/hr | 24 km/hr | 2 km/hr | 8 km/hr | 24 km/hr | |||
| ISO 16.7 | 99% | 100% | 99% | 96% | 102% | 97% | 95% | 102% | 97% | 94% | 101% | 96% | 98% | 3% | 3% |
| ISO 5.0 | 99% | 100% | 101% | 94% | 101% | 106% | 92% | 102% | 106% | 91% | 102% | 109% | 100% | 6% | 6% |
| PQTSP | 96% | 100% | 99% | 85% | 100% | 101% | 80% | 99% | 101% | 79% | 99% | 102% | 95% | 9% | 9% |
| URG | 97% | 96% | 97% | 88% | 84% | 91% | 84% | 79% | 91% | 84% | 77% | 87% | 88% | 7% | 8% |
| miniPM | 96% | 97% | 96% | 88% | 90% | 85% | 84% | 87% | 85% | 74% | 77% | 79% | 87% | 8% | 9% |
| LVTSP | 97% | 98% | 96% | 87% | 91% | 84% | 83% | 88% | 84% | 77% | 83% | 78% | 87% | 7% | 8% |
| MiniVol PVC | 92% | 96% | 95% | 71% | 86% | 82% | 61% | 81% | 82% | 49% | 73% | 75% | 79% | 14% | 18% |
| MiniVol Louvered with Screen | 93% | 99% | 92% | 72% | 96% | 68% | 62% | 95% | 68% | 52% | 93% | 55% | 79% | 18% | 22% |
| MiniVol Louvered without Screen | 98% | 96% | 94% | 93% | 86% | 75% | 91% | 82% | 75% | 83% | 73% | 65% | 84% | 11% | 12% |
| MS&T 10 Lpm | 97% | 92% | 93% | 88% | 70% | 71% | 84% | 61% | 71% | 78% | 46% | 58% | 76% | 16% | 21% |
| MS&T 4 Lpm | 96% | 91% | 89% | 85% | 66% | 53% | 81% | 55% | 53% | 73% | 41% | 34% | 68% | 21% | 30% |
Table 4 provides results of the SSD significance tests for each of the tested low-volume inlets at each wind speed. As supported by the graphical presentation of this inlet’s performance (Figure 2) and results presented in Table 2, the low SSD values for this inlet in Table 4 demonstrate that the 16.7 Lpm isokinetic inlet’s size-selective performance strongly agrees with predictions for isoaxial, sharp-edged nozzles.
Table 4.
Results from SSD numerical analysis of inlet performance as a function of changes in wind speed. Shaded cells represent statistically significant changes in sampler total mass concentration measurement performance over the 5 to 30 μm aerodynamic diameter size range.
| Sum of Squared Differences (SSD) Values for the 5 to 30 μm Data | |||
|---|---|---|---|
| Sampler | 2 vs 8 km/hr | 2 vs 24 km/hr | 8 vs 24 km/hr |
| ISO16.7 | 0.54 | 0.15 | 0.36 |
| ISO5 | 1.05 | 2.55 | 0.66 |
| PQTSP | 13.18 | 5.29 | 5.54 |
| URG | 2.27 | 0.34 | 1.41 |
| MiniPM | 0.15 | 0.91 | 1.36 |
| LVTSP | 0.58 | 1.05 | 1.05 |
| MIniVol PVC | 5.18 | 5.40 | 0.87 |
| MiniVol w/screen | 18.58 | 0.46 | 24.66 |
| MiniVol w/o screen | 1.08 | 7.02 | 2.89 |
| MST 10 Lpm | 12.77 | 14.22 | 2.30 |
| MST 4 Lpm | 11.33 | 18.47 | 2.57 |
5 Lpm Isokinetic Nozzle
The results of the 5 Lpm isokinetic nozzle tests at the three wind speeds are displayed in Figure 3. At this lower flow rate, replicate results were slightly more variable than was observed with the 16.7 Lpm isokinetic nozzle. Nonetheless, mean particle collection efficiencies at wind speeds of 2 km/hr (n=14), 8 km/hr (n=10), 24 km/hr (n=13) were determined to be 92%, 102%, and 108%, respectively, for a mean effectiveness of 100% for the 37 replicate runs. Similar to that of the 16.7 Lpm nozzle, the predicted mass measurement performance of the 5 Lpm isokinetic nozzle over all test conditions was excellent (Table 3, mean = 100%, CV = 6%). Inspection of Table 4 for this inlet indicates that slightly significant (SSD=2.55) changes in inlet performance could be expected in the 2 vs 24 km/hr wind speed category. No significant change in measurement performance is expected in either the 2 vs 8 km/hr or the 8 vs 24 km/hr wind speed comparisons.
Figure 3.

Wind tunnel results of the 5 Lpm isokinetic sampler at wind speeds of 2, 8, and 24 km/hr.
The overall excellent agreement of the 5 Lpm and 16.7 Lpm isokinetic samplers’ test results with those results predicted by sampling theory demonstrated that proper techniques for aerosol generation, transport, collection, and measurement had been successfully developed and implemented for this study’s wind tunnel evaluation of the low-volume TSP samplers.
Mesa Laboratories PQTSP Sampler
Figure 4 plots the mean sampling effectiveness of the 16.7 Lpm Mesa Laboratories PQTSP as a function of aerodynamic diameter. The effectiveness of this inlet for small particles was near 100% for all three winds speeds then decreased monotonically at 2 and 24 km/hr. The more rapid decrease in effectiveness at 2 km/hr may be due to settling losses within this sampler’s relatively large geometry compared to the other inlets involved in this study. Table 3 shows that this decreased effectiveness at 2 km/hr results in prediction mass concentration measurement efficiency of only 79–80% for the two larger idealized distributions. For the remaining two wind speeds, however, Table 3 illustrates that total mass collection efficiency close to 100% can be expected for this inlet at all but very low ambient wind speeds.
Figure 4.

Measured sampling effectiveness of the 16.7 Lpm PQTSP sampler.
Compared to the SSD values calculated for the isokinetic, isoaxial samplers, SSD values up to 13.18 for the PQTSP sampler predict significant changes for all three wind speeds data sets. These calculations support graphical presentation of sampler performance in Figure 3, as well as mass concentration measurement efficiencies presented in Table 3.
Although the geometry of the PQTSP inlet is similar to that of EPA’s approved PM10
FRM’s inlet (40 CFR Part 50 Appendix L), it is important to note that the PQTSP inlet lacks the complex internal fractionator of the FRM’s inlet. As is the case for all ambient PM samplers, the overall performance of the PM10 FRM’s inlet is the combined size-selective performance of the sampler’s inlet and its internal fractionator. As documented by Vanderpool (2016), eight separate wind tunnel evaluations of EPA’s 16.7 Lpm PM10 inlet resulted in mean cutpoints of 9.9, 10.1, and 9.9 μm aerodynamic diameter at wind speeds of 2, 8, and 24 km/hr, respectively.
URG TSP Sampler
Wind tunnel test results of the 16.7 Lpm URG TSP inlet are plotted in Figure 5. Effectiveness was near 100% for the smallest particles at all three wind speeds and the 8 km/hr effectiveness curves for large particles decreased only slightly less than that of the 2 and 24 km/hr curves. At all wind speeds, total ambient mass concentration measurement efficiency tended to decrease as the particle size of the idealized aerosol distribution increased. On average across the four particle size distributions, the URG inlet was capable of measuring ambient mass concentrations with an accuracy of approximately 88% (Table 3). Results presented in Table 4 show only a slightly significant change (SSD=2.27) in the 2 vs 8 km/hr comparison range and only minor effects in the 2 vs 24 km/hr and 8 vs 24 km/hr comparisons.
Figure 5.

Measured sampling effectiveness of the 16.7 Lpm URG inlet.
Mesa Laboratories miniPM Sampler
Figure 6 displays test results for the 5 Lpm Mesa Laboratories miniPM sampler. The measured sampling effectiveness for this inlet was near 100% for the smallest particles at all three wind speeds and the 24 km/hr effectiveness curve for large particles decreased only slightly less than that of the 2 and 8 km/hr curves. Table 3 indicates that the monotonic decrease in sampler performance at all three wind speeds resulted in decreased total mass measurement performance as the ambient aerosol size distribution increases. Overall, though, the mass measurement performance of the Mesa miniPM inlet was similar to that of the 16.7 Lpm URG TSP sampler, independent of the idealized ambient particle size distribution. As depicted in Table 4, none the three wind speed comparisons resulted in statistical significant changes in mass concentration measurement performance.
Figure 6.

Measured sampling effectiveness of the Mesa Laboratories miniPM sampler’s inlet.
Texas A&M LVTSP Sampler
Size selective test results of the 16.7 Lpm Texas A&M LVTSP sampler are shown in Figure 7. As in the case of the previously discussed low-volume inlets, the fractional effectiveness of small particle sampling was near unity for all three wind speeds. Effectiveness tended to decrease similarly at wind speeds of 2 and 8 km/hr with increasing particle diameter. The decrease in effectiveness dropped more dramatically at 24 km/hr, however, then tended to remain constant with increasing particle size. The LVTSP displayed decreasing total mass measurement performance with increasing ambient aerosol size distribution (Table 3). On average across the four particle size distributions, the LVTSP inlet is capable of measuring ambient mass concentrations with an accuracy of approximately 87%. Table 4 documents that no significant change in mass concentration measurement performance was predicted for the LVTSP sampler over the three sets of wind speed ranges.
Figure 7.

Results from wind tunnel evaluation of the 16.7 Texas A&M LVTSP inlet.
As mentioned, the LVTSP sampler was developed to characterize rural agricultural operations where emission of large particles often occurs in conjunction with high ambient wind speeds. For example, Lacey et al. (2003) and Wang et (2002) described measured size distributions associated with agricultural activities related to poultry broiler houses (MMD=24 μm, GSD=1.6) and dairy operations (MMD=23 μm, GSD=1.8), respectively. At an ambient wind speed of 24 km/hr, the LVTSP sampler is predicted to sample only 48% of the particle mass concentration associated with both of these rural agricultural operations.
Airmetrics MiniVol Sampler
The original design of the 5 Lpm Airmetrics MiniVol sampler included use of a downward facing inlet cap composed of PVC with no integral insect screen. During the 2007 redesign of the sampler, this cap was replaced by a louvered aluminum inlet which includes an insect screen.
Figure 8 displays test results for the 5 Lpm MiniVol sampler equipped with the PVC inlet. Unlike the previously mentioned inlets, the effectiveness values of the PVC inlet were not near 100% for the smallest tested particles. In particular, the effectiveness for small particles at 2 km/hr was approximately 80% and decreased dramatically until approximately 15 μm, at which point the effectiveness remained at approximately 25%. The effectiveness for small particles was higher during the 8 and 24 km/hr tests then remained at approximately 60% for particles larger than 15 μm aerodynamic diameter. Table 3 indicates that the monotonic decrease in sampler performance at all three wind speeds results in decreased total mass measurement performance as the ambient aerosol size distribution increases. Overall, the expected mass concentration effectiveness for the PVC inlet version of the MiniVol was determined to be 79%.
Figure 8.

Results from evaluation of the 5 Lpm miniVol sampler equipped with the PVC inlet.
Tests conducted with the newer aluminum louvered version (with insect screen) of the MiniVol showed improved effectiveness at 8 km/hr but decreased effectiveness at 24 km/hr (Figure 9). The effectiveness curves at 2 and 24 km/hr begin at 75% for small particles then decreases similarly for larger particle sizes. The mean predicted 79% mass concentration effectiveness of the louvered MiniVol was identical to that of the PVC version (Table 3).
Figure 9.

Results from evaluation of the 5 Lpm miniVol louvered inlet equipped with the integral insect screen.
To determine if the presence of the insect screen may adversely influence the performance of the louvered inlet, the screen was removed and the wind tunnel tests repeated at all wind speeds. As depicted in Figure 10, this configuration of the inlet resulted in improved performance during small particle sampling, as well as more consistent performance among the three wind speeds. As demonstrated by the mean 84% effectiveness for all size distributions at all wind speeds, removal of the insect screen improved the sampler’s performance at all wind speeds and for all four idealized particle size distributions (Table 3).
Figure 10.

Results from evaluation of the 5 Lpm miniVol louvered inlet with the insect screen removed.
Table 4 illustrates that changes in the MiniVol’s configuration (e.g., addition or removal of the insect screen) can significantly influence the effect of wind speed variations on the sampler’s mass concentration measurement performance.
MS&T Area (Harvard) Sampler
Results of wind tunnel evaluation of the MS&T Area Sampler operating at 10 Lpm are presented in Figure 11. Operation of the sampler at 2 km/hr provided sampling performance that reduced linearly as a function of aerodynamic diameter. A fairly dramatic decrease in effectiveness versus particle size was observed at 8 km/hr, as evidenced by sampling effectiveness of less than 20% for 20 μm and larger particles. Effectiveness during the 24 km/hr tests was only 25% for 10 μm particles, although effectiveness was observed to increase above 10 μm. The expected total mass concentration efficiency for the MS&T sampler operating at 10 Lpm was determined to be 76% (Table 3)
Figure 11.

Wind tunnel test results of the MS&T inlet operated at 10 Lpm.
Figure 12 shows results from the wind tunnel evaluation of the MS&T sampler operating at a flow rate of 4 Lpm. This 4 Lpm sampler’s effectiveness at wind speeds of 2 and 8 km/hr was quite similar to when the sampler was operated at 10 Lpm. However, the 4 Lpm sampler’s effectiveness at 24 km/hr was dramatically reduced with only about 50% effectiveness measured at 5 μm particles, and 25% effectiveness for 10 μm particles. The predicted mass concentration effectiveness of the idealized Very Coarse aerosol was only 34% (Table 3). Accounting for all four idealized distributions at all wind speeds, the overall effectiveness was estimated to be only 68%.
Figure 12.

Wind tunnel test results of the MS&T inlet operated at 4 Lpm.
As documented in Table 4, changes in wind speeds can significantly influence the expected mass concentration measurement performance of both the 4 and 10 Lpm versions of the MST sampler. These changes in measurement performance were particularly significant over the 2 vs 24 km/hr wind speed range, as illustrated by SSD values of 18.47 and 14.22 for the 4 Lpm and 10 Lpm samplers, respectively.
Discussion and Conclusions
As predicted from aerosol sampling theory, the size-selective performance of the 5 and 10 Lpm sharp-edged, isoaxial, isokinetic nozzles was nearly 100% independent of aerodynamic particle size and wind speed. However, incorporating an isokinetic inlet design into routine field use would require exact alignment of the nozzle with instantaneous wind direction in order to avoid measurement bias due to sampling misalignment (Durham and Lundgren 1980). Further, requirements of isokinetic sampling would require continuous adjustment of nozzle diameter and/or sampling flow rate to match instantaneously measured ambient velocities. As a result of these requirements, it is impractical to incorporate isokinetic sampling into routine ambient monitors. However, the value of the isokinetic samplers was clearly demonstrated in this study for validating this study’s developed procedures for polydisperse aerosol generation, transport, collection, and measurement in EPA’s wind tunnel.
None of the six tested commercially-available low-inlets displayed ideal sampling performance at the three tested wind speeds. As expected due to considerations of large particle inertia in flowing airstreams, sampling performance in all inlets typically decreased as a function of aerodynamic particle size. For the MS&T inlet which is essentially an open upward facing tube perpendicular to the incoming flowstream, sampling performance intuitively decreased with increasing wind speed, as well at lower sampling flow rate. For samplers with more complex inlet geometries (i.e., PQTSP, MiniVol PVC), sampling efficiency at 24 km/hr was observed to be higher for some particle sizes than at 2 or 8 km/hr. On average over most wind speeds, the majority of the tested samplers could be expected to provide mass concentration measurements in the range of 75% to 95% of the theoretical ambient mass concentration for particles less than 30 μm aerodynamic diameter. Statistical analysis of test results showed that mass concentration measurement performance of the low-volume samplers was significantly influenced by changes in ambient wind speed.
Although this paper has primarily focused on the predicted mass concentration measurement performance of the low-volume inlets, it is useful to discuss implications of test results regarding the sampling and size-fractionation of particles of specific interest, such as PM2.5 and PM10. In this regard, accurate determination of specific size fractions requires that the inlet efficiently sample particle sizes of interest independent of wind speed and direction. Aspirated particles must then be efficiently transported to the system’s internal size-fractionator, which is located downstream of the inlet. Particles which enter the fractionator must then be inertially separated based on pre-defined performance curves, followed by their efficient transport to the system’s collection or analysis section. Accurate determination of ambient size fractions of interest, therefore, relies on the combined ability to efficiently sample particles from the ambient air, inertially fractionate the aspirated particles in a defined manner, and minimize internal particle losses in all regions between the system’s inlet and its collection zone (Marple and Rubow 1986).
For sampling and analysis of ambient aerosols for PM2.5 measurements, EPA regulations require efficient sampling and quantitation of ambient aerosols up to approximately 4 μm aerodynamic diameter (U.S. EPA 1997). Inspection of this study’s test results suggests that all the tested low-volume inlets (with the possible exception of the MS&T 4 Lpm sampler at 24 km/hr) are likely capable of extracting representative particles up to this aerodynamic particle size independent of wind speed and direction. Further, internal transport losses of particles in this size range are typically minimal in most sampler geometries and operational flow rates due to these particles’ relatively low inertia. As a result, the downstream use of a PM2.5 fractionator which has been size-calibrated under static (i.e., still air) conditions could likely be used in conjunction with any of these tested low-volume inlets to provide accurate PM2.5 concentration determinations.
However, with regards to potential PM10 concentration determination, large particle sampling effectiveness is much more variable as a function of low-volume sampler design and operating flow rate. In conjunction with these low-volume inlets, use of a 10 μm fractionator calibrated under static conditions could result in highly variable and inaccurate PM10 concentration determinations.
For example, consider the 10 Lpm MS&T inlet used in conjunction with the sampler’s internal impactor which has been tested under static conditions to have a cutpoint (i.e., 50% effectiveness value) of 10 μm. Inspection of the inlet’s effectiveness curve (Figure 11) reveals that the inlet only successful aspirates approximately 50% of the ambient 10 μm particles at wind speeds of 24 km/hr. The overall sampling effectiveness for this size particle would thus only be 25% at this wind speed with the sampler’s internal fractionator installed. This directional shift in the sampler’s overall effectiveness curve would inadvertently negatively bias measured PM10 mass concentrations measured by this sampler and potentially bias decisions made with the sampler’s collected data. Inspection of the effective curve (Figure 12) for the 4 Lpm version of this sampler would predict an even greater negative measurement bias associated with these size particles.
In addition, the significant inertia of large particles is likely to result in appreciable internal particle losses which may be particularly high in the region of the inlet’s interior and near the internal fractionator’s entry section (Vincent 2007). Significant large particle losses could further negatively bias the position of the fractionation curve and would result in additional negative bias in measured PM10 mass concentrations. Particularly in the case of PM10 samplers, therefore, it is important to conduct wind tunnel evaluation of complete sampling systems which include both the sampler’s inlet and its internal size fractionator.
This study has emphasized the important role of size-selective PM inlets towards obtaining representative samplers of ambient particulate matter. To fully characterize the sampler’s size-selective properties, future developments of low-volume particulate matter samplers should include wind tunnel evaluation of the complete sampler and not solely the sampler’s internal fractionator. Results of such research initiatives would provide improved guidance for inlet design and result in better measurement and interpretation of collected ambient PM data.
Acknowledgments
The background information provided by the respective inlet manufacturers is acknowledged.
Footnotes
Disclaimer/Notice
The United States Environmental Protection Agency through its Office of Research and Development funded and managed the research described here. It has been subjected to Agency review and approved for publication. Mention of products or trade names does not indicate endorsement or recommendation by the Agency.
References
- Babich P, Davey M, Allen G, Koutrakis P. Method Comparisons of Particulate Nitrate, Elemental Carbon, and PM2.5 Mass in Seven U.S. Cities. J Air & Waste Manage Assoc. 2000;50:1095–1105. doi: 10.1080/10473289.2000.10464152. [DOI] [PubMed] [Google Scholar]
- Baldauf RW, Lane DD, Marotz GA, Wiener RW. Performance Evaluation of the Portable MiniVol Particulate Matter Sampler. Atmos Environ. 2001;35:6087–6091. [Google Scholar]
- Chow JC. Measurement Methods to Determine Compliance with Ambient Air Quality Standards for Suspended Particles. J Air & Waste Manage Assoc. 1995;45(5):320–382. doi: 10.1080/10473289.1995.10467369. [DOI] [PubMed] [Google Scholar]
- Chow JD, Watson JG, Edgerton SA, Vega E, Ortiz E. Spatial Differences in Outdoor PM10 Mass and Aerosol Composition in Mexico City. J Air & Waste Manage Assoc. 2002;52:423–434. doi: 10.1080/10473289.2002.10470791. [DOI] [PubMed] [Google Scholar]
- Chung A, Chang DPY, Kleeman MJ, Perry KD, Cahill TA, Dutcher D, McDougall EM, Stroud K. Comparison of Real-time Instruments Used to Monitor Airborne Particulate Matter. J Air & Waste Manage Assoc. 2001;51:109–120. doi: 10.1080/10473289.2001.10464254. [DOI] [PubMed] [Google Scholar]
- Dockery DW, Pope CA, III, Xu X, Spengler JD, Ware JH, Fay ME, Ferris BG, Spiezer FE. An Association Between Air Pollution and Mortality in Six U.S. Cities. N Engl J Med. 1993;329:1753–1759. doi: 10.1056/NEJM199312093292401. [DOI] [PubMed] [Google Scholar]
- Durham MD, Lundgren DA. Evaluation of Aerosol Aspiration Efficiency as a Function of Stokes Number, Velocity Ratio, and Nozzle Angle. J Aerosol Sci. 1980;11:179–188. [Google Scholar]
- Endo Y, Chen D, Pui DYH. Effects of Particle Polydispersity and Shape Factor During Dust Cake Loading on Air Filters. Powder Technol. 1998;98(3):241–249. [Google Scholar]
- Faulkner WB, Downey D, Giles DK, Capareda SC. Evaluation of Particulate Matter Abatement Strategies for Almond Harvest. J Air & Waste Manage Assoc. 2011;61:409–417. doi: 10.3155/1047-3289.61.4.409. [DOI] [PubMed] [Google Scholar]
- Heal MR, Beverland IJ, McCabe M, Hepburn W, Agius RM. Intercomparison of five PM10 monitoring devices and the implications for exposure measurement in epidemiological research. J of Env Monitor. 2000;2:455–461. doi: 10.1039/b002741n. [DOI] [PubMed] [Google Scholar]
- Hill JS, Patel PD, Turner JR. Performance Characterization of the MiniVol PM2.5 Sampler. 92nd Annual Meeting of the Air & Waste Management Association, Paper No. 99–617.1999. [Google Scholar]
- Hughs SE, Armijo CB, Whitelock DP, Buser MD. Particulate Emission Profile of a Cotton Gin. Applied Engineering in Agriculture. 2008;24(2):145–151. [Google Scholar]
- John W, Wall SM, Ondo JL, Winklmayr W. Modes in the Size Distributions of Atmospheric Inorganic Aerosols. Am Ind Hyg Assoc. 1990;46:517–523. [Google Scholar]
- Kenny LC, Bartley DL. The performance evaluation of aerosol samplers tested with monodisperse aerosols. J Aerosol Sci. 1995;26:109–126. [Google Scholar]
- Kenny L, Beaumont G, Gudmundesson A, Thorpe A, Koch W. Aspiration and Sampling Efficiencies of the TSP and Louvered Particulate Matter Inlets. J Environ Monit. 2005;7:481–487. doi: 10.1039/b419001g. [DOI] [PubMed] [Google Scholar]
- Kingham S, Durand M, Aberkane T, Harrison J, Wilson J, Epton M. Winter Comparison of TEOM, MiniVol and DustTrak PM10 Monitors in a Woodsmoke Environment. Atm Environ. 2006;40:338–347. [Google Scholar]
- Koehler KA, Anthony TR, Van Dyke M, Volckens J. Solid versus Liquid Particle Sampling Efficiency of Three Personal Aerosol Samplers when Facing the Wind. Ann Occup Hyg. 2011:1–13. doi: 10.1093/annhyg/mer077. [DOI] [PMC free article] [PubMed] [Google Scholar]
- Krug JD, Dart A, Witherspoon CL, Gilberry J, Malloy Q, Kaushik S, Vanderpool R. Revisiting the Size Selective Performance of EPA’s High-Volume Total Suspended Particulate Matter (Hi-Vol TSP) Sampler. J Aerosol Sci Technol. 2017;7:868–878. doi: 10.1080/02786826.2017.1316358. [DOI] [PMC free article] [PubMed] [Google Scholar]
- Lacey RE, Redwine JS, Parnell CB., Jr Particulate Matter and Ammonia Emission Factors for Tunnel-Ventilated Broiler Production Houses in the Southern US. Trans ASAE. 2003;46(4):1203–1214. [Google Scholar]
- Lai C, Chen C. Performance Characteristics of PM10 Samplers under Calm Air Conditions. J Air & Waste Manage Assoc. 2000;50:578–587. doi: 10.1080/10473289.2000.10464029. [DOI] [PubMed] [Google Scholar]
- Lioy PJ, Wainman T, Turner W, Marple VA. An Intercomparison of the Indoor Air Sampling Impactor and the Dichotomous Sampler for a 10-μm Cut Size. JAPCA. 1988;38(5):668–670. [Google Scholar]
- Liu BY, Pui DY. Aerosol Sampling Inlets and Inhalable Particles. Atm Environ. 1981;15:589–600. [Google Scholar]
- Lundgren DA. Atmospheric Aerosol Composition and Concentration as a Function of Particle Size and Time. JAPCA. 1970;20:603–608. doi: 10.1080/00022470.1970.10469449. [DOI] [PubMed] [Google Scholar]
- Lundgren DA, Paulus HJ. The Mass Distribution of Large Atmospheric Particles. JAPCA. 1975;25:1227–1231. [Google Scholar]
- Marple VA, Rubow KL. In: Theory and Design Guidelines, Cascade Impactors: Sampling & Data Analysis. Lodge JP, Chan TL, editors. Chapter 4. AIHA; 475 Wolf Ledges Parkway, Akron, OH 44331: 1986. [Google Scholar]
- Marple V, Rubow KL, Turner W, Spengler J. Low Flow Rate Sharp Cut Impactors for Indoor Air Sampling: Design and Calibration. J Air & Waste Manage Assoc. 1987;37:1303–1307. doi: 10.1080/08940630.1987.10466325. [DOI] [PubMed] [Google Scholar]
- Martinez MA, Caballero P, Carrillo O, Mendoza A, Mejia GM. Chemical Characterization and Factor Analysis of PM2.5 in Two Sites of Monterrey, Mexico. J Air & Waste Manage Assoc. 2012;62:817–827. doi: 10.1080/10962247.2012.681421. [DOI] [PubMed] [Google Scholar]
- McFarland AR, Ortiz CA, Rodes CE. Proceedings of the Technical Basis for a Size Specific Particulate Standard. Air Pollution Control Association; Pittsburgh, PA: 1980. Characterization of Sampling System; p. 59. [Google Scholar]
- McMurray PH. A Review of Atmospheric Aerosol Measurements. Atm Environ. 1999;34:1959–1999. [Google Scholar]
- Mohler O, Benz S, Saathoff H, Schnaiter M, Wagner R, Schneider J, Wagner S. The Effect of Organic Coating of the Heterogeneous Ice Nucleation Efficiency of Mineral Dust Aerosols. Environ Res Lett. 2008;3:8. [Google Scholar]
- Park J, Rock JC, Wang L, Seo Y, Bhatnagar A, Kim S. Performance Evaluation of Six Different Aerosol Samplers in a Particulate Matter Generation Chamber. Atm Environ. 2009;43:280–289. [Google Scholar]
- Salter LF, Parsons B. Field trials of the TEOM and partisol for PM10 monitoring in the St. Austell china clay area, Cornwall, UK. Atm Environ. 1999;33:2111–2114. [Google Scholar]
- Thelan MK, Faulkner WB, Wanjura JD, Shaw BW, Parnell CB. Comparison of Measured Concentrations from Collocated TSP, PM10, and PM2.5 Samplers in the Presence of Agricultural Particulate Matter. Presented at ASABE Annual International Meeting; Reno, NV. 2009. [Google Scholar]
- Turner WA, Olson BA, Allen GA. Calibration of Sharp Cut Impactors for Indoor and Outdoor Particle Sampling. J Air & Waste Manage Assoc. 2000;50:484–487. doi: 10.1080/10473289.2000.10464043. [DOI] [PubMed] [Google Scholar]
- U.S. EPA, 40 CFR Part 50–Appendix B: Reference method for the determination of suspended particulate matter in the atmosphere (high volume method).
- U.S. EPA, 40 CFR Part 50–Appendix L: Reference method for the determination of suspended particulate matter in the atmosphere (high volume method).
- U.S. EPA, 40 CFR Part 53, Subpart D, Procedures for Testing Performance Characteristics of Methods for PM10, 52 FR 24729, 1987.
- Vanderpool RW, Peters TM, Natarajan S, Gemmill DB, Wiener RW. Evaluation of the Loading Characteristics of the EPA WINS PM2.5 Separator. J Aerosol Sci Technol. 2001;34:444–456. [Google Scholar]
- Vanderpool RW, Hanley T, Dimmick F, Hunike ET, Solomon PA, McElroy FF, Murdoch R, Natarajan S. Multi-Site Evaluation of Candidate Methodologies for Determining Coarse Particulate (PM10-2.5) Concentrations: August 2005 Updated Report Regarding Second-Generation and New PM10-2.5 Samplers. U.S. Environmental Protection Agency; Washington, DC: 2006. EPA/600/R-06/093 (NTIS PB2006-115765) [Google Scholar]
- Vanderpool RW. PM Sampling: Collaborative Study Between Texas A&M and the U.S. EPA. Proceedings from the USDA Agricultural Air Quality Task Force Meeting; Sacramento, CA. 2016. [Google Scholar]
- Vincent JH. Aerosol Sampling: Science, Standards, Instrumentation, and Applications. New York: John Wiley and Sons; 2007. [Google Scholar]
- Wang H, John W. Comparative Bounce Properties of Particle Materials. J Aerosol Sci Technol. 1987;7:285–299. [Google Scholar]
- Wang L, Parnell CB, Jr, Shaw BW. Performance Characteristics of Cyclones in Cotton-Gin Dust Removal. Agricultural Engineering International. The CIGR Journal of Scientific Research and Development. 2002 AugIV Manuscript BC 02 012. [Google Scholar]
- Wanjura JD, Parnell CB, Shaw BW, Lacey RE. Design and Evaluation of a Low-Volume Total Suspended Particulate Sampler. Transactions of the ASAE. 2005:1547–1552. [Google Scholar]
- Watson JG, Chow JC, Chen L, Wang X. Measurement System Evaluation for Fugitive Dust Emissions Detection and Quantification. Report to South Coast Air Quality Management District. 2010 https://www.dri.edu/images/stories/editors/eafeditor/Watsonetal2010SCAQMDFugDustReport.pdf.
- Wedding JB, McFarland AR, Cermak JE. Large Particle Collection Characteristics of Ambient Aerosol Samplers. Env Sci Technol. 1977;11:387–390. [Google Scholar]
- Whitby KT. The Physical Characteristics of Sulfur Aerosols. Atmos Environ. 1978;12:135–159. [Google Scholar]
- Wilson WE, Chow JD, Claiborn C, Fusheng W, Engelbrecht J, Watson JG. Monitoring for Particulate Matter Outdoors. Chemosphere. 2002;49:1009–1043. doi: 10.1016/s0045-6535(02)00270-9. [DOI] [PubMed] [Google Scholar]