Abstract
Self-assembling filamentous structures made of protein subunits are ubiquitous in cell biology. These structures are often highly dynamic, with subunits in a continuous state of flux, binding to and falling off the filament. In spite of this constant turnover of their molecular parts, many cellular structures seem to maintain a well-defined size over time, which is often required for their proper functioning. One widely discussed mechanism of size regulation involves the cell maintaining a finite pool of protein subunits available for assembly. This finite pool mechanism can control the length of a single filament by having assembly proceed until the pool of free subunits is depleted to the point when assembly and disassembly are balanced. Still, this leaves open the question whether the same mechanism can provide size control for multiple filamentous structures that are assembled from a common pool of protein subunits, as is often the case in cells. We address this question by solving the steady-state master equation governing the stochastic assembly and disassembly of multi-filament structures made from a shared, finite pool of subunits. We find that, while the total number of subunits within a multi-filament structure is well defined, individual filaments within the structure have a wide, power-law distribution of lengths. We also compute the phase diagram for two multi-filament structures competing for the same pool of subunits and identify conditions for coexistence when both have a well-defined size. These predictions can be tested in cell experiments in which the size of the subunit pool or the number of filaments with a multifilament structure is tuned within a cell.
I. Introduction
Actin and tubulin are nanometer sized proteins that polymerize in cells to form filaments that are hundreds of nanometers to microns in length. These filaments often associate with other proteins to form larger structures that perform critical roles in cell division, cell motility, and intracellular transport.1–3 They are highly dynamic, namely they experience a high turnover rate of their constitutive protein subunits.4,5 Despite this, in order to function properly some of these structures (e.g., the mitotic spindle, or actin cables in budding yeast5,6) must maintain specific and well-defined sizes. Because these structures are assembled through a series of stochastic binding and unbinding events, the number of subunits in a structure is not uniform in time or within a population. Therefore, a structure with a well-defined size is one for which the distribution of the number of subunits it contains is sharply peaked at a non-zero value, or in other words for which the fluctuations in their size over time, or over a cell population, are small compared to the mean size.
Many mechanisms for size regulation have been proposed based on careful experiments on cells and on reconstituted cellular structures in vitro.7 One method is to maintain a finite number of subunits within the compartment in which the structure is being assembled from the limited pool of subunits.8 Experimental evidence suggests that this mechanism is important in regulating the size of the mitotic spindle,9 as well as the size of nucleoli in a developing embryo.10 In this paper we develop a simple model of stochastic assembly and disassembly which we use to study this mechanism of size control in quantitative detail, with the ultimate goal of making testable predictions for future experiments.
The key assumption of the limited subunit-pool model is the presence of a constant number of subunits in a cell of constant size. Also inside the cell are nucleation sites for filament assembly; Figure 1(a). Within a single multifilament structure all the nucleation sites are equivalent, i.e., they all produce the same rate of filament assembly; Figure 1(c). We assume that the number of nucleation sites is constant within a single structure and that filaments only assemble at these sites; Figure 1(d). Note that this is a key difference with previously studied models of “living polymers” where it is assumed that subunits can freely associate with each other in solution to form filaments;11 this rarely, if ever, happens in cells.12 The rate of monomer addition to a filament in a structure depends on the number of free subunits in the cell, or generally the compartment in which the structure is being assembled. As structures grow they deplete the cell of subunits and their growth rate slows. Eventually the growth rate matches the rate of subunit dissociation and a steady state with a constant average size is reached; Figure 1(b). The stochastic nature of the assembly process leaves open the question: how large are fluctuations in size around the average? In other words, does the structure have a well defined size or not? This model has been well characterized when there is only one filament assembling at a nucleator. A closed form solution for the distribution describing the length of a single filament is easily computed using detailed balance. Depending on the values of the parameters that define the system it is possible to obtain length control of a single filament using this model.13 However, cytoskeleton structures in cells typically consist of many crosslinked and bundled filaments all made from the same protein subunit (e.g., actin or tubulin). Also, a single type of protein subunit may be used in the construction of a number of different structures depending on the regulatory proteins that associate with the filaments that make up the structure. Associated regulatory proteins include but are not limited to nucleators that act as sites for filaments to form (such as the Arp2/3 complex), elongators that increase the assembly rate of a filament (e.g. formins), cross-linking proteins that determine the topology of the structure (including α-actinin, filimin, and fimbrin), and degradation proteins that facilitate disassembly of filaments (cofilins).14,15 These observations motivate the key question we address herein, namely can a limited pool of subunits be used to regulate the size of multifilament structures?
Fig. 1.
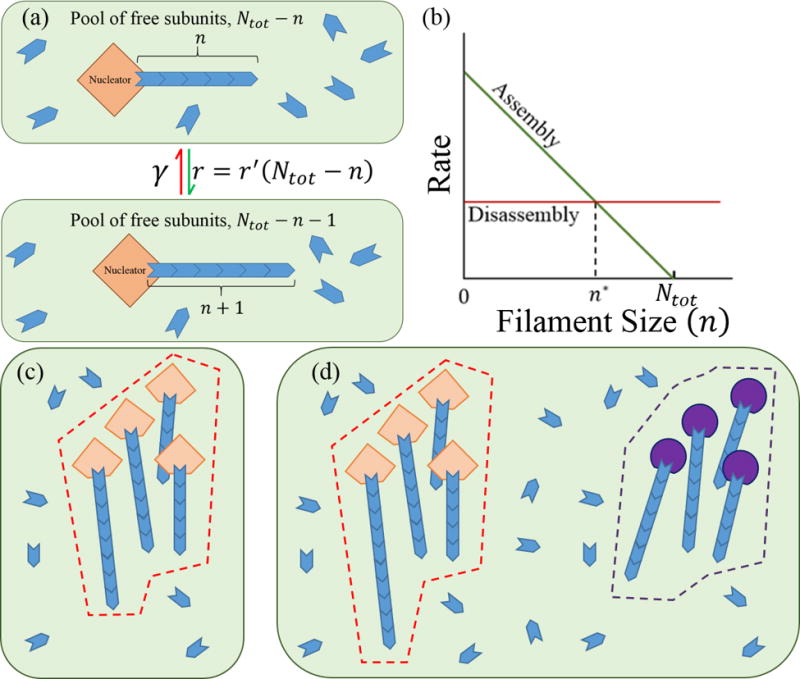
The finite subunit pool model. (a) A cartoon of filament assembly and disassembly for a single filament in a fixed volume (green box) containing a pool of Ntot subunits. We assume that filaments are assembled only at the nucleator. (b) Rate of assembly and disassembly as a function of the filament length for a single filament being assembled from a pool of subunits whose total number is Ntot; n* is the filament length in steady state when assembly and disassembly match up. (c) One multifilament structure (bounded by the dashed red line). All of the nucleators in the structure are identical and have assembly dynamics described in part a. (d) Two multifilament structures in a common pool of subunits. Each structure is assembled by only one type of nucleators; the purple nucleators are characterized by different rate of assembly and disassembly than the orange ones.
II. Methods and Theory
We consider a cell with Ntot subunits and Nf nucleators. Filaments can only assemble at the nucleators; Figure 1(c) and 1(d). Thus the filament associated with the ith nucleator can be referred to simply as the ith filament. The ith filament has a length ni, an assembly rate , and a disassembly rate γi. P(ni; t) is the probability that the ith filament has length ni at time t. Note that P(ni; t) is a marginal distribution of the joint distribution P({ni}; t). P({ni}; t) is the probability for the entire system to be in a state specified by the lengths of all the filaments, {ni} ≡ {n1, n2, …, ni, …, nNf} at time t. The joint distribution P({ni}; t) is the solution to the master equation
| (1) |
which simply enumerates all the changes in length that occur due to the elementary processes of subunit addition and removal shown in Figure 1(a).
The rate of subunit turnover is typically fast compared to the lifetime of many structures,16,17 and we therefore solve Eq. 1 at steady state, when the probability distribution becomes stationary in time, i.e. the time derivative in Eq. 1 is zero:
| (2) |
Here P({ni}) without the explicit dependence on t is the steady-state probability of finding the system in a state {ni}. Similarly, P(ni) will refer to the probability distribution of the ith filament having length ni in steady state. In order to solve Eq. (2) for P({ni}) it is helpful to rewrite it in the following manner:
| (3) |
Eq. (3) is a system of linear equations. To solve for P({ni}) we must also consider three additional constraints. First, if for any filament we have nj < 0 then P({ni≠j, nj < 0}) = 0, i.e. filaments do not have negative length. Likewise, if the total number of subunits in all filaments is greater than the total number of subunits in the cell, , then . Finally, we have normalization of the probability distribution,
| (4) |
Eq. (3) maps to a well-known problem in queuing theory18 for which the solution is known to be in product form:
| (5) |
The quantity v can be computed from the normalization condition given in Eq. (4):
| (6) |
It’s a simple matter to check our solution by substituting Eq. (5) back into Eq. (3) and (4). Since Eq.(3) are linear in P({ni}) we know that our solution is unique.
Next we compute the distribution for the sizes of structures made up of filaments; see Figure 1(c) where we illustrate two structures each consisting of a number of filaments. This distribution can be constructed from Eq. (5). Because each individual structure has only one type of nucleator associated with all the filaments then all filaments in a given structure have the same values of the assembly and disassembly rates, and γi. To differentiate structures from filaments we use Latin letter subscripts to denote filaments and Greek letter subscripts to denote structures. For each structure we define where and γλare the assembly and disassembly rates for the filaments in λth structure, and αλ is the total number of nucleators/filaments associated with the λth structure. κD,λ is the critical number of free subunits for a filament within the structure λ, for which the rate of assembly and disassembly are equal, . The critical number κD,λ is also a dimensionless dissociation constant and related to the true, chemical dissociation constant KD,λ (in molar units) for the chemical reaction of subunit addition to a filament shown in Figure 1(a), KD,λ = κD,λ⁄(NAvagadro ∗ VCell); here NAvagadro is Avogardo’s number and VCell is the volume of the cell (in liters). The total number of subunits in the λth structure is denoted Nλ ≡ Σjnj where j enumerates the filaments in the λth structure; Nλ is the measure of the λth structure’s size that we adopt and the sought distribution of structure sizes is P({Nλ}).
P({Nλ}) is the sum of P({nj}) over all states {nj} that correspond to a state {Nλ}. For each {nj} corresponding to a particular {Nλ} we have the same number of free subunits. Also, while the values of each nj may vary between different {nj} we know that all nj corresponding to a particular Nλ have Σjnj = Nλ. Thus we can rewrite Eq. (5) in terms of Nλ and κD,λ.
| (7) |
where Ns is the number of structures in the cell (e.g., Ns = 2 in Figure 1(d)).
From Eq. (7) we see that the sum P({nj}) over all {nj} corresponding to a given {Nλ}, which gives the sought P({Nλ}), has a constant summand. Hence to complete the sum we only need to count the number of states {nj} that correspond to a fixed {Nλ} and then multiply that by the right hand side of Eq. (7). The solution to this counting problem is the binomial coefficient where αλ is the number of filaments within the structure λ. Finally we obtain for the distribution of multi-filament structure sizes in steady state
| (8) |
III. Results
Eq. (5) and (8) are exact, closed-form steady-state distributions for the lengths of multiple filaments, and the sizes of multi-filament structures, all competing for the same finite pool of subunits. There are two special cases of Eq. (8) that are of particular interest given the kinds of structures that are found in cells. The first is a single multifilament structure (e.g., mitotic spindle), and second is two competing multifilament structures (e.g., actin patches and actin cables in yeast). We examine each of these cases below.
Single Multifilament Structure
The single structure case is represented in our model by setting Ns = 1 in Eq. 8:
| (9) |
here N denotes the size of the structure, and α is the number of filaments/nucleators within this structure. This case also allows for a more concise formula of the normalization constant v in terms of special functions:
| (10) |
where U(a, b, z) is Tricomi’s confluent hypergeometric function.19
The marginal distribution P(ni) for the length of a single filament in this multi-filament structure comprised of α filaments is:
| (11) |
For ni < Ntot − κD there is a simple approximate form for this distribution P(ni)⁄P(0) ∝ ((Ntot − κD − ni)⁄(Ntot − κD))α−2, which we compare to the exact expression in Figure 2.
Fig. 2.
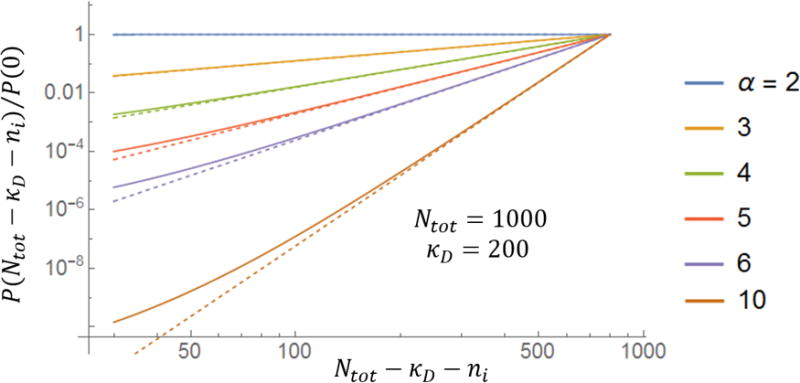
Exact and approximate (asymptotic) formulas for the length distribution filaments in a multi-filament structure. Full lines correspond to the exact formula, Eq. (11), while the dashed lines are the asymptotic formula for a large number of subunits ((Ntot − κD − ni)⁄(Ntot − κD))α−2. Differences between the two formulas are not visible on a linear plot which is why a log-log plot is shown here.
We conclude that the filaments in a multifilament structure whose size is controlled by a finite pool of assembling subunits have a broad, power-law distribution of lengths. The power is given by the number of filaments in the structure (which is controlled by the number of nucleating centers) less two. A broad (fitting an exponential) distribution of microtubule lengths was recently measured for spindles assembled in frog extracts,20 in qualitative agreement with our findings. Clearly much more work needs to be done to make a more meaningful comparison with the theory presented here and experiments such as this.
Two Multifilament Structures
We examined the distribution of sizes of two structures each consisting of a number of filaments using Eq. (8) for a variety of model parameters. In Figure 3 we illustrate our results when we vary the number of filaments within a structure (αλ) and the dimensionless dissociation constant for the filaments within a structure (κD,λ). For each of the two structures there are two possible outcomes depending on the values of the model parameters: either the structure has a well-defined size (illustrated in Figure 3 with a blue filament associated with a nucleator), meaning that the steady state distribution of the number of monomers within that structure is peaked around a non-zero value, or the distribution of sizes is monotonically decreasing with zero being the most likely size (illustrated in Figure 3 with a nucleator devoid of filament). Notably, we find regions of parameter space where the two structures both with a well-defined size can coexist. This proves that the finite subunit pool mechanism is capable of controlling the size of multiple multi-filament structures.
Fig. 3.
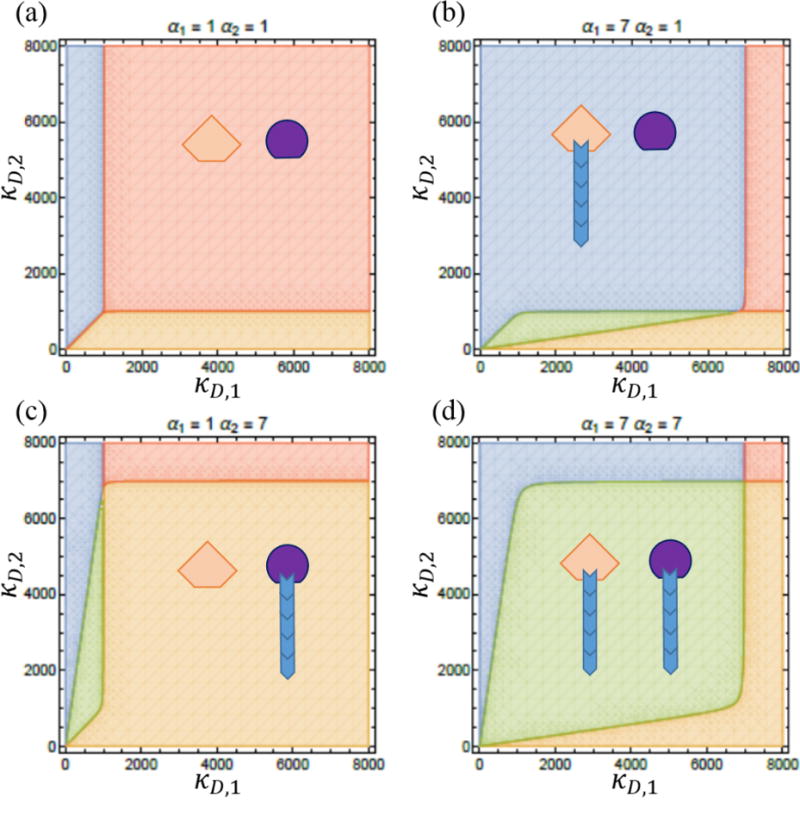
Phase diagrams for two multifilament structures. Blue regions correspond to parameter values for which the size of structure one is well defined, but not so for structure two. The orange region is when structure two has a well-defined size and structure one does not. In the red region neither structure has a well-defined size, and in the green region both structures have well-defined sizes. (a) For α1 = α2 = 1 when each of the two structures has only one filament there is no blue region, i.e. the two filaments cannot both have a well-defined length in common pool of subunits. (b)–(d) As αλ is increased we see a region of coexistence appear. We also see that the region where neither structure is well-defined gets smaller. In all plots Ntot = 1000.
Using the exact distributions described above we can also compute the dependence of the mean size of a structure on model parameters, as well as its standard deviation around the mean. We characterize how well-defined a structure is by considering the noise of the length distribution of the structure, which is defined by the ratio of the standard deviation, , and the mean size 〈Nλ〉. An exponential distribution is characterized by a noise of one, meaning that the fluctuations in size about the mean are on the same scale as the mean size itself. For a structure to be well-defined its noise should be small compared to one.
In Figure 4 we we show how mean structure size 〈Nλ〉 changes with the total number of subunits Ntot for a few different values of αλ, the number of filaments within a structure. In Figure 4(b) we observe that changing Ntot changes the relative sizes of the two structures. For small Ntot structure two is larger, but as Ntot increases structure one becomes larger, i.e., it takes up more monomers from the subunit pool. The structure with the smaller critical number of subunits (κD,1) approaches a linear dependence of its size on Ntot while the other structures plateaus to a value that’s independent of the total number of subunits.
Fig. 4.
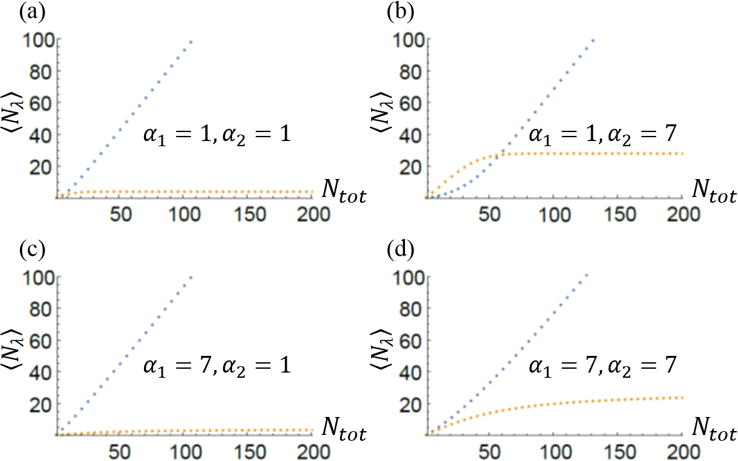
Mean sizes of two multi-filament structures competing for the same monomer pool. Blue line corresponds to structure one with κD,1 = 4, and the orange line is associated with structure two with κD,2 = 5. In all plots (a)–(d) we see that as Ntot increases 〈N1〉 becomes linear in Ntot while 〈N2〉 appears to approach a constant value. Changing the number of filaments in either structure (αλ) appears to affect how quickly the large Ntot behavior sets in. Larger values of αλ seem to push the large Ntot limit toward higher values of Ntot. Comparing (a) and (c) with (b) and (d) we also conclude that increasing α2 increases the final value of 〈N2〉 as Ntot becomes very large. It also appears that the increase in linear; for Ntot = 200 in (a) 〈N2〉 = 4 while in (b) at Ntot = 200 〈N2〉 = 28. This is a seven-fold increase in structure size as α2 goes from one to seven. This trend holds true for all values of α2 between one and seven.
Figure 5 shows the dependence of the noise on Ntot for the same parameters as in Figure 4. In all plots the noise for structure one, which is the structure with the smaller critical subunit number, goes to zero as the total number of subunits increases while the noise for structure two goes to a non-zero constant whose value depends on the number of filaments in structure two (α2).
Fig. 5.
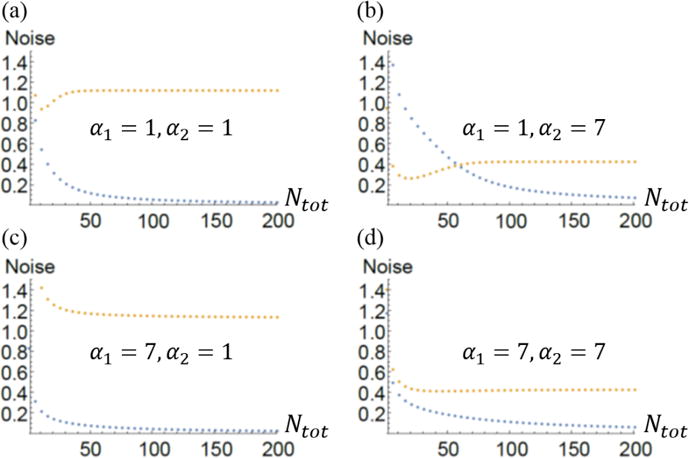
Noise of the size distribution for two multifilament structures. Blue is structure one with κD,1 = 4 and orange is structure two with κD,2 = 5. In (a) and (c) the noise for structure two is large (of order unity). This is expected since for α2 = 1 we expect structure two to be ill-defined since κD,1 < κD,2. In (b) and (d) the asymptotic value of the noise in structure two is less than one. In plots (a), (b), and (d) the noise for structure two drops to a minimum before increasing to its asymptotic value. In plot (c) it appears as though the noise for structure two drops monotonically to its asymptotic value.
Discussion
We have found exact closed-form solutions for the distribution of filament lengths in a system where growth is only limited by a finite pool of subunits. From this distribution we found that limiting the pool of subunits is not sufficient to regulate the lengths of each individual filament. In spite of this, when multiple filaments are considered as parts of a multi-filament structure the overall size of the structure can be well-defined. This means that despite the model’s simplicity, the finite pool of subunits is sufficient to simultaneously regulate the sizes of multiple multi-filament structures. Also, because of this model’s simplicity it is straightforward, to make testable predictions about filamentous protein structures in vivo and in vitro. In particular, we find that the total number of subunits, Ntot, number of nucleators for a structure, αλ, and the ratio of disassembly rate to assembly rate (the critical number of subunits), κD,λ, all play a role in the size and variability of structures. Experiments on actin structures in yeast have also found that these parameters are relevant to the regulation of structure sizes14,15 but more work on the theoretical and the experimental front is needed before detailed, quantitative comparisons between theory and experiment can be made.
References
- 1.Kovar DR, Sirotkin V, Lord M. Three’s company: the fission yeast actin cytoskeleton. Trends Cell Biol. 2011;21:177–187. doi: 10.1016/j.tcb.2010.11.001. [DOI] [PMC free article] [PubMed] [Google Scholar]
- 2.Pollard TD, Borisy GG. Cellular Motility Driven by Assembly and Disassembly of Actin Filaments. Cell. 2003;112:453–465. doi: 10.1016/s0092-8674(03)00120-x. [DOI] [PubMed] [Google Scholar]
- 3.Pollard TD, Blanchoin L, Mullins RD. Molecular mechanisms controlling actin filament dynamics in nonmuscle cells. Annu Rev Biophys Biomol Struct. 2000;29:545–576. doi: 10.1146/annurev.biophys.29.1.545. [DOI] [PubMed] [Google Scholar]
- 4.Fletcher DA, Mullins RD. Cell mechanics and the cytoskeleton. Nature. 2010;463:485–492. doi: 10.1038/nature08908. [DOI] [PMC free article] [PubMed] [Google Scholar]
- 5.Needleman DJ, Farhadifar R. Mitosis: Taking the Measure of Spindle Length. Curr Biol. 2010;20:R359–R360. doi: 10.1016/j.cub.2010.02.054. [DOI] [PubMed] [Google Scholar]
- 6.Mohapatra L, Goode BL, Kondev J. Antenna Mechanism of Length Control of Actin Cables. PLoS Comput Biol. 2015;11 doi: 10.1371/journal.pcbi.1004160. [DOI] [PMC free article] [PubMed] [Google Scholar]
- 7.Michelot A, Drubin DG. Building distinct actin filament networks in a common cytoplasm. Curr Biol CB. 2011;21:R560–569. doi: 10.1016/j.cub.2011.06.019. [DOI] [PMC free article] [PubMed] [Google Scholar]
- 8.Goehring NW, Hyman AA. Organelle Growth Control through Limiting Pools of Cytoplasmic Components. Curr Biol. 2012;22:R330–R339. doi: 10.1016/j.cub.2012.03.046. [DOI] [PubMed] [Google Scholar]
- 9.Good MC, Vahey MD, Skandarajah A, Fletcher DA, Heald R. Cytoplasmic volume modulates spindle size during embryogenesis. Science. 2013;342:856–860. doi: 10.1126/science.1243147. [DOI] [PMC free article] [PubMed] [Google Scholar]
- 10.Weber SC, Brangwynne CP. Inverse Size Scaling of the Nucleolus by a Concentration-Dependent Phase Transition. Curr Biol. 2015;25:641–646. doi: 10.1016/j.cub.2015.01.012. [DOI] [PMC free article] [PubMed] [Google Scholar]
- 11.Dill KA, Bromberg S. Molecular Driving Forces: Statistical Thermodynamics in Chemistry and Biology. Garland Science; 2003. [Google Scholar]
- 12.Alberts B, et al. Molecular Biology of the Cell. Garland Science; 2015. [Google Scholar]
- 13.Mohapatra L, Goode BL, Jelenkovic P, Phillips R, Kondev J. Design Principles of Length Control of Cytoskeletal Structures. Annu Rev Biophys. 2016;45 doi: 10.1146/annurev-biophys-070915-094206. null. [DOI] [PMC free article] [PubMed] [Google Scholar]
- 14.Burke TA, et al. Homeostatic actin cytoskeleton networks are regulated by assembly factor competition for monomers. Curr Biol CB. 2014;24:579–585. doi: 10.1016/j.cub.2014.01.072. [DOI] [PMC free article] [PubMed] [Google Scholar]
- 15.Suarez C, et al. Profilin Regulates F-Actin Network Homeostasis by Favoring Formin over Arp2/3 Complex. Dev Cell. 2015;32:43–53. doi: 10.1016/j.devcel.2014.10.027. [DOI] [PMC free article] [PubMed] [Google Scholar]
- 16.Fritzsche M, Lewalle A, Duke T, Kruse K, Charras G. Analysis of turnover dynamics of the submembranous actin cortex. Mol Biol Cell. 2013;24:757–767. doi: 10.1091/mbc.E12-06-0485. [DOI] [PMC free article] [PubMed] [Google Scholar]
- 17.Goode BL, Eskin JA, Wendland B. Actin and Endocytosis in Budding Yeast. Genetics. 2015;199:315–358. doi: 10.1534/genetics.112.145540. [DOI] [PMC free article] [PubMed] [Google Scholar]
- 18.Kelly FP. Reversibility and Stochastic Networks. Cambridge University Press; 2011. [Google Scholar]
- 19.Weisstein EW. Confluent Hypergeometric Function of the Second Kind. Available at: http://mathworld.wolfram.com/ConfluentHypergeometricFunctionoftheSecondKind.html. (Accessed: 29th February 2016)
- 20.Brugués J, Nuzzo V, Mazur E, Needleman DJ. Nucleation and Transport Organize Microtubules in Metaphase Spindles. Cell. 2012;149:554–564. doi: 10.1016/j.cell.2012.03.027. [DOI] [PubMed] [Google Scholar]


