

Abstract
The world’s smallest fishes belong to the genus Paedocypris. These miniature fishes are endemic to an extreme habitat: the peat swamp forests in Southeast Asia, characterized by highly acidic blackwater. This threatened habitat is home to a large array of fishes, including a number of miniaturized but also developmentally truncated species. Especially the genus Paedocypris is characterized by profound, organism-wide developmental truncation, resulting in sexually mature individuals of <8 mm in length with a larval phenotype. Here, we report on evolutionary simplification in the genomes of two species of the dwarf minnow genus Paedocypris using whole-genome sequencing. The two species feature unprecedented Hox gene loss and genome reduction in association with their massive developmental truncation. We also show how other genes involved in the development of musculature, nervous system, and skeleton have been lost in Paedocypris, mirroring its highly progenetic phenotype. Further, our analyses suggest two mechanisms responsible for the genome streamlining in Paedocypris in relation to other Cypriniformes: severe intron shortening and reduced repeat content. As the first report on the genomic sequence of a vertebrate species with organism-wide developmental truncation, the results of our work enhance our understanding of genome evolution and how genotypes are translated to phenotypes. In addition, as a naturally simplified system closely related to zebrafish, Paedocypris provides novel insights into vertebrate development.
Keywords: progenesis, Cyprinidae, transposable elements, evolution
Introduction
The developmental mechanisms that determine how genotypes translate into phenotypes and how selection acts on phenotypes to shape morphological differences are central to our understanding of the diversity of living organisms (Carroll et al. 2007; Moczek et al. 2011). Model organisms have been instrumental in our quest to decipher how genetic differences are associated with morphological and physiological disparity (Braasch et al. 2015), and improved technologies for genetic modifications will aid in further elucidating genotype–phenotype interrelations (Shalem et al. 2015). One interesting example is the recent work by Nakamura et al. (2016), which utilized CRISPR-Cas9 to knock out three Hox13 copies (Aa, Ab, and D) in zebrafish (Danio rerio) to investigate the role of these genes in the transition from fins to limbs. Although experiments like these are now feasible, the pleiotropic effects of genes involved in fundamental developmental processes, such as those of the large Hox gene family, present challenges and limitations to the phenotypic variation that can easily be induced in model organisms through genetic engineering. Examining naturally occurring extreme phenotypes in close relatives of model organisms thus provides a novel source of phenotypic and genotypic variation that is becoming increasingly important in improving our understanding of the molecular basis of evolutionary changes (Streelman et al. 2007).
Discovered ∼200 years ago (Hamilton 1822), the zebrafish has been used as a model organism since the 1960s and is currently one of the most important models for in vivo studies of vertebrate development, genome evolution, toxicology, physiology, behavior, and disease (Howe et al. 2013; Kettleborough et al. 2013). Comparative efforts have so far focused on closely related Danio species (McMenamin et al. 2014; McCluskey and Postlethwait 2015), but recent studies have revealed that the diversity of zebrafish mutants is surpassed by the range of phenotypic variation among several of its related species in the wild (Patterson et al. 2014; Braasch et al. 2015; Parichy 2015). Some of these other members of Cyprinidae (e.g., Paedocypris, Sundadanio, and Danionella) are characterized by developmental truncation (Rüber et al. 2007; Britz and Conway 2009, 2016; Britz et al. 2014) and morphological novelties (Conway and Britz 2007; Britz and Conway 2016; Conway et al. 2017) and thus offer additional, underappreciated potential for comparative studies and promise fundamental advances in our understanding of the molecular underpinnings of evolutionary change leading to novelty and adaptation (Braasch et al. 2015).
Otophysan fishes, which includes Cyprinidae, represents one of the oldest teleostean lineages, and its phylogeny remains controversial (Rüber et al. 2007; Fang et al. 2009; Tang et al. 2010; Stout et al. 2016; Arcila et al. 2017; Chakrabarty et al. 2017; Hirt et al. 2017). One taxon that is particularly difficult to place confidently is the recently discovered, miniaturized, dwarf minnow genus Paedocypris (Rüber et al. 2007; Mayden and Chen 2010; Britz et al. 2014; Stout et al. 2016; Arcila et al. 2017) found in the highly acidic blackwaters of endangered peat swamp forests in Southeast Asia. This genus of tiny vertebrates includes the world’s smallest fish, maturing at ∼8 mm (Kottelat et al. 2006). Paedocypris exhibits an extreme case of organism-wide progenesis or developmental truncation, resulting in an anatomical adult condition closely resembling that of a 7.5 mm zebrafish larva, with over 40 bones never being developed (Britz et al. 2014). To investigate the genomic signatures of developmental truncation in a vertebrate species for the first time, we sequenced and compared the genomes of two representatives of the genus Paedocypris; P. carbunculus and P. micromegethes. The genome signatures of these two species allow the distinction of genus-specific from species-specific genomic changes and thus enable identification of features associated with the extreme phenotype of Paedocypris. By comparing their genomes with those of other teleosts, including the closely related zebrafish, we identify Paedocypris-specific genomic signatures of developmental truncation in the form of loss of various key developmental genes, including at least seven of the otherwise highly conserved Hox genes, mirroring their progenetic phenotype. We further demonstrate how the Paedocypris genome size has been reduced through evolution of shorter genes due to significantly shorter introns compared with zebrafish, whereas exon lengths and gene numbers have remained relatively unchanged. We find that the Paedocypris genomes are comparable in size and gene structure (i.e., short introns and compact genomes) to those of the two pufferfish species Takifugu rubripes and Dichotomyctere nigroviridis, which feature the smallest vertebrate genomes known (Jaillon et al. 2004). Additionally, we show that the accumulation of transposable elements (TEs), especially DNA transposons, is very low, following the diversification of the genus Paedocypris, and propose a potential mechanism for enhanced transposon-silencing activity through duplication of the PIWI-like (PIWIl1) gene in this lineage. Highly progenetic fish species like Paedocypris will be important resources for future studies on vertebrate development, presenting a novel opportunity to investigate phenotype–genotype relationships in early vertebrate development and the genetic mechanisms of developmental truncation.
Materials and Methods
Specimens Used
Paedocypris carbunculus was collected at the type locality in Pangkalanbun, Kalimantan Tengah, on the island of Borneo and P. micromegethes was caught in Sibu, Sarawak, Malaysia, on the island of Borneo. Both species were caught using dip nets. Immediately upon capture, specimens were killed by an overdose of anesthesia (MS222) following guidelines by the American Fisheries Society (2014). Individuals were preserved in 96% ethanol for subsequent DNA analyses.
DNA Isolation
A single whole specimen of each Paedocypris species, stored on 96% ethanol, was used for isolation of high molecular genomic DNA with the EZNA Tissue DNA Kit (Omega Bio-Tek, Norcross, GA), following manufacturers' instructions. Sample identifiers were LR12004 (Paedocypris carbunculus) and LR7898 (Paedocypris micromegethes), supplied by Lukas Rüber.
Library Preparation and Sequencing
Genomic DNA samples were fragmented to lengths of ∼550 bp by sonication on a Covaris E220 (Life Technologies, Carlsbad, CA) with the following settings: 200 cycles for 45 seconds with Peak Incident Power of 175 W and frequency sweeping mode. All sequencing libraries were constructed following Illumina’s TrueSeq PCR-free library preparation protocol for 550-bp fragments.
The sequencing was conducted on the Illumina HiSeq 2500 platform, using the Illumina 500 cycles kit (Rapid mode) with on-board clustering. The Kapa Library quantification kit for Illumina (Kapa Biosciences, Wilmington, MA) was used to find the correct molarity (nM) before sequencing.
Assembly Quality Assessment
Prior to assembling the sequenced reads, PreQC (Simpson 2014) was used to estimate the coverage, per-base error rates, heterozygosity levels, and genome size based on the k-mer distribution. The quality of the different genome assemblies was assessed by comparing the proportion of conserved genes detected, as a measure of gene-space completeness. We used the program BUSCO v2.0 (Benchmarking Universal Single-Copy Orthologs) (Simão et al. 2015), which searches for 4,584 highly conserved single-copy actinopterygian genes (additional file 1: supplementary note S4, Supplementary Material online).
We also assessed the assembly quality of the three different assembly versions with the software FRCbam (Vezzi et al. 2012), which identifies “features” (incorrectly mapped reads, incorrect insert size, and coverage issues) in each of the assemblies, and ranks the different assembly versions according to the number of detected features. Additional information on the execution of these programs is available in the additional file 1: supplementary note S5, Supplementary Material online, and the resulting graphs are presented in additional files 3 and 4: supplementary figures S1 and S2, Supplementary Material online.
Hox Gene Search
In addition to the two Paedocypris genomes, Hox gene content was also investigated in the genomes of Pimephales promelas (GCA_000700825.1_FHM_SOAPdenovo_genomic.fna) and Leuciscus waleckii (GCA_900092035.1_Amur_ide_genome_genomic.fa) based on BLAST (Altschul et al. 1990) searches, using 70 zebrafish Hox transcripts from Ensembl as queries (including some truncated variants and isoforms), representing the 49 unique Hox genes (additional file 2: supplementary table S2, Supplementary Material online). The similarity stringency threshold used in these searches was 1e−20. We also conducted additional searches using Exonerate (v. 2.2.0) (Slater and Birney 2005) for genes whose presence could not be established based on the BLAST search. For those genes that could not be detected using either method, additional searches were conducted using the orthologous protein sequence from the cave tetra (Astyanax mexicanus). Additionally, tblastn (Altschul et al. 1990) was used to search for additional homeodomain using the homeodomain consensus sequence from https://.pfam.xfam.org/, last accessed December 13, 2017 (RRRKRTAYTRYQLLELEKEFHFNRYLTRRRRIELAHSLNLTERHIKIWFQNRRMKWKKEN).
Contiguous sequences from both Paedocypris genomes were extracted from the scaffolds assembled with Metassembler, spanning all hit regions plus 10 kb upstream and downstream of each hit. These scaffold sequences were aligned to the orthologous sequences extracted from the zebrafish genome (GRCz10) using AVID (Bray et al. 2003) and visualized with mVista (Frazer et al. 2004).
Identification of Lost and Expanded Developmental Genes
In order to obtain a complete list of genes from D. rerio that were associated with various developmental pathways that could be compromised in Paedocypris, we started out with the orthogroups found not to contain orthologs from either Paedocypris species, as identified using OrthoFinder (Emms and Kelly 2015). We further utilized the gene ontology information associated with all genes belonging to these orthogroups, and identified key gene ontology terms: GO: 0009948 (anterior–posterior axis formation), GO: 0009950 (dorsal–ventral axis formation), GO: 0040007 (growth), GO: 0007517 (muscle organ development), GO: 0007399 (nervous system development), GO: 0001501 (skeletal system development), and GO: 0007379 (segment specification). This data set contained 1,581 unique genes from D. rerio, and 64 of these genes could not be detected in the Paedocypris genome sequences using tblastn with a similarity cutoff of 1e−20, and their presence was further examined by running Exonerate (Slater and Birney 2005) (v2.2.0). Based on the Exonerate results, reciprocal BLAST searches, annotation, and identification of flanking genes, we could confidently determine that 15 of these genes were indeed not present in either of the Paedocypris genomes. Using expression data from Ensembl (Cunningham et al. 2015), we reconstructed the hypothetically affected body segments in Paedocypris, as illustrated in figure 2b.
Fig. 2.

—Gene loss and duplication of developmental process genes. (a) Five-species comparison of shared orthogroups for the identification of genes lost in Paedocypris. Bold numbers represent orthogroups without any Paedocypris orthologs. Orthogroups were identified using OrthoFinder (Emms and Kelly 2015) on the basis of full protein data sets for all included species. (b) Lost developmental pathway genes and schematic representation of phenotypically affected body segments in Paedocypris. (c) Gene duplicates retained in Paedocypris. (d) Genus-specific gene duplications. Genes in bold are associated with a truncated phenotype in Danio rerio.
We further investigated whether we could confidently identify developmental genes that are now duplicated in Paedocypris but not in D. rerio. From the full list of orthogroups, we identified 138 groups that were represented by a single copy in the two tetraodontid pufferfishes and in D. rerio, but by two apparent copies in both Paedocypris species. The alignments of these genes were then screened for missing data, and based on manual inspection of these alignments, only alignments with < 35% missing data were included in further analysis. Out of the 35 genes that met this criterion, 19 could be confirmed through annotation, and had a gene tree consistent with the two hypotheses outlined in figure 2c and d.
Gene Space Evolution
In order to assess the changes of gene-, exon-, and intron sizes in Paedocypris, we first identified the proteomic overlap of Paedocypris, D. rerio, Di. nigroviridis, and T. rubripes by running the software OrthoFinder (Emms and Kelly 2015) on the complete protein sets of these five species. We used the full protein sets from Ensembl (Cunningham et al. 2015) (v. 80): D. rerio (GRCz10), Di. nigroviridis (TETRAODON8), and T. rubripes (FUGU4). However, as some of the D. rerio genes have more than one protein or transcript in the Ensembl database, the output from BioMart (31,953 genes and 57,349 proteins) was filtered so that only the longest protein sequence from each gene was used in the analysis, and genes without protein sequences were removed. This resulted in a set of 25,460 genes with a single protein prediction. For the two Paedocypris species, the “standard” gene sets resulting from the annotation were used as input. These sets were filtered to include only genes with AED (Annotation Edit Distance) scores < 1 or those with a Pfam domain. By using only genes belonging to the 10,368 orthogroups found to contain orthologs from all these species (fig. 2a), we obtained a comprehensive but conservative data set as the basis for these analyses. Information about each of the corresponding genes in D. rerio, Di. nigroviridis, and T. rubripes was obtained from BioMart, and included the Ensembl gene and protein ID, and the chromosome name in addition to the start and stop position for each gene, transcript, and exon. Intron sizes were then calculated on the basis of exon positions, using a custom script (“gene_stats_from_BioMart.rb”). In some cases, the sum of exons and introns did not equal the total length of a gene, which appears to be caused by inconsistency in the registration of UTR regions in the Ensembl database for individual genes. In these cases, to be conservative with regard to intron length estimates, the gene length was shortened to correspond to the sum of the exons and the corresponding introns between these.
Intron and exon lengths for the two Paedocypris species were calculated in a similar manner, but on the basis of the “standard” filtered annotation file in “gff” format produced as part of the annotation pipeline. In addition, for these species, the intron lengths were determined on the basis of identified exons, with another custom script (“gene_stats_from_gff.rb”). Gene-, exon-, and intron length histograms were plotted with the R package ggplot2.
Repeat Content Analysis
The repeat contents of the two Paedocypris genomes and the model organism genomes were assessed using RepeatMasker (v. 4.0.6) (Smit and Hubley 2017) with the Danio-specific repeat library included in the program, and with the “-s” setting to increase sensitivity. The following model organism genome assemblies were used in this comparison: Danio rerio (Danio_rerio.GRCz10.dna.toplevel.fa), Pimephales promelas (GCA_000700825.1_FHM_SOAPdenovo_genomic.fna), Leuciscus waleckii (GCA_900092035.1_Amur_ide_genome_genomic.fa), Sinocyclocheilus grahami (GCA_001515645.1_SAMN03320097.WGS_v1.1_genomic.fna), Cyprinus carpio (GCA_001270105.1_ASM127010v1_genomic.fna), and Astyanax mexicanus (Astyanax_mexicanus.AstMex102.dna.toplevel.fa). Repeat landscape graphs (fig. 4a) were plotted with the R package ggplot2 based on the “.aligned” output file from RepeatMasker. The proportion of repeats originating from specific time intervals was calculated following Kapusta et al. (2017), using the parseRM.pl script (Kapusta 2017), the Paedocypris-specific substitution rate, and the “–age” setting set to “12.31, 79.98,” according to divergence times estimated with BEAST 2 (v. 2.4.5) (Bouckaert et al. 2014). All four repeat classes were analyzed individually using the “–contain” setting.
Fig. 4.

—Repeat landscape graphs of Danio-specific TEs in Paedocypris compared with six other otophysan genome assemblies. (a) Phylogeny with divergence times for the internal nodes for the eight species analyzed. Colored numbers on the branch leading to Paedocypris show the percentages of each of the corresponding repeat classes that originate from the time interval corresponding to this branch (117.7–79.9, 79.9–12.3, and more recent than 12.3 Ma). Repeat landscapes represent transposable elements of the four main classes as well as the unclassified ones. The x-axis indicates the Kimura (1980) distance as a proxy for time, whereas the y-axis gives the relative coverage of each repeat class based on the genome size. (b) Total number of Danio-specific repetitive elements in each of the assemblies and the reconstructed values for the internal nodes; colored by class. Proportional change in genome size (c) and total number of TEs (d), for each of the braches in the phylogeny, based on ancestral state reconstructions assuming a Brownian Motion model of trait evolution (additional file 2: supplementary table S10, Supplementary Material online).
Species-specific repeat libraries were created for all eight species used in the comparative analysis using RepeatModeler (Smit and Hubley 2017) (v. 1.0.8). As RepeatModeler runs RepeatScout on only a small fragment of the assemblies (40 kB), we aimed to direct the repeat searches to the best part of each genome in order to get as complete repeat structures as possible. Thus, RepeatModeler was executed on a reduced genome assembly consisting of the sequences included in the N50-scaffolds. The species-specific repeat libraries were merged with the Danio-specific repeat library prior to running RepetMasker (Smit et al. 2017). Results are listed in additional file 2: supplementary table S7, Supplementary Material online and illustrated in additional file 5: supplementary figure S3, Supplementary Material online, in comparison to the results obtained when using only the Danio-specific library.
Calculation of Substitution Rate for Paedocypris
The Paedocypris-specific substitution rate was calculated on the basis of a whole-genome alignment of the two Paedocypris species. These alignments were created by mapping the sequencing reads of P. micromegethes to the P. carbunculus assembly using Burrows–Wheeler Aligner (v. 0.7.12) (Li and Durbin 2009) and SAMTOOLS (v. 1.3.1) (Li et al. 2009; Li 2011). The number of nucleotide differences in each of the 18,953 alignments (one per scaffold) was identified using a custom script (“find_variable_sites.rb,” available for download at https://github.com/uio-cees/Paedocypris_gene_stats). The substitution rate per million years (0.001288) was then calculated as the sum of total differences (13,415,043) divided by the total number of aligned sites (422,829,036) and two times the estimated crown age of Paedocypris (12.31), as inferred by the BEAST v.2.4.5 (Bouckaert et al. 2014) analysis.
Phylogenetic Inference of Selected Otophysan Species
To allow the estimation of divergence times between the two Paedocypris species and six other otophysan taxa for which genomic resources were available (D. rerio, A. mexicanus, C. carpio, Pi. promelas, S. grahami, and L. waleckii), we followed the pipeline for phylogenetic marker selection presented in Malmstrøm et al. (2016, 2017) with few modifications. These modifications included the following changes: Marker selection began with a set of 3,238 cave fish (A. mexicanus) exons, for which at least five orthologs were known among the seven species D. rerio, Gadus morhua, Gasterosteus aculeatus, Oreochromis niloticus, Oryzias latipes, Poecilia formosa, and T. rubripes, according to version 87 of the Ensembl database. This marker set was then used to identify potential orthologs from the genomes of the eight selected otophysan taxa based on tblastn searches followed by a strict filtering procedure. Compared with Malmstrøm et al. (2016), we applied a lower dN/dS threshold of 0.25 to exclude markers potentially affected by positive selection, and we removed all markers for which no homologs could be detected in one or more of the eight otophysan genomes. We also applied stricter thresholds on clock-like evolution of candidate markers, so that all genes with an estimated coefficient of rate variation >0.8 as well as those with a mean mutation rate >0.0004 per site per million years were excluded. We identified 138 genes with a total alignment length of 135,286 bp which were subsequently used for analysis with BEAST 2. Since the topology of otophysan taxa has previously been resolved with a more comprehensive phylogenetic data set (Stout et al. 2016), we here focused on the inference of divergence times only, by using the topology inferred by Stout et al. (2016) as a starting tree and excluding all of BEAST 2’s operators on the tree topology. Divergence times were estimated by calibrating the most recent common ancestor of Cypriniformes and Characiformes with a lognormal distribution centered at 121 Ma (standard deviation on log scale: 0.1) according to the results of Malmstrøm et al. (2016). We performed two replicate BEAST 2 analyses with 800 million MCMC iterations, of which the first 100 million were discarded as burnin. Convergence was assessed based on similarity of parameter traces between run replicates and effective sample sizes (ESS) >200. A maximum clade credibility (MCC) summary tree with node heights according to mean age estimates was produced with TreeAnnotator (v. 2.1.2) (Bouckaert et al. 2014).
Transitions/Transversions Ratio
To further validate the integrity of the Paedocypris genome assemblies, we investigated the ratio of transitions (A/G and C/T) and transversion mutations (A/C, A/T, C/G, and G/T) between the assemblies of the two species, based on the whole-genome alignment used for calculating the substitution rate. Assuming that the observed sequence differences between the two species are primarily based on real biological mutation, we expected a bias toward transitions (Wakeley 1994). We found that across all sites in the whole-genome alignment of these two species, the ratio of transitions to transversions is 1.10. In order to compare the Paedocypris assemblies to the other genome assemblies, we also compared the ratio of transitions to transversions for three species pairs based on the data set used for phylogenetic analyses. This data set contained two alignments (one for first codon positions and one for second codon positions) that both had a length of 67,643 bp. The three species pairs P. carbunculus and P. micromegethes, Pi. promelas and L. waleckii, and C. carpio and S. grahami were analyzed independently. For this latter species pair, which diverged earlier (23.1 Ma) than the other two pairs we found the transitions/transvertions ratio to be on an average 1.85 for both codon positions. The transitions/transvertions ratio calculated from the species pair Pi. promelas and L. waleckii, which diverged similarly long ago as the Paedocypris species (15.1 Ma and 12.3 Ma, respectively) was on an average 1.08, whereas we again obtained a ratio of 1.10 for the Paedocypris species. As the expectation based on purely random mutations (or errors) would be 0.5, this clearly indicates that the observed interspecies differences are not due to technical or computational errors, that is, that the assemblies are accurate at the nucleotide level.
Ancestral State Reconstruction
To determine the directionality of changes in repeat content and genome sizes, the time-calibrated phylogeny (fig. 4a) was used to reconstruct ancestral states at each internal node. This was done with the ML algorithm “phylopars” implemented in the R package Rphylopars (Goolsby et al. 2017), assuming a Brownian Motion model of trait evolution. Ancestral state reconstruction was performed separately for numbers of DNA transposons, LINEs, SINEs, LTRs, other repetitive elements, and for genome size (additional file 2: supplementary table S10, Supplementary Material online).
Identification of PIWI-Like Genes
We investigated the presence of PIWI-like genes in the genomes of the two Paedocypris species and the other cyprinids using Exonerate with the longest transcripts available for the two PIWI-like homologs from zebrafish; PIWIl1 (ENSDARG00000041699) and PIWIl2 (ENSDARG00000062601). Regions containing sequences spanning more than three introns were aligned to the zebrafish exons using mafft (Katoh and Standley 2013) as implemented in AliView (Larsson 2014) (v. 1.17.1). Intron sequences were aligned manually based on the established exon structure, using the full-length scaffold sequences. Local gene synteny to zebrafish chromosome 8, surrounding the putative PIWIl1 copies, was confirmed through reciprocal BLAST searches using both the MAKER2 annotated proteins and proteins predicted by GeneScan (online version) (Burge and Karlin 1997) as queries.
Identification of Chromosomal Rearrangements (Fusions)
As P. carbunculus has been shown to have a haploid chromosome count of 15 (Liu et al. 2012), potential chromosomal fusions were investigated on the basis of disrupted synteny of zebrafish chromosomes in relation to Paedocypris.
We identified putative homologous regions between the zebrafish genome assembly and each of the Paedocypris species’ genome assemblies by using MCScanX (Wang et al. 2012). In short, the predicted proteins for each Paedocypris species were merged with predicted proteins from zebrafish into a single file, and BLASTP (Altschul et al. 1990) was executed with this file as both query and target, thus identifying putative homologs both within each species and between. The genomics positions of the proteins were extracted from the annotation files, and the BLASTP results and the genomic positions were provided to MCScanX for identifying the putative homologous regions.
Results
Sequencing, Assembly, and Annotation
Based on expected genome sizes of 315 Mb (Liu et al. 2012), both Paedocypris genomes were sequenced to ∼90× coverage on the Illumina HiSeq 2500 platform, producing 151–155 M paired reads of 250 bp each from genomic sequence fragments of ∼550 bp. Both Paedocypris genomes were initially assembled using two different assembly programs, the “Overlap-Layout-Consensus” based Celera Assembler (Miller et al. 2008) and the “de Bruijn graph” based DISCOVAR de novo (Weisenfeld et al. 2014). These two initial assemblies were then merged using Metassembler software (Wences and Schatz 2015), resulting in a reconsolidated single assembly with superior quality for each of the two Paedocypris species. The quality of the genome assemblies was assessed on the basis of contiguity (N50 statistics), gene space completeness (BUSCO; Simão et al. 2015), and assembly errors using FRCbam (Vezzi et al. 2012) and investigation of the ratio between transitions and transversions. Results are listed in table 1 (see additional file 1: supplementary notes S1–S5, additional file 2: supplementary table S1, and additional files 3 and 4: supplementary figs. S1 and S2, Supplementary Material online).
Table 1.
Assembly Statistics, Gene-Space Completeness-, and Annotation Metrics
| Paedocypris carbunculus | P. micromegethes | |
|---|---|---|
| Estimated genome size by k-mer distribution | 437,300,000 | 412,600,000 |
| Total assembly length (bp) | 430,790,821 | 414,707,736 |
| Estimated assembly coverage (CA/DDN) | 67×/73× | 76×/91× |
| Number of scaffolds | 18,953 | 15,158 |
| N50 scaffold length | 59,252 | 61,901 |
| Longest scaffold (bp) | 653,275 | 678,207 |
| N50 contig length | 11,815 | 14,788 |
| BUSCOs founda | 4,113 | 4,073 |
| BUSCOs completea | 3,719 | 3,564 |
| Total gene countb | 25,567 | 25,453 |
Out of 4,584 highly conserved Actinopterygii genes.
Annotation edit distance (AED) < 1.0 or containing a protein family (Pfam) domain.
Structural and functional annotation of both reconsolidated Paedocypris genomes was performed with two iterative rounds of the MAKER2 (v 2.31.8) pipeline (Cantarel et al. 2007; Holt and Yandell 2011; Campbell et al. 2014). Numbers of genes annotated are listed in table 1. See additional file 1: supplementary note S6, Supplementary Material online, for in-depth descriptions of additional software and commands used.
Loss of Hox- and Other Developmental Genes
Hox genes encode transcription factors essential in body patterning along the anterior–posterior body axis during early development of all animals (Mallo and Alonso 2013). Although a large number of genes are involved in developmental processes, Hox genes are especially interesting as they remain organized in conserved clusters and are ordered along the chromosomes according to where and when they are activated (Gaunt 2015).
As all known Paedocypris species have a progenetic phenotype, we investigated whether this condition is reflected in their Hox gene repertoire. We compared 70 Hox gene transcripts, encoded by the 49 Hox genes in zebrafish, to detect syntenic Hox cluster regions in the two Paedocypris genomes (see Materials and Methods and additional file 2: supplementary table S2, Supplementary Material online). For Hox clusters Aa, Ab, and Bb, we recovered all genes on one to three contiguous sequences in synteny with Danio rerio (fig. 1a). Two scaffolds in both Paedocypris species cover the HoxBa cluster; however, only fragments of hoxB10a and hoxB7a could be identified in this region. Four Hox genes (hoxC8a, hoxC5a, hoxC3a, and hoxC1a) appear to be missing in Hox cluster Ca, which was more fragmented than the HoxA and HoxB clusters in both species. And finally, Hox cluster Cb, which was recovered in either one or two contiguous sequences, is missing two Hox genes (hoxC13b and hoxC12b), whereas Hox cluster D, which was recovered as three contiguous sequences in both species, is also missing two Hox genes (hoxD13 and hoxD12). In total, ten of the zebrafish Hox genes appear to be absent in Paedocypris (fig. 1a). Of these, three (hoxC8a, hoxD13, hoxD12) were not covered by any scaffolds spanning the region in which the genes were expected to be found. However, three of the Hox genes were covered by contiguous sequences in synteny with Danio rerio in both species (hoxB7a, hoxC1a, and hoxC12b), and an additional four genes in one species (hoxB10a, hoxC5a, hoxC3a, and hoxC13b). This strengthens the hypothesis that at least these seven Hox genes were indeed lost in Paedocypris. The absence of the three Hox genes, hoxC8a, hoxD13, and hoxD12, for which we do not have contiguous sequences in synteny with Danio rerio may possibly be due to incomplete sequencing coverage, assembly errors, or highly divergent sequence evolution of these genes in the Paedocypris lineage. Thus, future sequencing efforts, supplementing our current estimated genome coverage of 67–76× (Celera Assembler)/73–91× (DISCOVAR de novo) (table 1) with single molecule sequencing technologies (i.e., Pacific Bioscience or Oxford Nanopore Technologies) and subsequent reannotation, are needed to confirm whether they are indeed lost or have remained undetected. A certain level of sequence similarity without a clear gene structure could be identified for hoxB10a, hoxB7a, and hoxC3a (fig. 1a), which may suggest the pseudogenization of these three Hox genes. Similar searches for the remaining missing Hox genes in other parts of the genome assembly did not identify any sequence or homeodomain similarity. The location of all identified Hox genes, and the best hits for all genes investigated are listed in addtional file 2: supplementary table S3, Supplementary Material online.
Fig. 1.

—Sequence similarity plots and reconstructed evolutionary history of teleost Hox genes. (a) Pairwise sequence similarity between zebrafish (Danio rerio) and Paedocypris carbunculus (P. c., top) and P. micromegethes (P. m., bottom) for syntenic Hox regions. Sequence similarity from 50% to 100% is shown with green bars representing the location of complete copies of recovered Hox genes, whereas red bars represent the expected location of the unrecovered genes. Gray shading represents contiguous sequences in either of the Paedocypris species with sufficient similarity to be mapped to the zebrafish chromosomes. (b) Cladogram of selected otophysan species including hypothetical ancestors and ancestral losses (topology according to Stout et al. 2016). Genus-specific Hox gene losses are shown in red (solid and open crosses). Only intact gene copies are shown. Hox cluster information from other species, and the ancestral states, are based on Henkel et al. (2012), Pascual-Anaya et al. (2013), Yang et al. (2016), and Ensembl (Cunningham et al. 2015).
Although extensive Hox gene loss has been reported for other cyprinids, these are secondary losses, following genome duplication events (Pascual-Anaya et al. 2013). Figure 1b shows the positions of both the missing and the present Hox genes in Paedocypris compared with currently available otophysan genomes, illustrating the most parsimonious reconstruction of Hox-cluster evolution in this fish lineage. The number of Hox genes in Paedocypris of 42 or fewer is, to the best of our knowledge, the lowest Hox gene number reported for any teleost fish.
Given its progenetic phenotype and the fact that ∼15–20% of the zebrafish Hox gene repertoire is apparently absent in Paedocypris, we also investigated the presence of other key genes involved in various developmental pathways. We first determined the overlap in gene space between the two Paedocypris species, the zebrafish, and the two tetraodontid species Di. nigroviridis and T. rubripes, as these pufferfishes have similarly small genomes as the Paedocypris species. Figure 2a shows the number of shared orthogroups for all species, as identified with OrthoFinder (Emms and Kelly 2015), highlighting the number of orthogroups without orthologs in Paedocypris (numbers in bold). We used the set of genes from these 1,160 orthogroups to identify a comprehensive list of 1,581 genes that had gene ontologies associated with different system development pathways and pattern specific processes in D. rerio (Materials and Methods and additional file 2: supplementary table S4, Supplementary Material online). These 1,581 genes were then used as queries to screen the genomic sequences and annotated protein sets of Paedocypris. Fifteen of these genes, primarily involved in skeletal- (ucmab, disc1, lbh, lepa, and bglap), muscle- (ccdc78 and marcksa), and nervous system (nkx2.9, pho, cntf, thfrsf1b, and tnfrsf19) development, were not found in either of the Paedocypris species (fig. 2b). Adjacent flanking genes in zebrafish could, however, be identified in Paedocypris for all 15 genes (additional file 2: supplementary table S5, Supplementary Material online).
Because phenotypic changes can also result from gene duplication (Kaessmann 2010; Peterson and Müller 2016), we inspected genes with two copies in Paedocypris but only a single copy in zebrafish and pufferfishes. Based on the topology of gene trees generated for these genes, we differentiated between genes originating from duplication events predating the divergence of Paedocypris and Danio, where only one copy is retained in zebrafish (fig. 2c), and Paedocypris-specific gene duplication events (fig. 2d). Interestingly, although only four genes could be identified as recent duplicates in Paedocypris, two of these (ttc21b and ruvbl1) are associated with deformed phenotypes in zebrafish, including shortening of the anterior–posterior axis and decreased head size (Cunningham et al. 2015).
Genome Miniaturization through Intron Shortening
In parallel to their miniaturized body size, the two Paedocypris species show a surprising evolutionary trajectory in terms of genome miniaturization. Compared with the genome sizes of zebrafish (∼1.5 Gb) (Howe et al. 2013; Cunningham et al. 2015) and other cyprinid fishes (0.81–3.5 Gb) (Gregory 2017), we find that the two Paedocypris species have substantially smaller genomes (0.41–0.43 Gb), yet similar numbers of genes (table 1). Comparative analyses of vertebrate genomes have shown that genome size reduction is typically characterized by shorter introns and reduced repeat content (Neafsey and Palumbi 2003; Zhang et al. 2014). However, substantial loss of protein-coding genes (Hughes and Friedman 2008; Zhang et al. 2014), large segmental deletions facilitated by fission of macrochromosomes (Zhang et al. 2014), and a reduced rate of large insertions have also been demonstrated to play a role in reducing or constricting genome size (Neafsey and Palumbi 2003; Vinogradov 2004).
As the Paedocypris genome sizes are comparable to those of tetraodontid pufferfishes, we compared the gene repertoires of Di. nigroviridis and T. rubripes to those of Paedocypris and D. rerio to determine which genomic features are shared among these lineages. In order to obtain a consistent gene set for comparative analysis of gene-, exon-, and intron lengths, we categorized the full gene set of all five species into orthologous groups using the software OrthoFinder (Emms and Kelly 2015). We identified 10,368 orthogroups containing genes from all five species (fig. 2a), which included 16,142 genes in zebrafish, 15,287 in P. carbunculus, 14,181 in P. micromegethes, 14,529 in Di. nigroviridis, and 14,393 in T. rubripes. The total gene length and the proportions of exonic and intronic regions for this gene set are shown in figure 3a. Although the cumulative length of this gene set is significantly smaller in both Paedocypris species and the two tetraodontids than in the zebrafish, the proportional change is more subtle, with the gene set constituting on average 29–30% of the total genome length in Paedocypris and the tetraodontids and 40% in zebrafish. Further, even though we detected minor differences in this gene set regarding the average number of exons per gene in Paedocypris (10.04) compared with D. rerio (11.21), the observed 47% reduction in total exon length of Paedocypris in relation to zebrafish cannot be attributed to exon loss alone, as the two tetraodontids showed very similar results to Paedocypris with even higher average exon count (11.89). However, the majority of the total gene length reduction observed in Paedocypris and tetraodontids is due to an 80–84% reduction in overall intron size (fig. 3a). To rule out that the overall reduction in intron size is driven by a highly deviant fraction of the Paedocypris and tetraodontid gene sets, we also investigated the distribution of gene-, exon-, and intron lengths of the common gene set for these species (fig. 3b). We observe that zebrafish has substantially fewer short genes compared with all other species, with an average gene length 4.3–5.5 times longer than that of Paedocypris and tetraodontids. This is not unexpected, as previous studies have reported a lineage-specific expansion of intron size (Moss et al. 2011), resulting in an additional peak of intron lengths between 1,000 and 2,000 bp in zebrafish, shown in figure 3b. Based on our results, it is apparent that the reduced average gene length in Paedocypris is driven by a substantial shift toward consistently shorter introns, similar to, but not as extreme as, in the two tetraodontids. This is further illustrated by the calculated median intron sizes depicted in figure 3b. Although Paedocypris showed a comparable mean and median intron size compared with medaka and stickleback, this is roughly 1.5–2 times smaller than in nonzebrafish cyprinids and 3.5–4.2 times smaller than in zebrafish (table S6, Supplementary Material online) indicating an intron size reduction in the most recent common ancestor of the two Paedocypris species.
Fig. 3.
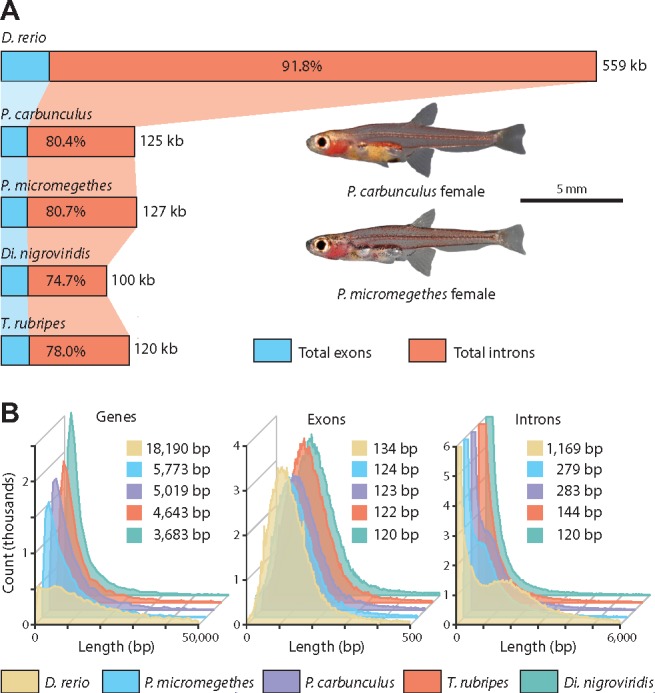
—Comparative analyses of gene space in Paedocypris, zebrafish, and pufferfishes. (a) Total gene length of 14–16,000 genes belonging to common orthogroups, and the proportional contribution of exonic and intronic regions, in zebrafish, Paedocypris, and the tetraodontids Takifugu rubripes and Dichotomyctere nigroviridis. (b) Frequency plot and median values of gene-, exon-, and intron lengths for the common gene set. In all distributions, the values for both Paedocypris species are significantly lower than in zebrafish, but significantly greater than those of both tetraodontids. (Wilcoxon Rank Sum test, P < 10−15). Significant results were not detected for intron- and exon lengths between the two Paedocypris species; however, in terms of gene lengths, P. micromegethes was reported to be significantly longer.
Repeat Content Reduction and Genome Evolution
The genome size of an organism evolves through the relative rate of insertions and deletions and through the effect of natural selection that either favors or eliminates these changes. Genome shrinkage has thus been postulated to evolve through a bias in the rate of insertions relative to deletions (Petrov 2002), but the impact of this mechanism, and its importance in genome size evolution is still debated (Gregory 2004). Importantly, even though deletions indeed appear to be more frequent than insertions, the latter tend to include significantly more base pairs, resulting in the gradual increase in genome size in eukaryotes (Petrov 2002). Although several other types of mutational activity can promote genome-size expansion, self-replicating mobile elements (i.e., transposons) have been identified as the most prominent contributor in this regard (Chénais et al. 2012; Sun et al. 2012), and a strong correlation between genome size and the amount of transposable elements (TEs) is observed in both plants (Kumar and Bennetzen 1999) and vertebrates (Chalopin et al. 2015; Canapa et al. 2016; Gao et al. 2016). Compact genomes, characterized by reduced intron length and fewer repetitive elements, were first described in the tetraodontid pufferfishes (Neafsey and Palumbi 2003), and more recently in plants (Ibarra-Laclette et al. 2013) and insects (Kelley et al. 2014). Interestingly, a strong correlation between intronic and intergenic space in animal genomes has recently been shown (Francis and Wörheide 2017) and hence, the shorter introns found in Paedocypris might suggest the possibility of shorter intergenic stretches (i.e., fewer and/or shorter repeats). We therefore examined to which degree this also is the case in Paedocypris. In order to investigate the same set of highly curated repeats in all species, we used the Danio-specific repeat library implemented in RepeatMasker (Smit et al. 2017) to determine the amount of TEs; DNA-transposons, long- and short interspersed repeats (LINEs and SINEs), and long terminal repeats (LTRs) in the genomes of Paedocypris, zebrafish, and four other cyprinid species (Cyprinus carpio, Pimephales promelas, Sinocyclocheilus grahami, and Leuciscus waleckii) in addition to the characiform cave tetra (Astyanax mexicanus). The repeat landscape graphs, illustrating the relative amount of each TE class and the Kimura distance (Kimura 1980) for each of these are shown in figure 4a along with a time-calibrated phylogeny of these eight species, as inferred using BEAST 2 (Bouckaert et al. 2014) (see Materials and Methods). Figure 4a also shows the percentage of each repeat type of various age categories, calculated following Kapusta et al. (2017). The total number of Danio-specific repetitive elements of each class is shown in figure 4b, clearly illustrating that even though the proportional differences in repeat content is similar between Paedocypris and the other cyprinids, the total number of elements is much lower. To complement our approach based on the Danio-specific repeat library, species-specific repeat libraries were also created for each of the eight species. When these species-specific libraries were used in combination with the Danio-specific library, we found an overall higher repeat content in all species compared with the Danio-specific library alone (additional file 2: supplementary tables S7 and S8, Supplementary Material online). However, this higher detection precision comes at the expense of resolution, resulting in high amounts of unclassified repeats, making these libraries less suited for the study of class-specific repeat-content evolution (see additional file 5: supplementary fig. S3, Supplementary Material online). Additionally, we also investigated the amount of teleost-specific repeats, using the “Teleost” repeat library implemented in RepeatMasker. This resulted in unrealistically low repeat contents for all species, which again was poorly annotated (additional file 2: supplementary table S9, Supplementary Material online). Therefore, we focus our interpretation on the analyses with the Danio-specific repeat library only. This strategy resulted in well-annotated repeats which could be compared between species, and also provide insight into the evolutionary history of these repeats, although it likely underestimates the total amount of repetitive elements in all genomes except Danio rerio.
To also investigate the directionality of TE-content evolution, we reconstructed the ancestral states of both TE content and genome sizes for each internal node of the phylogeny, assuming a Brownian motion model of trait evolution (fig. 4b and additional file 2: supplementary table S10, Supplementary Material online). Our results support a directional reduction in both genome size (fig. 4c) and TE content (fig. 4d) in the Paedocypris lineage, whereas other representatives of the otophysan fishes have evolved larger and more repeat rich genomes following the divergences from their last common ancestor.
Consistent with previous reports (Chalopin et al. 2015), we find that the zebrafish genome is dominated by repetitive elements, constituting 58.1% of its genome. In contrast, the same Danio-specific repeats only constitute 15.3–15.5% of the Paedocypris genomes (TEs, satellites, simple repeats, and low complexity regions), which is comparable to that of the other cyprinids investigated (12.3–19.0%) when only considering the Danio-specific repeats. However, in terms of TE content, the Paedocypris species have considerably fewer and shorter elements that comprise in total 7.2% and 7.3% of their genomes, compared with the four other cyprinids in which we find on average a genomic proportion of 13.8% (not including zebrafish in which these constitute 53.3% of the genome) (additional file 2: supplementary tables S5 and S6, Supplementary Material online). Based on the timing of the divergence events leading to crown Paedocypris and the calculated substitution rate (see Materials and Methods), we investigated the proportions of “ancient” and “lineage specific” TEs. Interestingly, according to the analyses with the Danio-specific repeat library only 0.05–0.25% of the Paedocypris transposons appear to have been incorporated into their genomes after these two species diverged (fig. 4a).
As Paedocypris thus appears to have reversed the general trend of DNA gain (Gregory 2004) toward gradual DNA loss, indicated by their reduced TE content, we investigated whether this could have been achieved through silencing of transposon activity (Vinogradov 2004). We thus explored the genomic content of the PIWI-like genes (PIWIl1 and PIWIl2), which are known for silencing transposons in zebrafish and other vertebrates (Aravin et al. 2007; Levin and Moran 2011). Interestingly, we identified additional copies of PIWIl1 in both Paedocypris genomes, located in a conserved region ∼4 Mb upstream of PIWIl1 on zebrafish chromosome 8 (additional file 6: supplementary fig. S4, Supplementary Material online). These lineage-specific duplications suggest that the gradual genome miniaturization has been, at least in part, attained through increased transposon silencing, leading to a bias of DNA loss over DNA gain. This hypothesis would need to be tested further though, ideally by utilizing genomic sequences from other closely related cyprinids like Danionella and Sundadanio. Probably resulting from its lineage-specific whole-genome duplication, a single duplicate of the PIWIl1 gene was also found in C. carpio, but no extra copies could be detected in the other cyprinids; Pi. promelas, L. waleckii, or S. grahami, and no additional copies of PIWIl2 were detected in either species.
Chromosome Fusion
Another interesting feature of the miniaturized genome of Paedocypris is the reduced number of chromosomes compared with that of zebrafish. Although most Cypriniformes have ≥ 24 chromosomes (Yu et al. 1987) in the haploid metaphase and zebrafish has 25, P. carbunculus only features 15 chromosomes (Liu et al. 2012). Since we did not find any indication of large-scale chromosome loss, as would be indicated by substantial gene loss, this discrepancy implies that genome miniaturization in Paedocypris spp. has been accompanied by chromosomal fusion since they diverged from their last common ancestor with zebrafish. In order to identify regions on different chromosomes in the zebrafish genome that are now tightly linked in the Paedocypris genome, we looked for syntenic regions in Paedocypris that contain at least six genes from two different chromosomes in zebrafish. Figure 5 shows the three scaffolds identified in each of the Paedocypris species fulfilling these criteria. In both species, nine genes from chromosomes 9 and 21 in zebrafish are colocalized on a single scaffold. For chromosome 11 in zebrafish, we find evidence in different regions for a fusion with chromosome 1 in P. carbunculus but also chromosome 2 in P. micromegethes, suggesting that either all three chromosomes may have fused or that species-specific fusion events may have occurred. Although the remaining two putative fusion events can only be detected in one of the species, there are no contradicting results between the two Paedocypris species, indicating that fusion of the chromosome pairs 6 and 19 as well as 22 and 25 is likely to have occurred in the last common ancestor of both species.
Fig. 5.

—Syntenic regions between zebrafish chromosomes and Paedocypris scaffolds. Syntenic regions between zebrafish (Danio rerio) and P. carbunculus (a) or P. micromegethes (b). Links between Paedocypris scaffolds and D. rerio chromosomes indicate orthologous genes. Only the relevant parts of D. rerio chromosomes are shown and the locations of all genes in these regions are illustrated in the gray shaded areas. Numbers on scaffolds and chromosomes are given as kb.
Discussion
Miniature body size has evolved several times in the cyprinid fishes (Rüber et al. 2007). Within cyprinids there are two modes of miniaturization; proportionate dwarfism, where the adult individuals are miniature, but otherwise identical, copies of their larger ancestors (Conway and Britz 2007), and developmental truncation (progenesis), where the sexually mature fish resemble the larval stage of their larger ancestors (Rüber et al. 2007; Britz and Conway 2009). However, little is known about the molecular underpinnings of these two very different types of miniaturization. Our results, reporting the compacted genome sequences of two miniaturized and highly developmentally truncated cyprinid species serve as an important starting point in elucidating the complex interplay between miniaturization, progenetic heterochrony and genomic architecture. Genome sizes of proportionate dwarfs in Cyprinidae and other bony fishes, remain to be examined, and will provide an interesting comparison to the results presented here. Reduced genome size, as we report on here, has also been reported in other vertebrates (Neafsey and Palumbi 2003; Zhang et al. 2014), yet these reductions include large segmental deletions, chromosome fissions, and massive losses of protein coding genes, which is not the case in the miniaturized genomes of Paedocypris. On the other hand paedomorphic taxa without reduced body size, that is, those affected by the process of neoteny, such as deep-sea brittle stars (Stöhr and Martynov 2016) whose genome sizes are unknown or the Mexican axolotl (Keinath et al. 2015) with a large genome size, are puzzling in this regard and provide interesting cases for further comparison. Thus, whether there are any causal links between miniaturized body size—be it proportionate dwarves or progenetic miniatures—and reduced genome size remains to be determined.
Moreover, while reduced genome sizes in birds and bats can probably be explained by the adaptation to flight through the need for higher metabolic rates (Zhang and Edwards 2012), the ultimate causes of genome-size reduction in fishes seem in general less apparent. We hypothesize that in the specific case of Paedocypris, the organism-wide developmental truncation and concomitant miniaturization may have evolved as a response to its extreme habitat in the peat swamp forests (i.e., low oxygen concentrations and pH < 4.0), similar to the genome miniaturization of the Antarctic midge that was also associated with adaptation to its extreme environment (Kelley et al. 2014). The extremely acidic and oxygen deprived habitat of the peat swamp forests likely imposes resource limitations and thus constraints on the metabolic rate, possibly favoring genome size reduction.
With this study, we highlight the unique opportunity provided by the morphologically and ecologically diverse species of Cyprinidae, as a comparative model system, to investigate the potential links between genome size, body size, and heterochrony, that may also shed new light on the ultimate causes of genome size evolution in vertebrates. Miniature cyprinids also feature several evolutionary novelties such as highly modified pelvic and pectoral girdles (Britz and Conway 2009), an anterior shift in genital pore and anus (Rüber et al. 2007), fang-like structures forming from the jaw bones (Britz et al. 2009; Britz and Conway 2016), and a sound-producing drumming apparatus (Conway and Britz 2007). However, such novelties appear to be restricted to developmentally truncated miniatures (e.g., Paedocypris, Danionella, and Sundadanio). The absence of novelties in proportioned dwarves thus suggests that developmental truncation may play an important role in escaping evolutionary and developmental constraints imposed by the species’ Bauplan and in opening up new evolutionary avenues for drastic morphological change (Britz and Conway 2009, 2016; Conway et al. 2017).
This study represents the first report on genomes of highly developmentally truncated vertebrate species. It illustrates how the unique features of Paedocypris at the phenotypic level (i.e., extreme miniaturization and dramatic developmental truncation) are paralleled at the genomic level by the unprecedented loss of Hox genes and other important developmental genes. Several of these genes are directly involved in bone differentiation, mirroring the largely unossified, progenetic, skeleton of these miniature species.
Recent investigation of the Gulf pipefish genome (Small et al. 2016) has revealed a loss of the last [final refers to what?] Hox7 paralog in this species. This has revived the disputed hypothesis that the lack of ribs in both pufferfish and the pipefishes can be attributed to the fact that none of these species have any remaining Hox7 paralogs (Amores et al. 2003). Interestingly, the Paedocypris species show a similar loss of the last Hox7 paralog (hoxb7a), yet the two species investigated here do feature ribs. The ribs are, however, reduced and remain poorly ossified (Britz and Conway 2009), suggesting that although the Hoxa7/Hoxb7 genes are not the only essential genes for rib development, they do appear to have an influence on their development, as suggested by earlier experiments in mice (Chen et al. 1998).
Finally, the observed loss of Hox13 genes (Cb and Da) in the two Paedocypris species is of special interest as these genes represent the termination of the patterning system. Hoxd13 was also one of the genes targeted in the successful CRISPR-Cas9 knockout experiment in the zebrafish (Nakamura et al. 2016), that showed that the Hox genes play a very similar role in patterning during development of both fins and bones, and thus elucidated the evolutionary transition from fins to limbs.
Conclusion
The naturally simplified species of the genus Paedocypris, having escaped the developmental, and—as we report here—genetic constraints of their cyprinid Bauplan, emerge as a novel opportunity to investigate phenotype–genotype relationships in vertebrate development. These naturally occurring extreme phenotypes with organism-wide developmental truncation and a number of evolutionary novelties, have the potential to aid and complement future research on model organisms in our quest to understand how phenotypic diversity is generated during vertebrate evolution and development. We propose that future studies of similar nature should consider using Paedocypris species as a complementary system to the zebrafish model, due to its already limited Hox gene repertoire, yet relatively close phylogenetic relationship with zebrafish.
Data Availability
The whole-genome sequencing data have been deposited at the EMBL Nucleotide Sequence Database (ENA) under accession PRJEB15524, with the sample identifiers ERS1366602 (P. carbunculus) and ERS1366603 (P. micromegethes). The assemblies and annotation files are available for download at figshare (figshare DOI: 10.6084/m9.figshare.3969018), whereas custom scripts have been placed on GitHub (https://github.com/uio-cees/Paedocypris_gene_stats). All alignments and trees for the duplicated genes (fig. 2c and d) can be downloaded from figshare (10.6084/m9.figshare.5739627).
Supplementary Material
Supplementary data are available at Genome Biology and Evolution online.
Funding
This work was supported by grants from the Naturhistorisches Museum Bern to L.R. and the Research Council of Norway (RCN grants 199806 and 222378) to K.S.J. H.H.T acknowledges funding from the National University of Singapore (NUS, R-154-000-318-112) and Lee Kong Chian Natural History Museum. W.S. acknowledges funding from the European Research Council (ERC) and the Swiss National Science Foundation (SNF). Fieldwork in the peat swamp forests in Malaysia and Indonesia was funded by the Natural Environmental Research Council (NERC; NE/F003749/1, to L.R. and R.B.), National Geographic (8509-08, to L.R.), and the North of England Zoological Society (to L.R.).
Supplementary Material
Acknowledgments
Fieldwork in Sarawak was conducted under permits issued by the Economic Planning Unit, Prime Minister’s Department, Malaysia UPE 40/200/19/2534) and the Forest Department Sarawak (NCCD.970.4.4[V]-43) and fieldwork in Indonesia was conducted under permits issued by the Indonesian Institute of Sciences (LIPI) and the Kementerian Negara Riset dan Teknology (RISTEK; 3/TKPIPA/FRP/SM/III/2012). We thank E. Adamson H. Budianto H. Ganatpathy, S. Lavoué, M. Lo, H. Michael, and S. Sauri for their help in the field. All computational work was performed on the Abel Supercomputing Cluster (Norwegian metacenter for High Performance Computing [NOTUR] and the University of Oslo) operated by the Research Computing Services group at USIT, the University of Oslo IT-department. Sequencing library creation and high-throughput sequencing were carried out at the Norwegian Sequencing Centre (NSC), University of Oslo, Norway.
Author Contributions
M.Mal., R.B., K.S.J., W.S., and L.R. conceived the project and designed scientific objectives. R.K.H., N.Y., and L.R. collected and prepared the fish samples. M.Mal. and O.K.T. conducted the genome assembly, annotation, and bioinformatics analysis for quality assessment. M.Mal. conducted the Hox gene analysis and analysis of lost and duplicated genes. M.Mal. and M.Mat. analyzed gene-space evolution. M.Mal. conducted repeat content analyses. M.Mat. performed phylogenetic analyses and ancestral-state reconstructions. M.Mal. and O.K.T. collaborated on the chromosome rearrangement analysis. M.Mal., R.B., M.Mat., K.S.J., W.S., and L.R. prepared the manuscript. O.K.T., R.K.H., N.Y., and H.H.T. participated in discussions and provided valuable suggestions. M.Mal., M.Mat., and O.K.T. prepared the figures. All authors read and approved the final manuscript.
Literature Cited
- Altschul SF, Gish W, Miller W, Myers EW, Lipman DJ.. 1990. Basic local alignment search tool. J Mol Biol. 215(3):403–410. [DOI] [PubMed] [Google Scholar]
- American Fisheries Society. 2014. Use of fishes in research committee (joint committee of the American Fisheries Society, the American Institute of Fishery Research Biologists, and the American Society of Ichthyologists and Herpetologists). Guidelines for the use of fishes in research. Bethesda (MD: ): American Fisheries Society. [Google Scholar]
- Amores A, et al. , 2003. Developmental roles of pufferfish Hox clusters and genome evolution in ray-fin fish. Genome Res. 14(1):1–10. [DOI] [PMC free article] [PubMed] [Google Scholar]
- Aravin AA, Hannon GJ, Brennecke J.. 2007. The Piwi-piRNA pathway provides an adaptive defense in the transposon arms race. Science 318(5851):761–764. [DOI] [PubMed] [Google Scholar]
- Arcila D, et al. , 2017. Genome-wide interrogation advances resolution of recalcitrant groups in the tree of life. Nat Ecol Evol. 1(2):0020. [DOI] [PubMed] [Google Scholar]
- Bouckaert R, et al. , 2014. BEAST 2: a software platform for Bayesian evolutionary analysis. PLoS Comput Biol. 10(4):e1003537. [DOI] [PMC free article] [PubMed] [Google Scholar]
- Braasch I, et al. , 2015. A new model army: emerging fish models to study the genomics of vertebrate evo-devo. J Exp Zool. 324(4):316–341. [DOI] [PMC free article] [PubMed] [Google Scholar]
- Bray N, Dubchak I, Pachter L.. 2003. AVID: a global alignment program. Genome Res. 13(1):97–102. [DOI] [PMC free article] [PubMed] [Google Scholar]
- Britz R, Conway KW.. 2009. Osteology of Paedocypris, a miniature and highly developmentally truncated fish (Teleostei: Ostariophysi: Cyprinidae). J Morphol. 270(4):389–412. [DOI] [PubMed] [Google Scholar]
- Britz R, Conway KW.. 2016. Danionella dracula, an escape from the cypriniform Bauplan via developmental truncation? J Morphol. 277(2):147–166. [DOI] [PubMed] [Google Scholar]
- Britz R, Conway KW, Rüber L.. 2009. Spectacular morphological novelty in a miniature cyprinid fish, Danionella dracula n. sp. Proceedings of the Royal Society, Series B. 276:2179–2186. [DOI] [PMC free article] [PubMed] [Google Scholar]
- Britz R, Conway KW, Rüber L.. 2014. Miniatures, morphology and molecules: Paedocypris and its phylogenetic position (Teleostei, Cypriniformes). Zool J Linnean Soc. 172(3):556–615. [Google Scholar]
- Burge C, Karlin S.. 1997. Prediction of complete gene structures in human genomic DNA. J Mol Biol. 268(1):78–94. [DOI] [PubMed] [Google Scholar]
- Campbell MS, et al. , 2014. MAKER-P: a tool kit for the rapid creation, management, and quality control of plant genome annotations. Plant Physiol. 164(2):513–524. [DOI] [PMC free article] [PubMed] [Google Scholar]
- Canapa A, Barucca M, Biscotti MA, Forconi M, Olmo E.. 2016. Transposons, genome size, and evolutionary insights in animals. Cytogenet Genome Res. 137:217–239. [DOI] [PubMed] [Google Scholar]
- Cantarel BL, et al. , 2007. MAKER: an easy-to-use annotation pipeline designed for emerging model organism genomes. Genome Res. 18(1):188–196. [DOI] [PMC free article] [PubMed] [Google Scholar]
- Carroll SP, Hendry AP, Reznick DN, Fox CW.. 2007. Evolution on ecological time-scales. Func Ecol. 21(3):387–393. [Google Scholar]
- Chakrabarty P, et al. , 2017. Phylogenomic systematics of Ostariophysan fishes: ultraconserved elements support the surprising non-monophyly of Characiformes. Syst Biol. 66:881–895. [DOI] [PubMed] [Google Scholar]
- Chalopin D, Naville M, Plard F, Galiana D, Volff JN.. 2015. Comparative analysis of transposable elements highlights mobilome diversity and evolution in vertebrates. Genome Biol Evol. 7(2):567–580. [DOI] [PMC free article] [PubMed] [Google Scholar]
- Chen F, Greer J, Capecchi MR.. 1998. Analysis of Hoxa7/Hoxb7 mutants suggests periodicity in the generation of the different sets of vertebrae. Mech Dev. 77(1):49–57. [DOI] [PubMed] [Google Scholar]
- Chénais B, Caruso A, Hiard S, Casse N.. 2012. The impact of transposable elements on eukaryotic genomes: from genome size increase to genetic adaptation to stressful environments. Gene 509(1):7–15. [DOI] [PubMed] [Google Scholar]
- Conway KW, Britz R.. 2007. Sexual dimorphism of the Weberian apparatus and pectoral girdle in Sundadanio axelrodi (Ostariophysi: Cyprinidae). J Fish Biol. 71(5):1562–1570. [Google Scholar]
- Conway KW, Kubicek KM, Britz R.. 2017. Morphological novelty and modest developmental truncation in Barboides, Africa’s smallest vertebrates (Teleostei: Cyprinidae). J Morphol. 14:33–18. [DOI] [PubMed] [Google Scholar]
- Cunningham F, et al. , 2015. Ensembl 2015. Nucleic Acids Res. 43:D662–D669. [DOI] [PMC free article] [PubMed] [Google Scholar]
- Emms DM, Kelly S.. 2015. OrthoFinder: solving fundamental biases in whole genome comparisons dramatically improves orthogroup inference accuracy. Genome Biol. 16(1):157.. [DOI] [PMC free article] [PubMed] [Google Scholar]
- Fang F, Nore n M, Liao TY, Källersjö M, Kullander SO.. 2009. Molecular phylogenetic interrelationships of the south Asian cyprinid genera Danio, Devario and Microrasbora (Teleostei, Cyprinidae, Danioninae). Zool Scripta 38(3):237–256. [Google Scholar]
- Francis WR, Wörheide G.. 2017. Similar ratios of introns to intergenic sequence across animal genomes. Genome Biol Evol. 9(6):1582–1598. [DOI] [PMC free article] [PubMed] [Google Scholar]
- Frazer KA, Pachter L, Poliakov A, Rubin EM, Dubchak I.. 2004. VISTA: computational tools for comparative genomics. Nucleic Acids Res. 32(Web Server):W273–W279. [DOI] [PMC free article] [PubMed] [Google Scholar]
- Gao B, et al. , 2016. The contribution of transposable elements to size variations between four teleost genomes. Mob DNA 7:4.. [DOI] [PMC free article] [PubMed] [Google Scholar]
- Gaunt SJ. 2015. The significance of Hox gene collinearity. Int J Dev Biol. 59(4-6):159–170. [DOI] [PubMed] [Google Scholar]
- Goolsby EW, Bruggeman J, Ané C.. 2017. Rphylopars: fast multivariate phylogenetic comparative methods for missing data and within-species variation. Met Ecol Evol. 8(1):22–27. [Google Scholar]
- Gregory TR. 2004. Insertion–deletion biases and the evolution of genome size. Gene 324:15–34. [DOI] [PubMed] [Google Scholar]
- Gregory TR. 2017. Animal genome size database [cited 2016 Apr 12]. Available from: http://www.genomesize.com, last accessed June 12, 2017.
- Hamilton F. 1822. An account of the fishes found in the river Ganges and its branches. Edinburgh: Hurst, Robinson and Co. [Google Scholar]
- Henkel CV, et al. , 2012. Primitive duplicate Hox clusters in the European eel’s genome. PLoS One 7(2):e32231. [DOI] [PMC free article] [PubMed] [Google Scholar]
- Hirt MV, et al. , 2017. Effects of gene choice, base composition and rate heterogeneity on inference and estimates of divergence times in cypriniform fishes. Biol J Linnean Soc. 121(2):319–339. [Google Scholar]
- Holt C, Yandell M.. 2011. MAKER2: an annotation pipeline and genome-database management tool for second-generation genome projects. BMC Bioinformatics 12(1):491.. [DOI] [PMC free article] [PubMed] [Google Scholar]
- Howe K, et al. , 2013. The zebrafish reference genome sequence and its relationship to the human genome. Nature 496(7446):498–503. [DOI] [PMC free article] [PubMed] [Google Scholar]
- Hughes AL, Friedman R.. 2008. Genome size reduction in the chicken has involved massive loss of ancestral protein-coding genes. Mol Biol Evol. 25(12):2681–2688. [DOI] [PMC free article] [PubMed] [Google Scholar]
- Ibarra-Laclette E, et al. , 2013. Architecture and evolution of a minute plant genome. Nature 498(7452):94–98. [DOI] [PMC free article] [PubMed] [Google Scholar]
- Jaillon O, et al. , 2004. Genome duplication in the teleost fish Tetraodon nigroviridis reveals the early vertebrate proto-karyotype. Nature 431(7011):946–957. [DOI] [PubMed] [Google Scholar]
- Kaessmann H. 2010. Origins, evolution, and phenotypic impact of new genes. Genome Res. 20(10):1313–1326. [DOI] [PMC free article] [PubMed] [Google Scholar]
- Kapusta A. 2017. Parsing-RepeatMasker-Outputs (parseRM.pl). Available from: https://github.com/4ureliek/
- Kapusta A, Suh A, Feschotte C.. 2017. Dynamics of genome size evolution in birds and mammals. Proc Natl Acad Sci U S A. 114(8):E1460–E1469. [DOI] [PMC free article] [PubMed] [Google Scholar]
- Katoh K, Standley DM.. 2013. MAFFT multiple sequence alignment software version 7: improvements in performance and usability. Mol Biol Evol. 30(4):772–780. [DOI] [PMC free article] [PubMed] [Google Scholar]
- Keinath MC, et al. , 2015. Initial characterization of the large genome of the salamander Ambystoma mexicanum using shotgun and laser capture chromosome sequencing. Sci Rep. 5(1):16413.. [DOI] [PMC free article] [PubMed] [Google Scholar]
- Kelley JL, et al. , 2014. Compact genome of the Antarctic midge is likely an adaptation to an extreme environment. Nat Commun. 5:4611. [DOI] [PMC free article] [PubMed] [Google Scholar]
- Kettleborough RNW, et al. , 2013. A systematic genome-wide analysis of zebrafish protein-coding gene function. Nature 496(7446):494–497. [DOI] [PMC free article] [PubMed] [Google Scholar]
- Kimura M. 1980. A simple method for estimating evolutionary rates of base substitutions through comparative studies of nucleotide sequences. J Mol Evol. 16(2):111–120. [DOI] [PubMed] [Google Scholar]
- Kottelat M, Britz R, Hui TH, Witte K-E.. 2006. Paedocypris, a new genus of Southeast Asian cyprinid fish with a remarkable sexual dimorphism, comprises the world’s smallest vertebrate. Proc Biol Sci. 273(1589):895–899. [DOI] [PMC free article] [PubMed] [Google Scholar]
- Kumar A, Bennetzen JL.. 1999. Plant retrotransposons. Annu Rev Genet. 33:479–532. [DOI] [PubMed] [Google Scholar]
- Larsson A. 2014. AliView: a fast and lightweight alignment viewer and editor for large datasets. Bioinformatics 30(22):3276–3278. [DOI] [PMC free article] [PubMed] [Google Scholar]
- Levin HL, Moran JV.. 2011. Dynamic interactions between transposable elements and their hosts. Nat Rev Genet. 12(9):615–627. [DOI] [PMC free article] [PubMed] [Google Scholar]
- Li H. 2011. A statistical framework for SNP calling, mutation discovery, association mapping and population genetical parameter estimation from sequencing data. Bioinformatics 27(21):2987–2993. [DOI] [PMC free article] [PubMed] [Google Scholar]
- Li H, Durbin R.. 2009. Fast and accurate short read alignment with Burrows-Wheeler transformation. Bioinformatics 25(14):1754–1760. [DOI] [PMC free article] [PubMed] [Google Scholar]
- Li H, et al. , 2009. The sequence alignment/map format and SAMtools. Bioinformatics 25(16):2078–2079. [DOI] [PMC free article] [PubMed] [Google Scholar]
- Liu S, Hui TH, Tan SL, Hong Y.. 2012. Chromosome evolution and genome miniaturization in minifish. PLoS One 7(5):e37305.. [DOI] [PMC free article] [PubMed] [Google Scholar]
- Mallo M, Alonso CR.. 2013. The regulation of Hox gene expression during animal development. Development 140(19):3951–3963. [DOI] [PubMed] [Google Scholar]
- Malmstrøm M, et al. , 2016. Evolution of the immune system influences speciation rates in teleost fishes. Nat Genet. 48(10):1204–1210. [DOI] [PubMed] [Google Scholar]
- Malmstrøm M, Matschiner M, Tørresen OK, Jakobsen KS, Jentoft S.. 2017. Whole genome sequencing data and de novo draft assemblies for 66 teleost species. Sci Data 4:160132.. [DOI] [PMC free article] [PubMed] [Google Scholar]
- Mayden RL, Chen W-J.. 2010. The world’s smallest vertebrate species of the genus Paedocypris: a new family of freshwater fishes and the sister group to the world’s most diverse clade of freshwater fishes (Teleostei: Cypriniformes). Mol Phylogenet Evol. 57(1):152–175. [DOI] [PubMed] [Google Scholar]
- McCluskey BM, Postlethwait JH.. 2015. Phylogeny of zebrafish, a “model species,” within Danio, a “model genus.”. Mol Biol Evol. 32(3):635–652. [DOI] [PMC free article] [PubMed] [Google Scholar]
- McMenamin SK, et al. , 2014. Thyroid hormone-dependent adult pigment cell lineage and pattern in zebrafish. Science 345(6202):1358–1361. [DOI] [PMC free article] [PubMed] [Google Scholar]
- Miller JR, et al. , 2008. Aggressive assembly of pyrosequencing reads with mates. Bioinformatics 24(24):2818–2824. [DOI] [PMC free article] [PubMed] [Google Scholar]
- Moczek AP, et al. , 2011. The role of developmental plasticity in evolutionary innovation. Proc R Soc B 278(1719):2705–2713. [DOI] [PMC free article] [PubMed] [Google Scholar]
- Moss SP, Joyce DA, Humphries S, Tindall KJ, Lunt DH.. 2011. Comparative analysis of teleost genome sequences reveals an ancient intron size expansion in the zebrafish lineage. Genome Biol Evol. 3(0):1187–1196. [DOI] [PMC free article] [PubMed] [Google Scholar]
- Nakamura T, Gehrke AR, Lemberg J, Szymaszek J, Shubin NH.. 2016. Digits and fin rays share common developmental histories. Nature 537(7619):225–228. [DOI] [PMC free article] [PubMed] [Google Scholar]
- Neafsey DE, Palumbi SR.. 2003. Genome size evolution in pufferfish: a comparative analysis of diodontid and tetraodontid pufferfish genomes. Genome Res. 13(5):821–830. [DOI] [PMC free article] [PubMed] [Google Scholar]
- Parichy DM. 2015. The natural history of model organisms: advancing biology through a deeper understanding of zebrafish ecology and evolution. eLife 4:e05635.. [DOI] [PMC free article] [PubMed] [Google Scholar]
- Pascual-Anaya J, D’Aniello S, Kuratani S, Garcia-Fernàndez J.. 2013. Evolution of Hox gene clusters in deuterostomes. BMC Dev Biol BioMed Central 13:26. [DOI] [PMC free article] [PubMed] [Google Scholar]
- Patterson LB, Bain EJ, Parichy DM.. 2014. Pigment cell interactions and differential xanthophore recruitment underlying zebrafish stripe reiteration and Danio pattern evolution. Nat Commun. 5:5299.. [DOI] [PMC free article] [PubMed] [Google Scholar]
- Peterson T, Müller GB.. 2016. Phenotypic novelty in evo-devo: the distinction between continuous and discontinuous variation and tts importance in evolutionary theory. Evol Biol. 43(3):314–335. [DOI] [PMC free article] [PubMed] [Google Scholar]
- Petrov DA. 2002. Mutational equilibrium model of genome size evolution. Theor Pop Biol. 61(4):531–544. [DOI] [PubMed] [Google Scholar]
- Rüber L, Kottelat M, Tan HH, Ng PKL, Britz R.. 2007. Evolution of miniaturization and the phylogenetic position of Paedocypris, comprising the world’s smallest vertebrate. BMC Evol Biol. 7(1):38.. [DOI] [PMC free article] [PubMed] [Google Scholar]
- Shalem O, Sanjana NE, Zhang F.. 2015. High-throughput functional genomics using CRISPR-Cas9. Nat Rev Genet. 16(5):299–311. [DOI] [PMC free article] [PubMed] [Google Scholar]
- Simão FA, Waterhouse RM, Ioannidis P, Kriventseva EV, Zdobnov EM.. 2015. BUSCO: assessing genome assembly and annotation completeness with single-copy orthologs. Bioinformatics 31(19):3210–3212. [DOI] [PubMed] [Google Scholar]
- Simpson JT. 2014. Exploring genome characteristics and sequence quality without a reference. Bioinformatics 30(9):1228–1235. [DOI] [PMC free article] [PubMed] [Google Scholar]
- Slater G, Birney E.. 2005. Automated generation of heuristics for biological sequence comparison. BMC Bioinformatics 6(1):31.. [DOI] [PMC free article] [PubMed] [Google Scholar]
- Small CM, et al. , 2016. The genome of the Gulf pipefish enables understanding of evolutionary innovations. Genome Biol. 17(1):258. [DOI] [PMC free article] [PubMed] [Google Scholar]
- Smit AFA, Hubley R.. 2017. RepeatModeler Open-1.0. 2013–2015: http://www.repeatmasker.org, last accessed February 2, 2018.
- Smit AFA, Hubley R, Green P.. 2017. RepeatMasker Open-4.0. 2013–2015: http://www.repeatmasker.org, last accessed February 2, 2018.
- Stöhr S, Martynov A.. 2016. Paedomorphosis as an evolutionary driving force: insights from deep-sea brittle stars. PLoS One 11(11):e0164562.. [DOI] [PMC free article] [PubMed] [Google Scholar]
- Stout CC, Tan M, Lemmon AR, Lemmon EM, Armbruster JW.. 2016. Resolving Cypriniformes relationships using an anchored enrichment approach. BMC Evol Biol. 16(1):244.. [DOI] [PMC free article] [PubMed] [Google Scholar]
- Streelman JT, Peichel CL, Parichy DM.. 2007. Developmental genetics of adaptation in fishes: the case for novelty. Annu Rev Ecol Evol Syst. 38(1):655–681. [Google Scholar]
- Sun C, et al. , 2012. LTR retrotransposons contribute to genomic gigantism in plethodontid salamanders. Genome Biol. 4(2):168–183. [DOI] [PMC free article] [PubMed] [Google Scholar]
- Tang KL, et al. , 2010. Systematics of the subfamily Danioninae (Teleostei: Cypriniformes: Cyprinidae). Mol Phylogenet Evol. 57(1):189–214. [DOI] [PubMed] [Google Scholar]
- Vezzi F, Narzisi G, Mishra B.. 2012. Reevaluating assembly evaluations with feature response curves: gAGE and assemblathons. PLoS One 7(12):e52210.. [DOI] [PMC free article] [PubMed] [Google Scholar]
- Vinogradov AE. 2004. Evolution of genome size: multilevel selection, mutation bias or dynamical chaos? Curr Opin Genet Dev. 14(6):620–626. [DOI] [PubMed] [Google Scholar]
- Wakeley J. 1994. Substitution-rate variation among sites and the estimation of transition bias. Mol Biol Evol. 11(3):436–442. [DOI] [PubMed] [Google Scholar]
- Wang Y, et al. , 2012. MCScanX: a toolkit for detection and evolutionary analysis of gene synteny and collinearity. Nucleic Acids Res. 40(7):e49. [DOI] [PMC free article] [PubMed] [Google Scholar]
- Weisenfeld NI, et al. , 2014. Comprehensive variation discovery in single human genomes. Nat Genet. 46(12):1350–1355. [DOI] [PMC free article] [PubMed] [Google Scholar]
- Wences AH, Schatz MC.. 2015. Metassembler: merging and optimizing de novo genome assemblies. Genome Biol. 16:207.. [DOI] [PMC free article] [PubMed] [Google Scholar]
- Yang J, et al. , 2016. The Sinocyclocheilus cavefish genome provides insights into cave adaptation. BMC Biol. 14(1):1. [DOI] [PMC free article] [PubMed] [Google Scholar]
- Yu X, Zhou T, Li K, Li Y, Zhou M.. 1987. On the karyosystematics of cyprinid fishes and a summary of fish chromosome studies in China. Genetica 72(3):225–235. [Google Scholar]
- Zhang G, et al. , 2014. Comparative genomics reveals insights into avian genome evolution and adaptation. Science 346(6215):1311–1320. [DOI] [PMC free article] [PubMed] [Google Scholar]
- Zhang Q, Edwards SV.. 2012. The evolution of intron size in amniotes: a role for powered flight? Genome Biol Evol. 4(10):1033–1043. [DOI] [PMC free article] [PubMed] [Google Scholar]
Associated Data
This section collects any data citations, data availability statements, or supplementary materials included in this article.
Supplementary Materials
Data Availability Statement
The whole-genome sequencing data have been deposited at the EMBL Nucleotide Sequence Database (ENA) under accession PRJEB15524, with the sample identifiers ERS1366602 (P. carbunculus) and ERS1366603 (P. micromegethes). The assemblies and annotation files are available for download at figshare (figshare DOI: 10.6084/m9.figshare.3969018), whereas custom scripts have been placed on GitHub (https://github.com/uio-cees/Paedocypris_gene_stats). All alignments and trees for the duplicated genes (fig. 2c and d) can be downloaded from figshare (10.6084/m9.figshare.5739627).