

Abstract
Flow cytometry is an invaluable tool utilized in modern biomedical research and clinical applications requiring high throughput, high resolution particle analysis for cytometric characterization and/or sorting of cells and particles as well as for analyzing results from immunocytometric assays. In recent years, research has focused on developing microfluidic flow cytometers with the motivation of creating smaller, less expensive, simpler, and more autonomous alternatives to conventional flow cytometers. These devices could ideally be highly portable, easy to operate without extensive user training, and utilized for research purposes and/or point-of-care diagnostics especially in limited resource facilities or locations requiring on-site analyses. However, designing a device that fulfills the criteria of high throughput analysis, automation and portability, while not sacrificing performance is not a trivial matter. This review intends to present the current state of the field and provide considerations for further improvement by focusing on the key design components of microfluidic flow cytometers. The recent innovations in particle focusing and detection strategies are detailed and compared. This review outlines performance matrix parameters of flow cytometers that are interdependent with each other, suggesting trade offs in selection based on the requirements of the applications. The ongoing contribution of microfluidics demonstrates that it is a viable technology to advance the current state of flow cytometry and develop automated, easy to operate and cost-effective flow cytometers.
Keywords: Flow Cytometry, Microfluidics, Florescence-Based Detection, Flow Focusing, Optical Detection, Impedance Spectroscopy, Electrochemical Detection, Micropump, Microvalves
INNOVATION
While providing a comprehensive overview of the recent advancements in the field of microfluidic flow cytometry, this review also adopts a new overarching perspective that serves to differentiate it from previous reviews on the subject. Microfluidic flow cytometry research has paved the way for customizable devices with a broad array of applications. This review emphasizes the fact that every application and user, depending on their needs, will have different requirements for their particular flow cytometry device. This review categorizes these criteria into two classes, functional and operational specifications. Functional specifications are well known in conventional flow cytometry and include parameters such as sensitivity, specificity, and dynamic range, while operational specifications take into account considerations like ease-of-use, portability/size, throughput, and additional features (sample preparation etc.). As the review notes, these considerations are often interdependent and competing; a user may choose to sacrifice some degree of sensitivity in order to have a small, cheap, and easy to use point-of-care device, for instance. In providing an overview of established and nascent techniques in microfabrication, particle manipulation/focusing, and detection methods, the authors recognize that these functional and operational specifications will be what dictate which techniques device designers and users choose to incorporate into their microfluidic flow cytometers. Throughout the review, the authors compare different techniques and devices in terms of these specifications, and the review concludes with a discussion that provides the reader with suggestions for optimizing some of these parameters.
1. INTRODUCTION
Over the past 40 years, flow cytometry has revolutionized high throughput particle analyses which are often necessary in studies of cell biology, protein engineering, drug discovery, medical diagnostics and other fields of biotechnology. Flow cytometry is used to analyze particles such as cells or microbeads conjugated with analytes. In conventional flow cytometers, a stream of flowing particles passes through a focused beam of laser light and characteristic absorption, reflection, scattering, or fluorescence emission by the particle is detected and quantified1. Since particles usually need to be interrogated individually, a particle focusing system is employed. These fluidic, focusing, and detection systems are the key components to a flow cytometer. Modern flow cytometers can provide multi-dimensional analysis of single cells/particles and sorting of subpopulations of cells. Cell sorting is performed by identifying and recovering a specific cell type often by quantifying multiple surface markers, commonly referred to as “clusters of differentiation”, using fluorescently labeled antibody binding. This is useful in applications such as lymphocyte subset enumeration, identification and purification of hematopoietic and other stem cells, detection and identification of cancer type, as well as monitoring cancer progression2–4. Microbead-based flow cytometers have enabled the detection and quantification of biomolecules at low concentrations through immunocytometry platforms which are capable of multiplexing to quantify several species at once5. These devices have a major role in performing immunoassays that target secreted and intracellular proteins for research and clinical diagnostic purposes.
The process flow of flow cytometry and interdependence between selection of particle manipulation techniques, detection techniques, and fabrication of devices is highlighted in Figure 1. The ongoing research in flow cytometry aims at either enhancing its functional specifications or improving its operational specifications. The functional specifications can be listed as dynamic range of detection, sensitivity, selectivity, and detection of difficult to detect biomolecules. Operational specifications include automation in sample preparation, handling, and processing, ease of operation, and throughput. These sets of specifications are interdependent and hence demand application-based trade off in their selection. The emerging field of microfluidics supported by microfabrication techniques is very relevant and is playing a leading role in reshaping the next generation of flow cytometry devices. Perhaps the largest advantage of microfluidic devices is their small size, which allows for device portability and point-of-care diagnostics. Other benefits of microfluidic systems include: reduced sample volumes, precise flow control over small volumes of fluid, stable and predictable laminar flow profiles6,7 and parallelism in operation.
Figure 1. Schematic of process flow in flow cytometers.
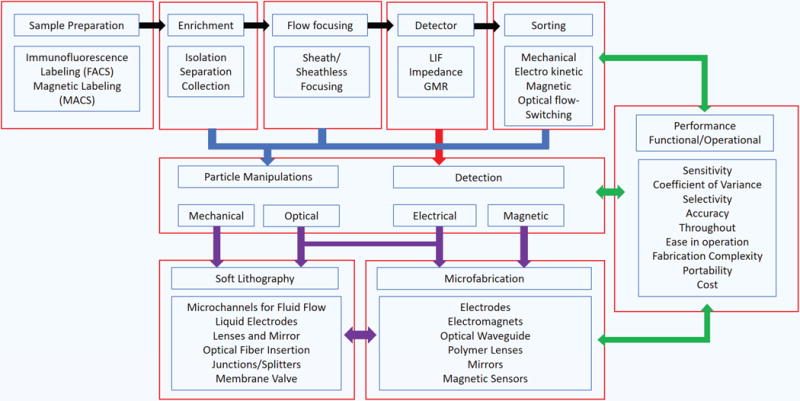
Interdependence between performance, fabrication, selection of detection and particle manipulation techniques.
In flow cytometry, particle focusing is an important component that has been diversified by microfluidics research. Traditional hydrodynamic focusing is no longer the sole option for particle focusing as researchers have explored methods like inertial focusing and other alternative approaches7. While conventional flow cytometers are largely limited to optical detection methods1, microfluidic flow cytometry has pioneered alternative detection strategies such as those based on electrical impedance and magnetism, creating the potential to explore combinatorial approaches to further expand detection capability usually limited to other types of assays. The integration of cross-platform components in microfluidic systems has made flow cytometry amenable to a variety of particle types, increased its affordability, and opened the possibility of automated and mass-produced devices. The ongoing contribution of microfluidics will help in realizing a flow cytometer as a device containing sample preparation, assay, flow cytometry, and sorting capabilities on a single integrated platform. These types of devices are an example of the “lab-on-a-chip” technology that is sought after for its portability, ease-of-use, and point-of-care potential8,9.
This review mainly intends to present the current state of, and critical constraints for progress in, the development of microfluidic flow cytometry. It begins with a brief discussion of the most common microfabrication techniques used in creating these devices. This is followed by a discussion of components used in fluidic control which are responsible for guiding the analyte through the microfluidic platform. Then it highlights different techniques of particle manipulation and flow focusing which are employed to align and present the individual particles to the detector for analysis. Lastly, detection mechanisms which are responsible for characterization of the particle are discussed. Several notable examples10–12 are discussed across multiple sections within the review because they highlight the interdependency between fabrication, flow, particle handling and quantification. In order to keep the scope of this review within the realm of flow cytometry, additional device features such as sample preparation or immunoassay capabilities and details about microfabrication are covered elsewhere8,9,13. The main objective of this review is to discuss the key components of microfluidic flow cytometry that enable researchers to develop devices that are simple, low cost, and portable. This knowledge will hopefully provide researchers with a valuable starting point in developing the next generation of flow cytometers.
2. FABRICATION OF MICROFLUIDIC FLOW CYTOMETRY DEVICES
A microfluidic flow cytometer is an integrated system comprised of cross platform components such as a network of interconnected microchannels, electrical sensors and optical components (Figure 2). These components are responsible for operations that include fluid injection and control, upstream particle manipulations, detection and downstream particle manipulations. It is quite obvious that not all components required for a functional microfluidic flow cytometry device can be fabricated using one method and instead, require a range of methods making the fabrication of these devices challenging. The selection of fabrication methods which not only simplify the fabrication of components but also are compatible with each other is important to fabricate integrated systems. This section will discuss conventional fabrication technologies and their role in fabrication of cross-platform fluidic, electrical and optical components to realize integrated microfluidic flow cytometers.
Figure 2. Schematic diagram of the micro-cytometer chip with optical and electrical components.
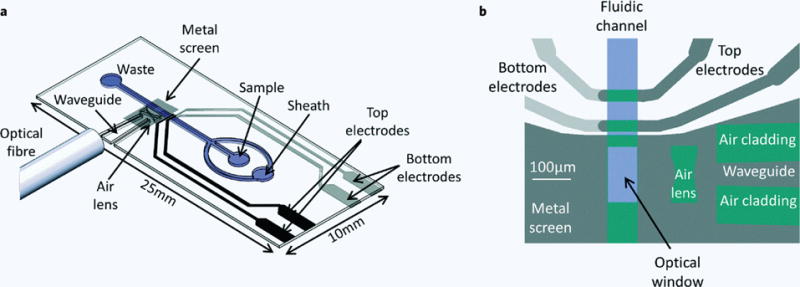
(a) Integrated electrodes and waveguide coupled to an optical fiber for light delivery. (b) Close up of the measurement region, with the lens, waveguide and impedance detection electrodes10.
2.1. Soft lithography fabrication of fluidic and optical components
The invention of soft-lithography has greatly simplified the fabrication of microfluidic devices14,15. The typical process flow of soft lithography fabrication begins with fabrication of a mold template which has the negative replica of the microchannels fabricated using a standard photolithography process. The raised features on the mold are made of UV curable negative photoresist corresponding to the microchannel dimensions and other components in the finished device. In addition, molds can be also fabricated by manual patterning of adhesive tape in a resource limited setup if the features on the device are larger than 300 μm16–18. The mold is then replicated using the thermally curable polymer polydimethylsiloxane (PDMS)19. The cured PDMS is peeled off the mold and holes are prepared in the microchannel reservoir as inlet and outlet access ports for fluid flow. The PDMS replica with holes is usually sealed to a flat substrate, typically glass. The PDMS can be bonded to glass reversibly or irreversibly using plasma bonding processes. While the photolithographic process to make the mold requires advanced facilities and equipment, manufacturing the PDMS device using replica molding itself is simple and can be done in a standard laboratory.
Numerous research laboratories have adapted soft lithography to fabricate microfluidic devices as it is robust, simple, inexpensive, reproducible, and suitable for mass production20. It is used to fabricate most of the components responsible for fluidic control and manipulation in microfluidic flow cytometers such as microchannels, junctions, splitters, mixers, valves, and pumps15. Microchannels transport reagents and samples from one point to other. Ju et al. interconnected two micro-channels of different cross sections at the heart of their flow cytometer to generate focused streams of particles for detection of mice anemia21. T or Y shaped microchannels can act as either junctions, to merge two different liquid flows into one, or splitters, to split a single flow into two branches. The width of each branch of the T or Y shaped junctions can be controlled to achieve the desired proportional merging or splitting of the incoming and/or outgoing flow22. Junctions and splitters are also used in hydrodynamic focusing and sample sorting, respectively23,24 and discussed later in this review.
Mixing of sample and reagents is a critical requirement in upstream sample preparation for flow cytometry analysis. The laminar fluid flow profile in microfluidic devices makes mixing challenging and requires integration of mixers to ensure proper mixing of sample and reagents. T/Y junctions25,26, zigzag microchannels27, serpentine microchannels28, and stagger herringbone mixers29,30 are some examples of passive microfluidic mixers that can be easily fabricated using soft lithography. Jackson et al. have demonstrated the use of T junctions fabricated using soft lithography to mix small volumes of reagents in their microfluidic flow cytometers31.
Microvalves are used to start or stop the flow of reagents whenever necessary during the operation of the flow cytometer. Membrane-based pneumatic valves are among the most widely used valves in microfluidic devices due to simplicity in their design and ease in fabrication using soft lithography. In this valve, an elastic PDMS membrane is sandwiched between two layers of microchannels, a fluidic and pneumatic control layer32,33. The microchannels on the fluidic layer guide the fluid during operation. On the other hand, microchannels on the pneumatic control layer contain either air or water and are used to apply positive or negative pressure. The applied pressure deflects the flexible membrane to open or close the valve34,35. These valves can maintain high fluidic pressure often necessary in flow cytometry fluid flow. These on-chip valves use external pneumatic systems to perform membrane deflection for their operation. The pressure applied to a single pneumatic channel can simultaneously control the flow in several microchannels. This enables the device to perform fluidic operations in parallel, increasing the throughput of the device. Among various microvalves that are described in an extensive review by Au et al.36, pneumatic37 and pinch valves38 are most suitable in microfluidic flow cytometers and immunoassay chips. A microfluidic flow cytometer for bead-based protein analysis used such pneumatic valves to control incoming fluid, outgoing waste, and isolate the reaction chambers39. Kong et al. modified a membrane valve by adding a small stop that rested against the undeflected membrane to reduce leakage40. A pneumatic valve based mixer is also used in the efficient purification and enrichment of target virus-bound magnetic beads to perform rapid virus detection using microfluidic flow cytometry41.
A microfluidic flow cytometer often needs perfusion of more than one fluid with independent control over each stream’s flow rate. So far, fluid pumping in microfluidic devices is performed using a range of on or off chip active micropumps listed in comprehensive reviews elsewhere36,42 as passive pumping is unsuitable43,44. However, the use of a sequentially activated set of pneumatic valves to produce peristalsis and fluid flow inside the microchannel is simple and the best suitable mechanism to implement on chip fluid pumping45. These pumps are relatively easy to design and can be fabricated using soft lithography. The operation of these pumps is automated using external (off chip) computer controlled pneumatic systems operating on the order of tens of Hertz. Wang et al. presented a modified on-chip peristaltic pump operating without human intervention46. They used a single pneumatic channel repeatedly crossing over the fluid channel to construct a series of membrane valves. Yang et al. subsequently used this type of peristaltic pump to load both reagents, empty the reaction chamber for analysis, and to inject sheath fluid in their microfluidic, bead-based flow cytometer for the detection of viruses41.
Soft lithography is also used to fabricate some of the optical components such as air mirrors, air lenses and microchannels to insert optical fibers and connect optical source/detector to the microfluidic flow cytometers. Lenses and mirrors are useful to focus and direct optical beams respectively for optical detection. These components improve the signal to noise ratio (SNR) of optical signals by reducing loss, scatter and spread of the optical beam. Often, air lenses are empty microchannels with concave/convex sidewalls47,48 whereas air mirrors are either empty or liquid metal filled microchannels and are used to increase the optical path length49. Empty microchannels designed to fit the optical fibers are also used to guide the insertion of optical fibers that interface optical sources and detectors to the flow cytometer. Golden et al. inserted optical fibers in microchannels to construct their multi-wavelength fluorescence-based flow cytometer. The single-mode optical fibers are used to couple excitation light from two separate laser sources and multi-mode fibers are used to collect scattered as well as emitted light from microbeads50. The optical setup of this device is shown in Figure 3. Mao et al. 51,52 and Zhao et al.53 both integrated four optical fibers to interface one excitation light source and three optical detectors for forward scatter (FSC), side scatter (SSC) and fluorescence (FL) detection in their device. Similarly, Tung et al. used six optical fibers to interface two excitation light sources and collect the light emission from four different angles54. In this way, soft lithography fabrication empowered these devices to perform detection of multiple parameters from multiple angles enhancing the functionality as well as the accuracy of the microfluidic flow cytometers. Fan et al. embedded glass microspheres in PDMS to fabricate an integrated micro ball lens array using soft lithography in the base of their flow cytometry device for multicolor fluorescence detection55. The array of lenses underneath PDMS channels close to cell detection zones in channels permitted parallel and qualitative fluorescence detection on a small footprint device to achieve high throughput. Godin et al. turned empty microchannels into waveguides by filling them with PDMS and used this approach to present their lens-less flow cytometers which distinguishes bead subpopulations using FSC and SSC39. Xun et al. improved the soft lithography technique with a second casting step and created smooth outer sidewalls in their PDMS-based flow cytometry device to minimally scatter transmitted light, making SSC detection possible for counting beads and blood cells56. Alternatively, ultraprecision milling, which carves the microchannels in plastic substrates and is suitable for industrial mass fabrication, is also explored to fabricate microfluidic flow cytometers with integrated optical fiber and mirrors57,58.
Figure 3. Microfluidic flow cytometer with integrated optical fiber and components for detection.
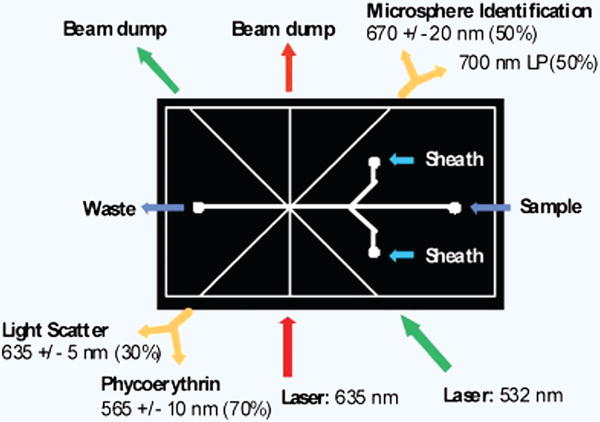
Beam splitters and band pass filters separated light at the termini of the detection optical fibers (yellow arrows). The 635 nm excitation fiber (red arrow) was single mode, all other optical fibers were multimode50.
2.2. Semiconductor microfabrication of electrical and optical components
Soft lithography alone is not adequate to fabricate cross platform components such as on-chip electrical (electrodes, sensors) and optical (lenses, optical waveguides) systems required for microfluidic flow cytometers. The semiconductor microfabrication used to fabricate integrated circuits supports fabrication of cross platform components59 and was explored widely in the fabrication of microdevices for biomedical and medical applications60,61. These techniques require specialized micromachining skills, resource intensive facilities such as a clean room and other expensive equipment62,63, but empower the building of complex but fully functional integrated microsystems which cannot be fabricated using soft lithography. Semiconductor micromachining is a well-established microfabrication technology that uses numerous individual processes and discussion of all these processes is beyond the scope of this review. However, we will list select microfabrication processes and discuss the microfluidic flow cytometry devices and components fabricated using these techniques.
In semiconductor microfabrication, photolithography64 is the most widely used process to define and select a substrate region for subsequent processing. Physical vapor deposition (PVD) of metal via techniques such as sputtering65, electron beam evaporation (EBE), and thermal evaporation66 are used to deposit conducting materials and create electrical connections and electrodes. If necessary, electrodeposition67 and electroplating68 are then used to increase the thickness of the deposited metal. The range of chemical vapor deposition techniques69,70 such as plasma-assisted chemical vapor deposition (PECVD), low pressure chemical vapor deposition (LPCVD) and atomic layer deposition (ALD) are used to deposit dielectric material on the substrates. Wet chemical71, dry reactive ion72, and plasma-assisted etching73 techniques are used to clean and remove material from selected regions of the substrate. Thermal treatments74–76 at high temperature are often used to add impurities (dopants) into the substrate as well as grow insulating oxide layers on the surface. These techniques are more than sufficient to fabricate hybrid devices required for microfluidic flow cytometers.
Microfabrication works well with a wide range of materials. However, because downstream flow cytometry evaluation often requires optical detection, a transparent material such as glass is the preferred base material to fabricate components of microfluidic flow cytometers. In addition, the stiffness of a glass base allows for the creation of more robust microfeatures than PDMS, such as the use of a rigid substrate for electrode definition, and generation of high aspect ratio microchannels77. Unlike PDMS, glass is chemically inert, thermostable at high temperatures, and not susceptible to swelling from organic solvents78,79.
Microfabrication techniques are employed in the fabrication of microfluidic flow cytometers for a variety of reasons. The most prevalent use arises from the need to incorporate electrodes within the chip59 which can be used for various purposes, such as sensors (impedance, electrochemical, or magnetic) and particle focusing using dielectrophoresis. The fabrication of electrodes uses PVD to deposit one or more thin layers of metals and photolithography and/or etching to define the shape and location of electrodes. A popular metal for electrodes is platinum, which can be deposited with sputtering or electron beam evaporation and usually requires a thin titanium base layer for adhesion10,80–82. Other metals which are good electrical conductors such as gold, silver, etc. are also used in fabrication of electrodes. Electrodes are typically then passivated by thin layer deposition of a material such as Si3N4, Al2O3, polymer, or photoresist12,81,82 to prevent damage. Such electrodes are used to fabricate electronically controlled active mixers83–88, valves and micropumps36,42,89,90 to provide a controlled degree of mixing and fluid pumping in microfluidic devices.
Electrodes are the key component behind microfluidic flow cytometers that use electrical impedance to detect particles. These electrodes may be coplanar, on opposite (top and bottom) faces91,92, or may be simple, non-microfabricated salt bridge electrodes that are inserted at either end of a microchannel93. Karen Cheung’s group was one of the first to develop a microfluidic impedance-based flow cytometer having pairs of the titanium/platinum electrodes on the top and bottom of a microchannel91,94. Later Hywel Morgan’s10 and Giovangrandi’s95 groups also used similar approach to construct their microflow cytometers for the analysis of micro beads and platelets respectively. These electrodes are fabricated by patterning a platinum metal layer evaporated on a glass substrate using microfabrication processes. In these devices, electrodes are used as impedance sensors10,11,82,96 to determine the size of beads and trigger downstream optical detection as well as to perform negative electrophoresis for sheathless particle focusing10,82 in microfluidic flow cytometers. Electrode microfabrication is not exclusive to devices that use electrical impedance detection. Helou et al. used a combination of photolithography, sputtering, and deep ion etching to create embedded electrodes, magnetophoretic nickel focusing chevrons, multi-metal giant magnetic resistor (GMR) sensors and Wheatstone bridge electrical configurations for their GMR sensors in microflow cytometers. The group has successfully demonstrated the application of their microfluidic magnetic flow cytometer to detect rare cancer cells and the diameter of the cells in whole blood12 which is briefly discussed later in this review. Chen et al. used EBE to deposit patterned thin film layers of chromium and gold onto a lithium niobate substrate in order to create interdigitated transducers. These transducers created standing surface acoustic waves to focus particles and demonstrated a sheathless microfluidic flow cytometer97.
Integration of optical components in microfluidic flow cytometers is challenging especially due their stringent non-planer geometry and material requirements. However, in the last two decades, microfluidics research has shown great potential to develop some of the optical components in microfluidic devices. The most common of these are waveguides and lenses which can help simplify the setup of off-chip equipment. Waveguides are used to guide light from an external light source to the sample and from the sample to the external detector, minimizing the losses in optical path. The microfluidic waveguides are SU-8 microchannels surrounded by air microchannels. These waveguides and lenses are fabricated by patterning optical material such as the negative photoresist SU-8 using photolithography and bonding two identical layers using suitable bonding methods. The monolithic fabrication of such waveguides and lenses removes the manual alignment process and optical losses incurred due to misalignment of these optical components.
Spencer et al. used waveguides and double-concave hollow air lens patterned in SU-8 to develop their microfluidic flow cytometer (Figure 2)10. The use of on chip waveguides and lenses enabled them to confirm the results of impedance detectors using optical detection and increased the accuracy of their system. Watts’s group used integrated SU-8 waveguides and lenses in series in their optofluidic devices to perform FSC detection and used in counting of polystyrene beads to demonstrate their flow cytometry potential98–102. They accomplished this by inserting a notch into their photolithographically patterned air lens system, which prevented interfering incident light from being transmitted via reflection and created a “hole” in the excitation beam. On chip waveguides and lenses in these devices reduced background noise to improve SNR and perform forward scatter detection and counting of polystyrene beads. Wang et al. presented a flow cytometry microchip which has SU-8 waveguides, lenses and fibers to waveguide couplers integrated in the device103. These on chip optical resources were simple to fabricate and measured four different sizes of beads and their surface roughness with simultaneous recording of forward scattering, large angle scattering and extinction signal. Rosenauer et al. used a similar approach and presented the flow cytometers to measure viability of T-lymphocyte cells using extinction signal detection104. In this way, simple fabrication of on chip optical components enabled a range of microfluidic flow cytometers to perform multi-angle and multiparametric optical detection that can be explored in numerous applications. The combination of soft lithography, metal deposition, photolithography patterning (metal/SU-8), and precision milling not only simplified the fabrication of this integrated system but also created opportunities and scope for low cost and mass producible microfluidic flow cytometers.
2.3. Optimization for rapid development of microfluidic flow cytometers
Soft lithography and semiconductor microfabrication has made it possible to fabricate a range of components for functional microfluidic flow cytometers. However, owing to the challenges in integration, these components can be on or off the chip as part of a strategy to optimize design and fabrication time, as well as cost and complexity of microfluidic flow cytometers.
The majority of microfluidic flow cytometers rely on external pumping mechanisms, such as off-chip syringes, peristaltic, negative (vacuum) and positive pressure based air pumps. Pressure based air pumps are commonly used to inject sample and regents in commercial flow cytometers. While use of external syringe pumps to infuse each fluid into a microfluidic flow cytometer is simple and speeds up development, it is expensive and hinders portability. One syringe pump with manual intervention was used to pump several fluids in flow cytometers making operation cost effective105. The split microchannel that enters the core channel from either side is used to perform flow focusing using a single syringe pump106. However, this approach lacked independent flow control of each sample and required manual intervention to switch between introduction of samples and reagents in channels.
The integration of pumping within microfluidic flow cytometers is critical to improve the portability of these devices. PDMS membrane based micromixers, microvalves and micropumps are inexpensive, simple to fabricate using soft-lithography and require external pneumatic actuation for their operations. Often such external pneumatic actuation systems can be bulky, expensive and a limiting factor in the portability of devices. The development of miniaturized pneumatic controls to operate microvalves and pumps is instrumental in exploring their simplicity. Electronically actuated micromixers, microvalves and micropumps have small footprints and support automation. However, they require complex microfabrication and often produce lower membrane displacements and pressures compared to pneumatic actuation.
Most of the optical components and instrumentation for microfluidic flow cytometers are located off-chip. The use of external free space optics to simplify the design is common but neither cost effective nor suitable for portability of devices. The simple insertion of optical fibers or integration of waveguides to connect an external optical source and a single detector to the flow cytometer incorporates modularity in the system and reduces the size of the detection system. This facilitates the development of modular, compact and low cost application specific optical systems for flow cytometers and reduces the overall cost and complexity of these systems.
Spencer’s10 and Holme’s82 microfluidic flow cytometers are some illustrative examples that exhibit optimizations as discussed above. With this discussion, it is quite clear that the proper selection of on or off chip components along with knowledge of microfabrication technologies and their capability is extremely important to optimize resources as well as efforts during development of microfluidic flow cytometers.
3. PARTICLE MANIPULATIONS
Flow cytometry relies on particle manipulation techniques to perform operations such as particle isolation, separation, enrichment, sorting and focusing as required in a functioning device. The microfluidic flow cytometer may or may not use all of these operations distinctly, but in one way or another these individual operations contribute to particle enrichment, focusing and sorting. The particle manipulations can be performed using several techniques which can be classified as either passive or active types. The passive techniques mostly redesign the section of microchannels by integrating physical microstructures suitable to manipulate particles such as chevron shapes, arrays of microposts or microgrooves, etc. These microstructures are easy to fabricate using soft lithography, simplifying the realization of the device. Active techniques use advanced phenomena such as electrophoresis, magnetophoresis, acoustophoresis, photophoresis, or electro-osmosis and require integration of electrodes or optical components that can be fabricated using the microfabrication techniques discussed earlier. Additionally, the laminar flow regime and multiphase flow characteristic of microfluidics enable precise droplet generation, which can be achieved by both passive and active means. Seemann et al.107 and Sharma et al.108 have published detailed reviews on the operation of droplet-based microfluidics along with its applications that range from fast analytical systems, synthesis of advanced materials, and single cell biological assays. The droplet-based technology mostly used to manipulate particles in microfluidic flow cytometry is highlighted here in subsequent sections. The selection of an appropriate particle manipulation technique depends on mechanical, electrical, optical, and magnetic properties of cells/particles. Table 1 lists the different particle manipulation techniques, and the required characteristics of cells/particles and function that can be achieved using these techniques.
Table 1.
List of particle manipulations techniques and corresponding particle characteristics requirements.
| Properties | Parameter of particle | Manipulation technique | Function | Advantage | Disadvantage |
|---|---|---|---|---|---|
| Mechanical | Size, shape, density, compressibility | Hydrodynamic Acoustic | Isolation, separation, sorting, and focusing | Label free, simple and high throughput | Low specificity and possible clogging |
| Electrical | Charge, polarizability, dielectric constant | Electrophoresis, Dielectrophoresis Electro-osmosis | Separation, sorting and focusing | Label free | Effect of electric field on particles/cells |
| Magnetic | Magnetic polarizability, susceptibility | Magnetophoresis | Isolation, separation and sorting | High specificity, easy implementation | Joule heating and magnetic labeling |
| Optical | Optical density, index of refraction | Optophoresis | Isolation, separation, sorting and focusing | High specificity | Optical setup and fluorescence labels |
In this section, we attempted to highlight some of the known particle enrichment and sorting techniques used in flow cytometry. The particle focusing is discussed in more detail in the next section due to its central role in realization of microfluidic flow cytometers. Nevertheless, particle enrichment or sorting could be optional to enforce the simplification in development of a research prototype, but a resourceful real-life micro-fluidic flow cytometer would be incomplete without these operations.
3.1. Particle enrichment
The samples used in flow cytometry analysis are often composed of heterogeneous cell/particle populations. In flow cytometry, particle enrichment is used to increase the concentration of specific particles for analysis in a downstream microchannel. The isolation and optimization of concentrations of a specific cell/particle population is essential to either avoid overlap in detection of particles or tune the particle stream in accordance with the speed of the data acquisition system. In addition, sample enrichment helps to concentrate the sample analytes in the vicinity of the detection site which enables the detection of small sample amounts using less sensitive detectors. This ultimately contributes to enhance the accuracy and sensitivity of detection109,110.
Microfluidics have been used in several ways to perform particle enrichment109,110. For example, Hsiu-hung Chen et al. used a grooved structure in microchannels in order to perform the particle manipulations111. Slanted grooves created size-dependent particle enrichment whereas V-shaped grooves exhibited particle focusing. The size dependent alignment of the concentration of particles is slow but facilitated the visualization of sizing and counting of mouse dendritic cells and microbeads. Such groove based particle enrichment and focusing is certainly easy to explore in microfluidic flow cytometry devices but speed may reduce the realization of high throughput. Sulchek’s group explored the difference in viscoelastic properties of cells such as cell size, stiffness and the relaxation time to separate two leukemia cell lines HL60 and K562 and enrich K562 cells from healthy leukocytes112. Their device used diagonal ridges on the bottom of the microchannel to apply repeated compression and relaxation events on moving cells and alter cell trajectories depending on their viscoelastic properties. Their device is simple to fabricate using soft lithography and performed 75% to 90% enrichment of leukemia cells but may be limited by the biomechanical heterogeneity within each cell type.
Laurell’s group performed label free enrichment of prostate cancer cells in blood using acoustophoresis113. The acoustic force exerted by a piezoelectric transducer directed pre-aligned cells toward the central node of a microchannel at a rate determined by the cell size, the cell mass density, and the cell compressibility. These properties of blood cells compared to prostate cancer cells are different, facilitating acoustophoretic enrichment of prostate cancer cells. Acoustophoretic realignment in this work (Figure 4b) demonstrated the enrichment of prostate cancer cells with 99% purity and 93% recovery when mixed with white blood cells113.
Figure 4. Particle manipulation schemes.
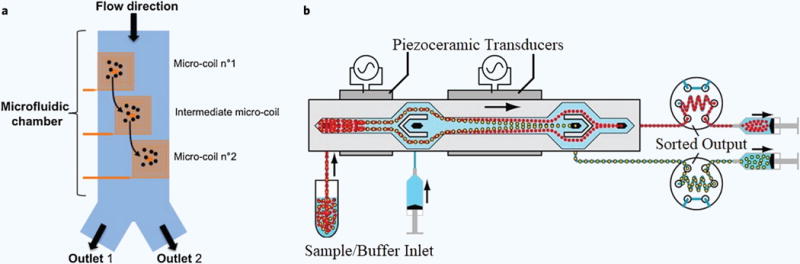
(a) Schematic of device with integrated magnetic micro coils to perform spatial manipulations of magnetic particles and eventual sorting129. (b) Schematic of the flow configuration for the acoustophoresis cell separation113.
Dielectrophoresis is a motion of dielectric particles in a non-uniform electric field which depends on size, polarization and dielectric characteristics of a particle, and can be used to enrich particles with the same polarization, size and/or dielectric constant114–116. Hadi Shafiee et al. used contactless dielectrophoresis to demonstrate high specificity enrichment of 2 μm polystyrene beads and THP-1 human leukemia cells in the heart of their device117.
Osman et al. used magnetic-activated cell sorting (MACS) in their microfluidic device to perform ~94% enrichment of Human Embryonic Kidney (HEK) 293 cells for downstream flow cytometry analysis from a mixture of Jurkat cells and HEK 293 cells118. They integrated an array of micromagnets on the bottom of the PDMS microchannel to trap Jurkat cells labelled with 50 nm magnetic nanoparticles when the mixture flowed through the microchannel. The magnetophoretic trapping of such magnetically labelled particles by placing an external permanent magnet in the vicinity of the microchannel is a common method of microfluidic particle enrichment119–123.
Although these are examples of microfluidic cell enrichment without integrated flow cytometry analysis downstream, such particle enrichment can be easily coupled with microfluidic flow cytometers. However, it is important to consider that single enrichment techniques do not fit all types of particles as each of these enrichment techniques works well with certain properties of the cells/particles, which changes from sample to sample in flow cytometers.
3.2. Particle sorting
In flow cytometry, sorting is an optional function and used to recover select subpopulations from the sample. The extraction of sample without damage is necessary to further use the extracted sample. The sorting process is judged based on the purity, throughput and damage of the sorted output. The sorting is mostly performed in conjunction with detection of the particle and uses one of the particle manipulation techniques to switch flow at the sorting junction and direct the flow of particles to be sorted into the desired microchannel where they can be collected. The detection of particles can be performed using any one of the detection techniques discussed later in this review. Like particle enrichment, microfluidic sorting can also be performed using passive and active microfluidic particle manipulation techniques and is discussed in an extensive review elsewhere124,125. The selection of the sorting technique used to sort particles after flow cytometry analysis depends on mechanical, electrical, optical and/or magnetic properties of particles or cells. Accordingly, hydrodynamic, acoustic, optical, magnetic, and electro-kinetic flow switching techniques can be employed.
Cho et al. used fluorescence activated cell sorting (FACS) in their microflow cytometer for isolation of E. coli cells126. They integrated the piezoelectric actuator near a sorting junction of the device to switch flow and divert the flow of select particles into desired microchannels where they could be collected. The optical system was used to detect the fluorescently labelled E. coli cells from a mixed sample suspension and trigger piezoelectric actuators. The use of FACS in conjunction with a piezoelectric actuator produced sorting with a speed of 1000 cells/second due to the fast response times of piezoelectric actuators.
The use of optical tweezers in a sorting junction was also demonstrated in low speed (5 cells/second) sorting of yeast cells and human embryonic stem cells with high purity up to 98%127. Unlike the use of flow switching, Butler’s group used optical force to change the trajectory of particles in laminar flow to sort the selected particles128. This optical switching was used to perform FACS sorting of green fluorescent protein (GFP) labelled mammalian cells and a purity of 85% was obtained with a throughput of 106 cells/second.
The use of magnetic actuation in sorting junctions is also common to direct the flow of magnetic or particles tagged with magnetic nanoparticles in MACS (Figure 4a). The controllable electromagnets are then placed in the vicinity of the sorting junction and output of the detector is used to trigger the electromagnet in order to redirect the flow of select particles to the collection reservoir129. Such magnetic actuation for sorting is followed by optical detection in the commercial microchip based flow cytometer MACSQuant® Tyto.
Electro-kinetic actuation is performed by integrating an electrode at or near the vicinity of the sorting junction. The flow switching of particles is then achieved using either electrophoresis (DC voltage) of charged particles or dielectrophoresis (AC voltage) of electrically polarizable particles to sort particles in conjunction with a detector. Electrophoresis is a common approach in droplet based flow cytometers in which the droplets are first electrically charged and then passed through electrodes. The electrodes are then actuated to deflect the charged droplets into desired collection reservoirs and achieve detection based sorting. This approach is common in commercial flow sorters. This approach is suitable only if the particles are charged or can be charged, and may not be suitable for all the particles.
Yasuda’s group used microchannels filled with conducting gel in the vicinity of the sorting junction to apply an electric field and generate contactless electrophoresis130 for cell sorting. The group performed sorting of COS cells with 100% accuracy but the speed of sorting was limited by image acquisition hardware of fluorescence based detection. Yao Bo et al. also used this approach in their FACS microfluidic flow cytometer and used sorting to determine the apoptosis and necrosis of HeLa cells. Although their device was simple, the use of gravity driven flow significantly limited the sorting speed of device131.
Dielectrophoretic actuation is suitable for switching of particles which can be polarized in non-uniform electric fields. Baret et al. used dielectrophoresis in their fluorescence-activated droplet sorter (FADS) to perform FACS of E. coli encapsulated in droplets. They were able to record more than 99% accuracy with a speed of 2000 droplets/second, highlighting the potential of this technique to perform accurate and high throughput sorting132. Optical imaging based detection in conjunction with dielectrophoresis switching using liquid electrodes has demonstrated droplet sorting with 90% accuracy133,134. Wang et al. used electrodes integrated into sidewalls of microchannels to perform dielectrophoretic switching for sorting of microbeads in five different reservoirs in their on-chip flow cytometer135.
Sorting is also performed by integrating a pneumatic valve in a micro-channel at a sorting junction to switch the flow in which the throughput is controlled by the response time of pneumatic actuation136. Wolff et al. have demonstrated sorting as well as particle enrichment using pressure driven fluid flow switching integrated at the sorting junction137. Their micro FACS based sorting device demonstrated 100-fold enrichment of beads and 12,000 cells/second through-puts in sorting of fluorescent latex beads mixed with chicken red blood cells. These results are a clear indication of the fact that microfluidic flow cytometry is capable of matching both the functional as well as performance specifications of conventional flow cytometers with significant reduction in size and cost. The flexibility of microfluidic flow cytometry to accommodate more than one sorting technique enables researchers to optimize their design based on properties of the particles, complexity of implementation, purity and speed of sorting.
4. PARTICLE FOCUSING STRATEGIES
Along with developing and improving detection methods, innovation in focusing strategies has been a primary research thrust in microfluidic flow cytometry. A key component of nearly all microfluidic flow cytometry systems is focusing the sample flow into a narrow linear stream of particles. This is often necessary for guiding the particles to a defined focal region coincident with either an optical or alternative sensing element in order to conduct an accurate and consistent analysis. The ideal focusing method should achieve minimal particle overlap and obscuration, so that each particle may be analyzed discretely. The efficiency of particle focusing techniques is often reported as either a full width half maximum (FWHM) or coefficient of variance (CV) of the focused particle profile which usually follows a Gaussian distribution in particle centroid position. With the advent of microfluidic flow cytometry, a wide variety of particle focusing techniques have been developed. Table 2 summarizes the techniques currently used in these types of devices. The choice of focusing classifications discussed here was motivated by the design and layout of devices and the different particle manipulation principles employed.
Table 2.
Particle focusing methods used for microfluidic flow cytometry.
| Focusing method | Mechanism | Notes | References |
|---|---|---|---|
| Hydrodynamic: 2D 3D |
Sheath fluid streams manipulate the sample stream. Sheath flows act on a single plane. Sheath flows completely surround the sample stream. |
Simple to implement. Less control over vertical position. More complex design. Superior particle interrogation to 2D. |
10, 23, 55, 156 24, 50, 140, 166 |
| Constriction channel | A narrow microchannel with a cross-sectional area on par with the size of the target particles. | Prone to clogging. Restricted to cellular targets. |
80, 93, 144, 168 |
| Inertial | Secondary forces (Dean flows) generated by changes in channel geometry manipulate the particles. | Capable of 3D focusing. Effected by particle size. |
166, 146–148 |
| Other: Dielectrophoresis Acoustic Wave Magnetism |
An electric field repels particles away from electrodes. Directed sound waves manipulate particles. Magnetic fields attract paramagnetic particles. |
Depends on dielectric characteristic of particles and suspensions. Effected by particle size. Throughput constraints. Requires microfabricated transducers. Requires SPION-labeling for cells. |
82 97, 149 12 |
4.1. Hydrodynamic focusing
Hydrodynamic focusing is the most common focusing technique used in microfluidics due to its simplicity and ease in implementation. In this method, colaminar fluid streams such as one sample fluid and other sheath/buffer fluids are infused at different flow rates. Their flow rates are adjusted to converge and focus the stream of particles/cells in a microchannel with minimal mixing between the two fluids. Hydrodynamic focusing is a demonstration of conservation of mass, where all streams in a main microchannel flow at the same velocity. As a result, each stream entering the main channel needs to increase or decrease its velocity compared to their parent channel without changing their total flow rate. Thus, the sample stream tends to increase in velocity which requires it to thin in order to maintain its flow rate, while the sheathing streams decelerate and widen. Figure 5 is an illustration of how hydrodynamic focusing works under laminar flow conditions in microchannels, in this case using the common T-junction employed for this purpose138. Hydrodynamic focusing can be two or three dimensional, with sheath flows partially (laterally) or fully surrounding the sample stream. 2D focusing is usually employed in planar microfluidic devices, which focuses the sample stream laterally into a vertical plane. 3D focusing is used in conventional flow cytometers and has the advantage of focusing particles to a point thereby preventing particle overlap in the vertical direction, and improving analytical sensitivity; however, 3D focusing can be accomplished with microfluidics but it usually requires specialized microfabrication and modeling. Yang et al. used the conventional method for lateral hydrodynamic focusing in their device, employing a T or Y-shaped channel junction to bring two sheath flows in contact with the sample stream23. This 2D focusing was able to form a sample stream with a minimum width of 15 μm, which was sufficient for the 6 μm beads used. Choi et al. had a creative take on 2D focusing in their device for the detection and quantification of bacteria139. While most electrical impedance-based microfluidic flow cytometers use constriction channels for focusing (see next subsection), crafting a microchannel on par with the dimensions of the smallest bacteria, like the submicron sized F. tularensis, was not feasible. Instead, the researchers used a “virtual wall” of nonconducting sheath fluid to focus the bacteria to one side of a microchannel for impedance analysis. The sensitivity of their device was found to be proportional to the flow rate of the sheath fluid “wall”. While Golden et al. also used a Y-shaped junction in their device, they incorporated downstream micropatterned chevrons in the channel to allow the sheath fluid to flow around the sample, achieving 3D focusing50. However, it was noted that these chevrons could become bubble traps, which would cause flow irregularities. The Wang lab was one of the first to develop a successful 3D hydrodynamic focusing unit for microfluidic flow cytometry, employing a sloped, photolithographically patterned geometry for the convergence of the sheath and sample flows24. The fabrication of this unit was significantly more complex than a simple T or Y junction, requiring several photomasks and a custom-made chuck for tilting the sample during the photolithography process in order to define the sloped channel. Lin et al. achieved full 3D focusing by employing a very simple design: a single large (2–3 mm diameter) vertical sheath inlet orthogonal to the sample channel140. This vertical sheath intersected and surrounded the axial sample flow. However, very high sheath flow rates were required for the sample stream to be fully enveloped, which is a common issue for 3D hydrodynamic focusing.
Figure 5. Lateral hydrodynamic focusing in microchannels.
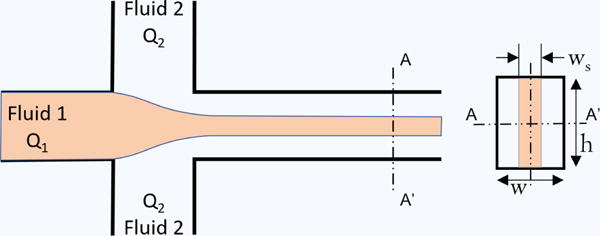
Fluid 1 is the sheath fluid, Fluid 2 is the sample fluid containing the particles to be focused, and Q1 and Q2 are their respective flow rates.
While hydrodynamic focusing is very common and is used in nearly all benchtop flow cytometers, FACS instruments, and microfluidic coulter counters141–143, it is not without its downside. Hydrodynamic focusing requires large fluid reservoirs and volumes of sheath fluid, and additional pumps to move this fluid. These requirements hinder the simplicity, utility and portability of microfluidic flow cytometers that use hydrodynamic focusing. This has prompted innovation in particle focusing techniques by those developing novel microfluidic flow cytometers.
4.2. Constriction channels
For those flow cytometers that use electrical impedance as their detection principle, a simple constriction channel is often the best choice. As exemplified by Chen et al.’s device, a constriction channel should have a cross-sectional area on par with the diameter of the cells being analyzed93 so that the ratio of cell diameter to channel diameter is on the order of one. This allows cells to deform and squeeze through the channel under negative applied pressure, and limits the passage of cells to a single file stream. Constriction channels help to prevent current leakage during impedance measurements and can add an additional cell classification variable, elongation length, which was also quantified by the Chen group. However, constriction channels are obviously susceptible to clogging. To address this, the Chen group created a second iteration of their device which incorporated a pneumatic valve over the constriction channel which could be actuated to clear any clogged cells144. Figure 6 shows the operating principle of this pneumatic valve-constriction channel combination. In the event of a channel blockage, the valve can be subjected to negative applied pressure, causing a concave deformation of the PDMS membrane and increasing the channel height to flush the clogging material.
Figure 6. Clog-proof constriction channel.
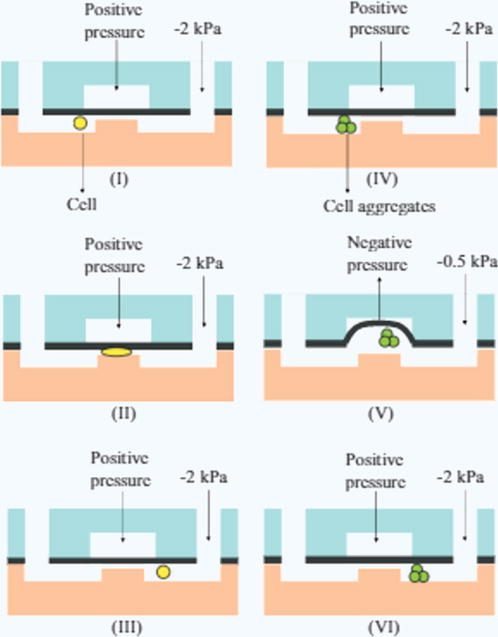
(I)–(III) shows the normal process of a cell passing through the constriction channel. (IV)–(VI) shows the opening of the pneumatic valve to widen the constriction channel to accommodate clogging material144.
4.3. Inertial focusing
Another sheathless particle focusing strategy is that of inertial focusing. Like constriction channels, inertial focusing is passive and relies on the design and geometry of the device. However, as the name implies, inertial focusing also requires higher Reynolds numbers (ratio of inertial to viscous forces) so that inertial effects are felt by particles and thus can only operate at higher flow rates, which is often advantageous for high throughput devices. Inertial focusing is dependent on three forces acting on a particle: a microchannel wall interaction force, a shear gradient lift force, and drag forces from secondary flows145. The most common types of secondary flows are known as Dean flows, which are typically generated via centrifugal forces in microchannels with curved geometries. For example, Oakey et al. achieved inertial focusing of microbeads by designing a device with a combination of an asymmetrically curved serpentine channel followed by a straight rectangular channel146. The Dean flows generated in the curved channel, in conjunction with the other two forces (wall interaction force and a shear gradient lift force), helped to bias the microbeads to one side of the channel in a single uniform line. Bhagat et al. used a similar approach with a spiral shaped microchannel that achieved 3D inertial focusing147. However, in a cell counting experiment their device displayed a large coefficient of variation (58%), likely due to variations in the sizes of the cells. Another approach reported by Chung et al., utilized a long (6 cm) straight channel with 30 “steps” consisting of 20 μm differentials in the channel height148. This device and its focusing mechanism are shown in Figure 7. Like the Oakey device, secondary flows were generated by these steps, which in conjunction with normal inertial forces focused beads to a single equilibrium position in the center of the channel. The Chung device outperformed the Oakey group’s, focusing microbeads to the channel center with a 99.77% efficiency and a full width half maximum (FWHM, a quantity related to the focused stream width) on par with the diameter of the beads; in contrast, the Oakey device could only focus microbeads to one side of the channel, with a FWHM at least twice the size of the beads. Inertial focusing relies on high flow rates and relatively higher Reynolds numbers (Re = 83.33 for the Chung device) compared to many microfluidic devices operating in the creeping flow limit (Re < 1). Additionally, most inertial focusing mechanisms are most efficient within a single Reynolds number range constraining operating parameters. Focusing efficiency also likely depends on particle size, since inertial forces square with the particle radius10.
Figure 7. Stepped inertial focusing used in focusing a suspension of polystyrene microbeads and Jurkat (human leukemia) cells.
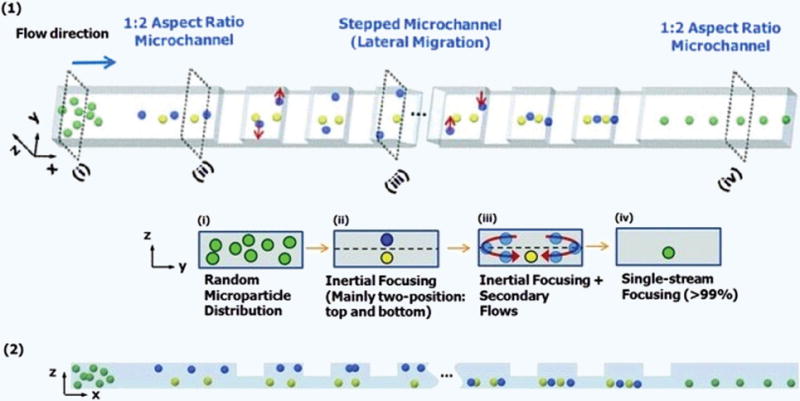
(1) The progression (i–iv) of particle focusing with flow through the stepped microchannel, shown in lateral cross section in (2)148.
4.4. Alternative strategies
While the previous three strategies are entirely flow based and constitute the majority of focusing methods being explored in microfluidic flow cytometry, there are several active methods to particle focusing that are worth noting. Holmes et al. used negative dielectrophoresis (nDEP) to focus microbeads followed by optical and impedance based detection82. This device was designed with electrodes placed on the top and bottom of the channel walls, upstream of the detection region. Application of current through these electrodes generated an electric field gradient that repelled the flowing microbeads away from the channel walls via DEP, focusing them in the center. However, since DEP is a relatively weak polarization force, this focusing strategy limited the throughput of the device, since using flow velocities higher than 50 mm/s negatively affected the DEP focusing. Negative dielectrophoresis can also be used as a sorting mechanism in microfluidic flow cytometers that have FACS capability135. In a similar manner, the Helou group used magnetic fields to focus magnetically labeled cells in their device12. This was done with the use of nickel chevrons patterned to the bottom of the flow channel that were magnetized with an NdFeB magnet. These chevrons generated a magnetic field gradient that pulled magnetic beads and superparamagnetic iron oxide nanoparticle (SPION) labeled cells to the center of the channel in a single line. They also had the added benefit of filtering out excess, unbound SPIONs, possibly removing the need for a washing step prior to adding the sample to the device. While the device achieved excellent focusing, the limited adoption of SPION labeling and its associated issues (cellular incorporation, potential cytotoxicity) may hinder widespread use of this technique. Perhaps the most unique focusing innovation is that of acoustic wave particle focusing. Chen et al., used standing surface acoustic waves (SSAWs) to manipulate cells and microbeads in their microfluidic flow cytometer97. SSAWs produce an acoustic force whose magnitude and direction is related to the relative acoustic impedance of the particle compared to the fluid as a function of density ratio and speed of sound ratio of the particle compared to the surrounding fluid. A diagram of this device is shown in Figure 8. The 200 μm wavelength SSAWs were generated at a resonance frequency of 19 MHz by two microfabricated interdigitated transducers that were positioned on either side of the flow channel. SSAWs are safe for cells and were able induce 3D focusing, but it was noted that focusing performance decreased with smaller particles, with high coefficients of variance (CV) for leukemia cells and 7 μm microbeads (22.0% and 19.4% respectively). Additionally, the specialized fabrication of acoustic piezoelectric elements and equipment needed — a SSAW signal generator and power amplifier — may limit accessibility. Suthanthiraraj et al. used a slightly different approach to acoustic focusing, positioning a lead zirconate titanate (PZT) transducer below the microchannel149. They found that their devices were amenable to parallelization and could focus multiple streams of particles in a single microchannel.
Figure 8. Standing surface acoustic waves particle focusing.
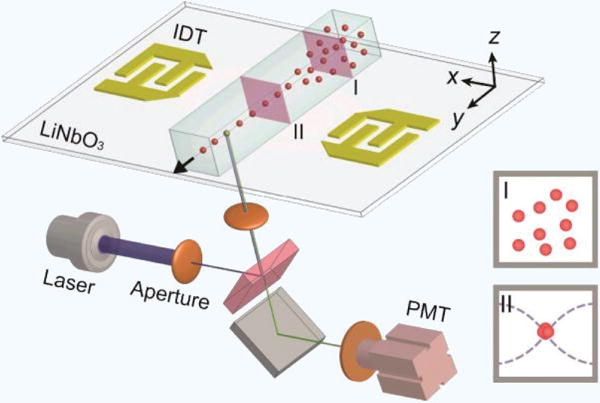
A pair of interdigitated transducers (IDTs) positioned on either side of the microchannel generate acoustic waves which manipulate dispersed particles (I) into a single file line (II). These focused particles are then analyzed using a standard LIF flow cytometry set up97.
Finally, there are a limited number of research papers that completely eliminated particle focusing in their devices, due to innovative approaches in their flow cytometry detection methods. Spencer et al. created a device that used a combination of electrical impedance, fluorescence, and side scatter to analyze cells and microbeads; measuring impedance and fluorescent signals simultaneously and using signal processing software allowed for corrections due to differing particle positions within the channel10. However, it was shown that using conventional hydrodynamic focusing slightly improved the device’s performance with regards to decreasing the detection CV. Regmi et al. completely eliminated the need for focusing cells in their flow cytometer by using a light sheet-based imaging technique that analyzes the entire cross sectional area of the flow channel 150. However, their device suffered from sensitivity issues, as discussed in the Detection Principles subsection.
In summary, while hydrodynamic focusing remains the most common particle focusing method in microfluidic flow cytometry due to its ease of implementation and proven effectiveness, the large external components (sheath fluid reservoirs and pumps) required hinders its utility for compact and portable devices. Constriction channels are ideal for cellular devices that use impedance-based detection, but are not suitable for nondeformable microbeads and are prone to clogging. Inertial focusing is another passive method that makes use of unique microchannel geometries, but its focusing efficiency is affected by channel design, flow rate and particle size. Dielectrophoresis and acoustic wave focusing required advanced actuators increasing device complexity and also suffer from similar particle size-based issues. Finally, while it may be possible to create a microfluidic flow cytometer that eliminates particle focusing, such devices are likely to have lower detection sensitivities.
5. MICROFLUIDIC FLOW CYTOMETRY DETECTION MECHANISMS
The specific detection mechanism chosen for analyte quantification directs the necessary analyte preparation steps to be compatible with the chosen detection method and can shape most of the microfluidic system architecture. There are several ways to detect samples depending on the assay and the type of analysis needed. This section summarizes the diverse detection and quantification mechanisms currently used in microfluidic flow cytometry. Many devices use external labels such as antibodies to selectively conjugate a quantifiable target to the analyte, but certain techniques such as image processing and electrical impedance can be used with a label-free approach. Table 3 summarizes the detection methods currently employed in prototype, research-based, and commercial microfluidic flow cytometers.
Table 3.
Detection methods used in microfluidic flow cytometry.
| Detection Method | Mechanism | Notes | References |
|---|---|---|---|
| Optical: Fluorescence Imaging | Excitation light hits a fluorophore on the particle, triggering an emission of photons at a different wavelength that can be detected. Camera captures images of flowing particles. |
Capable of multiplexing with different colors. Waveguides increase precision. Typically uses CMOS or CCD cameras, a light source, and analysis algorithm. |
10, 23, 82, 140, 146, 155 156, 150, 106, 93 |
| Electrical: Impedance | Electric current between electrodes is perturbed when a particle flows through it. | Microfluidic devices typically use alternating current (AC). Requires impedance spectroscope |
10, 80, 93, 144, 168, 139 |
| Magnetic | Magnetic fields are perturbed when a paramagnetic particle flows through them. | Typically uses GMR sensors. SPION-labeled cells. |
12, 106, 170 |
5.1. Fluorescence-based detection
Laser induced fluorescence (LIF) is the most commonly used method for particle detection in flow cytometry, in either conventional or microfluidic systems. It is the standard detection modality used in commercial flow cytometers and also widely adopted in microfluidic flow cytometry due to its ability to offer the broadest array of applications, techniques, and equipment. This technique relies on the release of photons from fluorescently active tags that are bound to the analyte. A monochromatic laser is used to excite the particular fluorescent tag, which then emits photons at a different lower energy wavelength in all directions that can be collected and measured. The emitted photons are confined to a wavelength different from the excitation photon wavelength and separated from the emission signal using suitable optics.
In order to control the light path, dichroic mirrors which reflect specific light wavelengths (colors) while allowing all other wavelengths to pass through are used. They are also often used to confine both the excitation light source (laser or diode) and emission light detector to a single side of the device, picking up emission photons along the same path as the excitation laser travels. The excitation photons are reflected by the mirror and focused onto the sample, while the fluorescent photons are emitted back at the source, pass through the mirror and can be detected. Any back-scattered excitation photons are also reflected by the dichroic mirror back towards the excitation source, and are not picked up in the detector. Band-pass filters are also used to allow only light within a specific range of wavelengths to pass through, allowing for very precise separation of a particular band of wavelength. Generally, bandpass filters are used on both the excitation light from the laser diode and the captured emission light from the sample. This allows for a stronger signal to noise ratio during detection by excluding wavelengths that play no role in the assay.
The emission detector is typically either a photomultiplier tube (PMT), charge-coupled device (CCD), or avalanche photodiode (APD). A PMT is a type of vacuum tube and is a common detector still used in LIF today. It consists of a photocathode that ejects an electron upon being struck by a photon (known as the photoelectric effect) and an electron multiplier which causes the ejected electron to become a current of measurable size by secondary emission. Due to the electron multiplier, the signal is amplified sufficiently such that even individual photons can cause a sharp current pulse that can be converted into a digital signal. A more complicated sensor is a charge-coupled device (CCD), which charges a photoactive capacitor and then amplifies the charge and converts it to a measurable voltage. These are often used as digital cameras, with arrays of capacitors creating pixels to allow for pinpointing the location of the signal within a wider image. Complementary metal oxide semiconductor (CMOS) based sensors, which employ arrays of avalanche photodiodes to amplify incident photons, are also widely used sensors for the detector.
The key feature that makes LIF so useful is that the emission intensity of fluorescence tags is a function of tag concentration, allowing for accurate quantification over a large range of concentrations. This system is also capable of multiplexed detection as shown in Figure 9, by adding additional lasers, detectors and/or fluorescent tags covering different wavelengths, as the excitation and emission wavelength spectra are specific to each florescent tag used. The principle drawback of LIF detection is the amount and complexity of off-chip equipment required. The addition of large microscopes, multiple lasers, and detectors can decrease the device’s compactness and portability while increasing its cost.
Figure 9. Typical optical setup for a LIF microfluidic flow cyto meter.
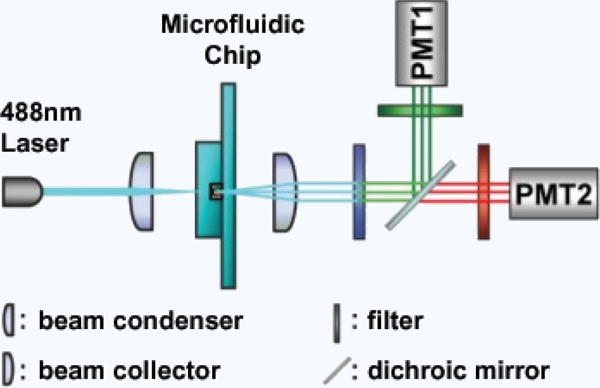
Note the two photomultiplier tubes (PMTs) allowing for sample multiplexing169.
In conventional optical flow cytometry, forward scattered (FSC), side scattered (SSC), extinction (EX) and excitation light signals are typically detected. FSC data is correlated with the size of the particle and is thus commonly used to discriminate and “gate out” particle aggregates, while SSC is correlated with particle granularity which can be used to differentiate cell types110. Extinction signal (EX) which is the loss of optical signal due to absorption in and scattering from the particle can be used to determine the size and viability of cells. Watts et al. were able to overcome the problem of large amounts of noise in FSC measurements due to divergent rays of transmitted light masking FSC light102. When testing the device by quantifying 5 μm microbeads, SSC data was also collected from the top of the chip to confirm the FSC results. The researchers achieved a coefficient of variation of 29%, which was reduced to 18.3% when both FSC and SSC were taken into account. Xun et al. used a combined LIF and SSC microfluidic flow cytometer to count microbeads and FITC-labeled CD45+ lymphocytes in whole blood56. All optical equipment, including lenses, was off-chip, and the SSC PMT detector did not have a bandpass filter due to the SSC intensity being much greater than the FITC fluorescence. For one type of microbead the device had CVs of 8.37% and 2.46% for SSC and fluorescence detection, respectively, though using smaller microbeads increased these CVs substantially. For the lymphocyte experiments, the device classified 43.1% of the particles as CD45+ lymphocytes, compared to 32.9% for a commercial flow cytometer.
Yang et al., used a microfluidic flow cytometry approach with LIF based detection detecting fluorescently labeled antibodies specific to a viral capsid antigen in order to detect and sort target viruses such as dengue23. A 473 nm laser was used for excitation, and their fluorescent tag emits between 500 nm and 575 nm. They used a beam splitter to detect the fluorescence signal using both a CCD and a PMT. In this assay, the fluorescence intensity was directly correlated to the concentration of the analyte. The signal was immediately analyzed by a computer algorithm to allow the microbeads to be sorted by actuating a downstream valve. The device’s limit of detection (LOD) was reported as 103 plaque forming units (PFU) of dengue virus per milliliter. A similar multiplexed assay by Holmes et al. used three different tagged secondary antibodies simultaneously to demonstrate a proof-of-concept design of a microchip flow cytometer to perform bead based immunoassays, in this case detecting either human or rabbit antibodies82. Three anti-IgG antibodies were conjugated to different fluorescent dyes (Cy3 and Cy5), which were excited at two different wavelengths (532, 633 nm) and emission light was detected at three separate color wavelengths (585, 675, 715 nm). The light from two lasers was combined and focused towards the sample. Emission spectra were separated using dichroic mirrors to split the light signals into wavelengths of each dye and detected by individual PMTs. They also incorporated electrical impedance data (as described below) to isolate signals from single beads and obtain an accurate measurement of bead size. This optical set up allowed for multiplexing classification performance that was comparable to a commercial bench-top flow cytometer. Since the target analytes were already fluorescently labeled (i.e. analytes were the detection antibodies) sensitivity was given in terms of amount of bound fluorophores detectable, with an LOD of ~2.6 × 10⁴ fluorescent molecules per microbead. While multi-wavelength flow cytometers require a more complicated optical setup, they also enable multiparameter analysis of complex phenomena, such as the determining the cell cycle position and detecting apoptosis as determined by DNA content, mitochondrial membrane potential, and caspase activation151.
Fluorescence lifetime-based flow cytometry is another powerful detection methodology used since 1990 that uses modulation of excited laser signals. Fluorescence lifetime is an interval that a fluorophore spends in the excited state before returning to the ground state by emitting a photon. In this method, the degree of demodulation and phase shift between the thousands of correlated fluorescence and scattered signals obtained while cells are rapidly passing the laser beam is used to estimate the average value of fluorescence lifetime for each cell and can be measured at any color channel. Although today’s multichannel fluorescence-based detection systems use up to 18 emission channels, such polychromatic fluorescence analysis does not support the measurement of time dependent photophysical properties of fluorophores such as fluorescence lifetime decay. The measurement of fluorescence lifetime of fluorophores is suitable to determine binding saturation on cell surfaces, protein localization, microsphere-based multiplexing, and distinguishing apoptotic and non-apoptotic cells as well as DNA content in the presence of RNA. Unlike steady laser excitation and time domain analysis in LIF, fluorescence lifetime-based detection systems use laser excitation modulated at radio frequency (RF), detect fluorescence emission and scattering signals and use frequency domain analysis to extract the average fluorescence lifetime. Recently Houston et al. published a review providing in depth discussion on the operation of fluorescence life time-based detection and its application in flow cytometry particle analysis/sorting152.
Today, fluorescence lifetime-dependent flow cytometry has advanced to perform simultaneous, multiple RF excitation using a high-throughput multi-frequency flow cytometry (MFFC) analysis leveraged by digital laser modulation and digital signal processing153. Despite its ability to reveal multiple cellular features fluorescence lifetime is not a standard flow cytometry parameter as it requires substantial and complex hardware changes to implement. The detection systems need specialty analog devices, high frequency filters, mixers, and data acquisition boards to capture the average fluorescence lifetime from a single-color bandwidth152,153. The resource intensive implementation and a lack of common assays that leverage de-excitation times in cells have dampened the widespread use of fluorescence lifetime-based detection in flow cytometry. This clearly indicates that systems with simple and low-cost implementation are preferred for microfluidic flow cytometry even if their functions are not superior.
Other optical detection techniques have also been applied to flow cytometry. Nedbal et al. used a custom-built microscope with several excitation/emission filters and mirrors connected to a time-correlated single photon counting module to measure Förster energy resonance transfer (FRET), a technique that is based off of the distance between two fluorophores154. With this setup, the researchers could measure molecular and signaling related phenomena in cells, such as EGFR phosphorylation.
In addition, particle enrichment and sorting can be accomplished within microflow systems using fluorescence based detection techniques. Microfluidic fluorescent activated cell sorting (μFACS) was demonstrated by Cho et al. by coupling fluorescence based cytometric detection with particle sorting. This μFACS system used Teflon waveguides embedded along the microchannel for optical detection, a PZT actuator, and a novel control system for automated real-time sorting155. The device avoids the common pitfalls of clogging and hydrodynamic shear stress-induced mortality on cells observed during FACS, and achieved a throughput of 2,174 cells/s. The researchers theorize that adding additional features like side scatter measurement and 3D focusing could significantly improve the device’s throughput. It is apparent that ever more sophisticated off-chip optical equipment will continue to open up new applications for microfluidic flow cytometry.
5.2. Image processing detection
Not all optical detection methods in microfluidic flow cytometry are centered on quantification of laser induced fluorescence. Imaging based devices have shown much promise, and their required equipment is often easier to set up and operate than those used in fluorescence based devices. The basic components (Figure 10a) typically consist of a microscope platform with a coupled CMOS or CCD camera, light source (brightfield, darkfield or epifluorescence), lens(es), and software such as MATLAB that is capable of running image processing algorithms and analysis. These types of devices are especially useful for cellular analysis. For example, Vercruysse et al. have developed a simple but highly effective flow cytometer for counting and classifying leukocytes, shown in Figure 10b156. While the device used a laser as a light source, it did not measure fluorescence and consequently required no cell labeling prior to analysis, though removal of erythrocytes and platelets from the blood samples was still necessary. The software algorithm developed by the researchers used two parameters for quantification, size and granularity, to effectively classify the cells, and allowed the operator access to the cell images so that outliers could be identified to improve the algorithm. Its performance was comparable to a conventional hematology analyzer, with discrepancies that were attributed to differing sample preparation, detection strategies and the software itself.
Figure 10. Imaging-based flow cytometry detection.
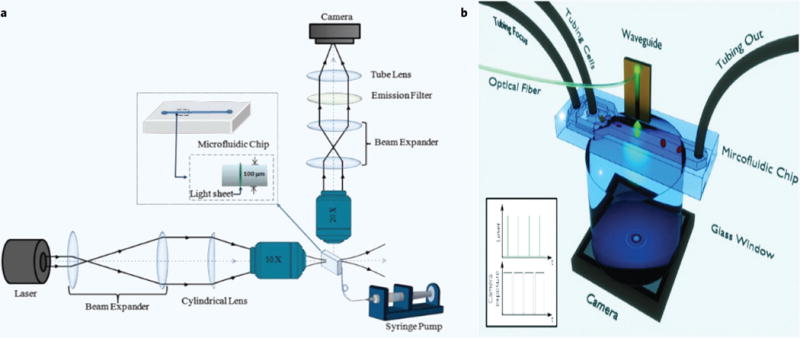
(a) Schematic diagram of light sheet based optical system used for image based detection in microfluidic flow cytometers150. (b) Microfluidic flow cytometer for leukocyte classification. The inset graph shows the synchronization of the laser pulses and camera exposure times156.
In general, sets of lenses are used in image acquisition to focus the image on the image sensor but Huang et al. has demonstrated a microfluidic flow cytometer based on lens-less imaging that was used to recognize and count HepG2/red blood cells with less than 8% error compared to a commercial flow cytometer157. This approach used an image sensor situated at the bottom of the microchannel through which cells flow in single file. The cell recognition and counting were performed using an extreme learning-machine based single-frame processing which has intensive image processing and recognition, often used in machine learning. Such contact imaging often used in microfluidics for on chip imaging158,159 certainly reduces the size of the flow cytometry device and removes the need for focusing but increases the cost of the device and requires intensive image processing. The image processing algorithm itself is a critical component of imaging flow cytometers. As Gopakumar et al. demonstrated, such an algorithm typically has preprocessing, cell localization, cell segmentation, and classification steps160. With their Matlab-based, multi-parameter classification algorithm, they were able to classify three distinct human leukemia cell lines on a microfluidic device with up to a 98.06% accuracy.
Other devices have used imaging in conjunction with other strategies often for additional information and/or device validation; Chen et al.’s impedance-based cytometer also used a CMOS camera that allowed for another cell classification parameter, elongation length, to be measured as cells passed through a constriction channel93. Regmi et al. used a “light sheet” to excite fluorescently labeled cells that were subsequently imaged with a CMOS camera as they passed through the detection region150. The light sheet covered the entire cross section of the flow channel, eliminating the need to focus the cells into a narrow stream and achieving a throughput of 2,090 cells/min. A non-cellular example of image-based microfluidic flow cytometry was developed by Kim et al. to perform multiplexed immunoassays. This device used imaging based detection in conjunction with superparamagnetic nanoparticles and magnetism to quantify the number of molecular analytes bound to microbeads106. A CCD camera was used to measure flow deviations and velocities of magnetically labelled beads; this device is discussed in more detail in the following “Magnetism based detection” subsection.
5.3. Electrical detection
Electrical detection in flow cytometry has been used in Coulter counters to detect, enumerate, and size particles such as cells or beads since the 1940s161. Microfluidic flow cytometry initially explored the use of electrical detection as an alternative to bulky optical systems and eventually to enhance the overall performance of the microfluidic flow cytometer. Electrical detection is a promising technique for use in microflow cytometry as it is easy to integrate into microfluidic systems, enables labeled or label-free detection of several analytes, and significantly simplifies the preparation of sample/analyte for detection. Such aspects of electrical sensing have led to the development of simple and portable microfluidic flow cytometry systems.
5.3.1. Electrical impedance based detection
In this approach, the current flowing between two electrodes is measured and depends on the impedance offered by the material or particles flowing between them. The impedance of a material to the flow of current depends on physical properties such as size, volume as well as electrical characteristics such as the dielectric properties of the material between the electrodes. Fluorescence and some imaging-based microfluidic flow cytometers require labelling the sample with a fluorescent dye or other molecules. Devices that utilize electrical impedance as their detection principle are growing in popularity since they free the user from this time-consuming sample preparation step. The Coulter principle was later adapted to microfluidic flow cytometers, in what is known as micro-electrical impedance spectroscopy (μ-EIS)93. While Coulter counters typically detect cell-induced changes in direct current (DC), devices that utilize μ-EIS use high frequency (100 kHz–50 MHz) alternating current (AC). μ-EIS requires an electrode pair for the particles to flow between and an impedance analyzer/spectroscope, which measures the change in impedance.
A popular application for μ-EIS is classifying cell types in a sample; this can be due to differences in cell sizes and dielectric properties producing different particle impedances. Although labelling the cells is not required, the differences in the dielectric properties of the cells being analyzed must be quantified beforehand, so that a classification algorithm can be calibrated. Karen Cheung et al. were early pioneers of this technology and developed a device to measure an impedance of individual cells by applying two frequencies simultaneously. Fixed low frequency of 602 kHz was used as reference signal while second high frequency in the range of 350 kHz to 20 MHz was used to differentiate between differently sized microbeads and intact, fixed, or lysed red blood cells91. The researchers measured impedance amplitude, opacity (ratio of high frequency magnitude of impedance to the reference frequency magnitude to impedance), and relative phase for discrimination between different cell populations without the use of cell markers. Another example of impedance detection is the device made by Chen et al., shown in Figure 11, which measured each cell’s impedance amplitude ratio and transit time (as well as cell elongation length via a camera) as they passed through a constriction channel between the electrodes93. These parameters were imported into a Matlab-based classification algorithm to identify the different cell populations. They were able to distinguish between osteoblasts and osteocytes with a 93.7% success rate, while similarly sized wild type and drug resistant breast cancer cells were differentiated with a 70.2% success rate. While Chen used low frequency AC (100 kHz) for their measurements, Haandbaek et al. explored the high frequency range of 50–250 MHz80. Their purpose was to distinguish two different strains of yeast cells, a wild-type and mutant. This was possible due to differences in their subcellular structure-vacuole size and distribution-which could only be revealed by high frequency impedance measurements. While this device could be used to distinguish between very similar cell types, it used a custom-built, complex spectroscope which limits its widespread adoption at this time. Impedance flow cytometry is not limited to only cellular applications. Two microfluidic flow cytometers, created by Spencer et al. (Figure 2) and Holmes et al. (Figure 12), used impedance in conjunction with optical fluorescence detection to analyze microbead samples10,82,96. In both these devices, impedance measurements were used to determine particle size and detect bead aggregates, providing a more accurate alternative to forward scatter light measurements. They used standard LIF methods to detect bound molecular species captured on the surface of the beads (human or rabbit IgG) or differentiate between labeled leukocyte populations (monocytes, neutrophils, CD4+/− T lymphocytes). These devices show that while μ-EIS cannot be used alone for molecular applications like analyzing immunoassays, it can still serve an ancillary role as a doublet discriminator in microbead-based flow cytometers.
Figure 11. Impedance-based flow cytometry detection.
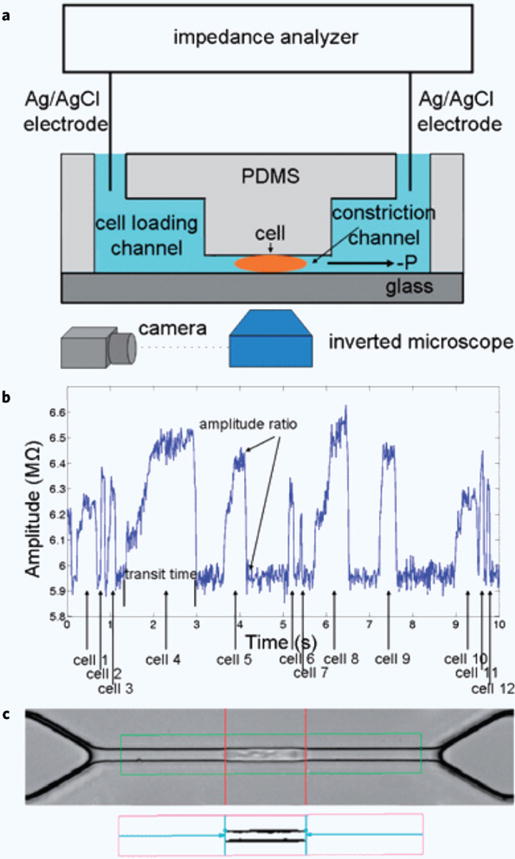
(a) The layout of the device. (b) Impedance amplitude data. Peaks correspond to a cell passing through the constriction channel, and peak widths represent cell transit times. (c) Inverted microscope image of a cell passing through the constriction channel, used to calculate the cell’s elongation length93.
Figure 12. Schematic diagram of the micro impedance cytometer system utilizing the confocal-optical detection and dual frequency impedance measurement11.
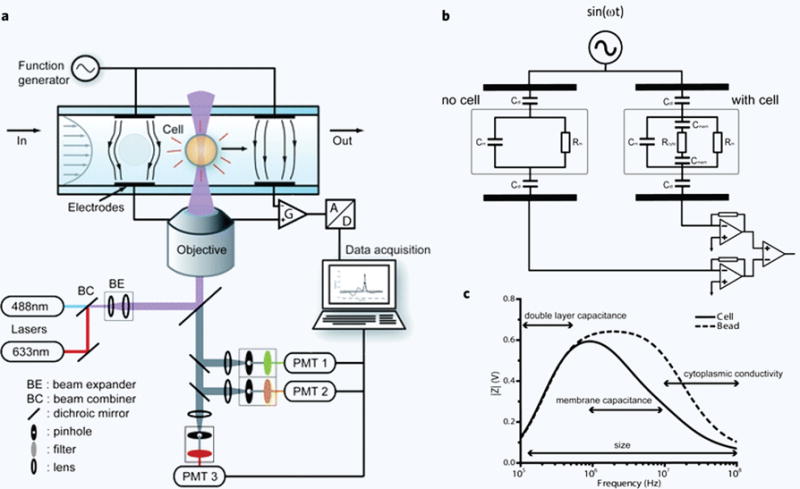
(a) Simultaneous measurement of fluorescence properties using optical detection and impedance using electrodes to compare the electrical and optical properties on a cell-by-cell basis. (b) A simplified schematic of the impedance detection system with differential measurement. (c) Typical frequency-dependent impedance magnitude signal for a polymer bead and a cell of similar size.
5.3.2. Magnetism based detection
Magnetism already plays a prominent and growing role in biological analysis. Many commercially available flow cytometers use magnetic microbeads to ease capturing, washing and magnetic-activated cell sorting (MACS) which has revolutionized cell separation. However, magnetism as a detection mechanism in and of itself is still utilized much less frequently than fluorescence, especially in the realm of microfluidic flow cytometry. This is due to the bulky equipment required to perform magnetic sensing.
Magnetic flow cytometry has similarities to both fluorescence and impedance techniques. As in fluorescent flow cytometry, a sample labelling step is needed. In this case, the sample is usually tagged with superparamagnetic iron oxide nanoparticles (SPIONs). SPIONs can be internalized by cells or conjugated to antibodies to label the exterior of cells and functionalized microbeads. The microfluidic device created by Helou et al., shown in Figure 13, might best exemplify the future direction of this technique12. A uniform magnetic field is generated by an upstream NdFeB magnet, which is also used to focus the particles. When a SPION labeled cell travels over the GMR sensor, it perturbs the local magnetic field, causing a change in the resistance of the sensor which is detected by the Wheatstone bridge circuit in a manner that resembles μ-EIS. Besides cell counting, the device can also estimate cell size by taking time-of-flight measurements. The researchers found that arranging the Wheatstone bridges in a diagonal format allowed for higher flow rates and throughput, but a parallel configuration was more sensitive. The throughput of the device as it stands is low (10 cells/s), and it appears to be limited to cellular applications. However, its lack of complex optical equipment and cheap GMR component might make it attractive to some.
Figure 13. GMR-based flow cytometry12.
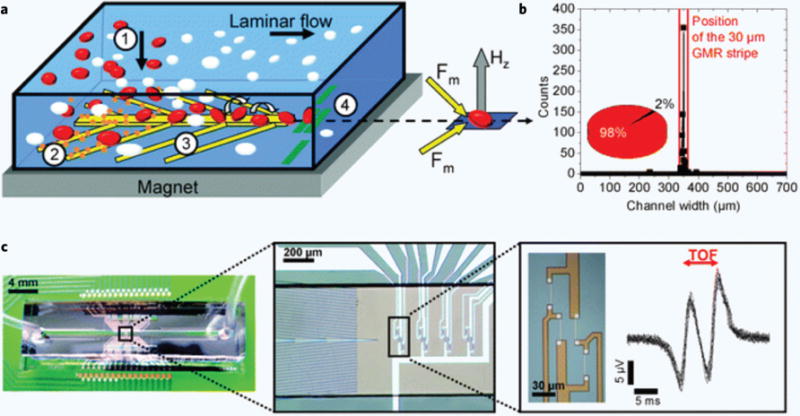
(a) The process involves introducing the SPION-labeled cells (1), which then pass over magnetic Ni chevrons that serve the dual purpose of filtering out unbound SPIONs (2) and focusing the cells (3). The focused cells then pass over the Wheatstone bridges and are detected (4). (b) Data for the magnetic focusing efficiency calculations, determined via microscopy observation of the cells flowing over a GMR band. (c) Photo of the device, with the insets showing an arrangement of the Wheatstone bridges in the GMR and typical time of flight (TOF) data patterns.
While GMR sensors are the most likely way magnetic detection will be incorporated into microfluidic flow cytometers, one group has devised a totally distinct method to employ magnetism based detection. Kim et al. used a combination of fluorescence, imaging, and magnetism to quantify the amount of target molecules bound to microbeads106. A microbead-based immunoassay using SPION-conjugated antibodies as the detection molecule was first performed. These beads were introduced and hydrodynamically focused in a microfluidic device. At the detection region, the internal fluorescent dye in the beads was excited with a mercury lamp, and a permanent magnet placed to one side of the channel caused magnetically labeled beads to deviate from their flow path (y-direction) perpendicularly toward the magnet (x-direction). It was noted that the velocity of the beads in the x-direction was directly proportional to the amount of magnetically tagged antibodies on their surface- and consequently, the concentration of the target molecule. A CCD camera was used to image the moving beads and determine their velocity in the x direction. A calibration curve was created relating velocity in the x direction to analyte concentration. The most notable aspect of this device was its exceptional sensitivity and dynamic range; with the ability to detect rabbit IgG from a LOD of 244 pg/mL to 1 μg/mL, it outperformed most conventional fluorescence-based assays. However, the device’s throughput is very low (120 nL/min total flow rate), and the lack of commercially available SPION-conjugated antibodies makes its widespread adoption unlikely.
In summary, LIF remains the most commonly used detection method in microfluidic flow cytometry; while it is capable of high sensitivity and multiplexing, it requires sample preparation steps (labeling with fluorescent markers) and a sometimes complicated optical equipment setup. Electrical impedance methods require no labeling steps but are mostly limited to counting and classifying cells. Finally, magnetic detection is a novel strategy that has a potential for high sensitivity, but the bulky equipment and use of the uncommon SPION-labeling method limits its widespread adoption currently.
6. MICROFLUIDIC FLOW CYTOMETRY APPLICATIONS
Flow cytometer is a versatile bioanalytical platform which has numerous applications in cell biology, biotechnology and medical diagnosis. Some of the main flow cytometry assays and their associated applications are highlighted in Table 4. Microfluidic research has significantly contributed in developing microfluidic flow cytometers that are suitable for specific as well as a wide range of applications listed in this table. It should be noted that many of these applications often overlap; for example, a flow cytometer may perform a blood count and then sort the various blood cells using FACS.
Table 4.
Applications of flow cytometry.
| Flow cytometry assay or measurements | Applications | Microfluidic platform citations |
|---|---|---|
| Florescent assisted cell sorting (FACS) | Separate each cell type from a heterogeneous cell mixture | 136, 155, 171–174 |
| Complete blood count (CBC) | Detect and count RBC and WBC differentials of blood | 10, 12, 96, 156, 175–178 |
| Circulating tumor cell (CTC) detection | Detect cancer cells and progression of cancer | 12, 179, 180 |
| Analysis of DNA or RNA content (e.g. Flow-FISH or BACs-on-Beads technology) | Study cell cycle, kinetics, proliferation, ploidy, aneuploidy, endoreduplication, etc. | 151, 181–183 |
| Forward scattering colorimetry (FSC) and side scattering colorimetry (SSC) | Measure volume and morphological complexity of cells or other particles | 100, 102, 184, 185 |
| Detection of antigen | Detect cell surface (CD marker), pathogenic, secreted, and intracellular antigens | 23, 50, 82, 106, 186–190 |
| Cell viability and apoptosis assays | To measure cell death and distinguish it between apoptosis, necrosis, drug-related, etc. | 191–197 |
| Electro-characterization | Measurement of electrical properties for classifying cells based on morphology, strain, etc. | 80, 93, 139, 144 |
| Protein expression, modification and localization | In proteomic studies to help understand human biology, potential targets for drugs or protein production | 154, 191, 193, 198, 199 |
| Characterizing multidrug resistance (MDR) in cancer cells | Elucidate molecular mechanisms leading to multidrug resistance to design new drugs or alter therapeutics | 200, 201 |
| Cell signaling assay | Measure specific cell signaling pathways to understand disease and treatment | 154, 183, 202 |
7. COMMERCIALIZATION
Flow cytometry makes up an industry worth over $3 billion with over 100 companies involved in the sale and manufacturing of instruments and reagents and has a high forecasted growth rate (CAGR of 10–12%) in the near future162. A substantial portion of this projected growth is predicated on the increasing demand for point-of-care diagnostic instruments for clinical settings, indicating that microfluidic technology has a significant role to play in the future of this industry. Currently, research on microfluidic flow cytometers is not limited to the numerous scientific and academic publications but has also championed the commercialization of microflow cytometers. Here, we limit our discussion to highlight the lab research successfully translated into a commercial device as detailed coverage on the commercialization aspect of microfluidic flow cytometry is beyond the scope of this review and has been discussed earlier in detail elsewhere110,163,164. Some of the notable commercial flow cytometry devices and microfluidic flow cytometry research prototypes are listed in Table 5 along with their application, advantages and disadvantages. The advent of microfluidic fabrication, particle manipulation, flow focusing and detection technologies play central roles in further expanding the potential of research prototypes to realize commercially viable bioanalytical tools165.
Table 5.
Examples of commercially available flow cytometers and research prototypes of microfluidic flow cytometers.
| Flow cytometers | Applications | Comments |
|---|---|---|
| CellLab Chip and Agilent 2100 Bioanalyzer, Agilent Technologies | Fluorescent based analysis of cells and particles | Hydrodynamic focusing; Laser interrogation; Disposable chip; Low throughput; Needs application specific kits and 20,000 cells |
| FISHMAN-R, On-chip Biotechnologies Co., Ltd. | Detection and analysis of s specific bacteria and cells (Flow-FISH method) | Detects particles from 0.5 to 20 μm sizes; Analyzes small quantities of samples; Uses forward scatter detection. |
| FACSAria, Becton Dickinson | Cell isolation and sorting | Rapid separation; Small to moderate number of samples; High throughput; Expensive and bulky equipment. |
| NovoCyte, ACEA Biosciences, INC. | Volumetric-based cell counting | 3 lasers with 13 color detection; High throughput; Automatic sample loading, cleaning and decontamination. |
| On Chip Sort, On-Chip Biotechnologies Co., Ltd | CTC detection, droplet generation, FACS analysis of cells and bacteria | Damage and contamination free sorting; High rare cells recovery; Low sample requirement; Microfluidic chip; Optical detection and portable. |
| GigaSort™, Cytonome, LLC. | Cell Sorting and cell purification | Disposable microfluidic chip; Single wavelength optical detection; High throughput; non-portable and expensive. |
| Chipcytometry, sponsored by Go-Bio and developed at Hannover Medical School | Analysis of biomarkers on cells and tissues and perform functional tests by cyclic staining | Cells immobilized within microfluidic chips; Uses imaging cytometry; 12000 cells per chip; Preserve cells or tissues for reuse; Intensive image processing. |
| ZE5™ Cell Analyzer, Bio-Rad Laboratories, Inc. | Protein expression, localization, and biomarker detection. | Five lasers and 28 fluorescence detectors; Dual forward-scatter design; Expensive, bulky and non-portable tool. |
| HemoScreen™, PixCell Medical Technologies | Complete blood count and WBC differentials | Portable and low cost; Disposable cartridge; Low sample volume. |
| SH800s Cell Sorter, Sony Biotechnology | FACS for cells and bacteria, viability and immunotyping | Large, expensive, high throughput, 4 lasers, 6 excitation and 2 scatter detectors, 3 different sized microfluidic chips. |
| Moxi Flow, Orflo | Cell counting, viability/apoptosis analysis, bead-based assays | Small and portable, low cost, single laser, impedance for size determination, single use cassettes. |
Commercially available flow cytometers that employ microfluidics have appeared on the market from both established and nascent biotechnology companies. While these instruments may be centered around a microfluidic chip, it should be noted that their size can often still be substantial due to incorporation of complex detection and pumping components, though some relatively compact and even portable instruments exist. Likewise, the costs of these instruments vary widely: some still reflect conventional high-end prices ($100,000–$500,000) like the SH800s Cell Sorter from Sony Biotechnology, but some of the smaller instruments can be much more affordable, such as the Moxi Flow from Orflo which retails for under $10,000. Commercial development in this field is very much on-going, as there are still plenty of opportunities to market smaller and cheaper flow cytometers.
8. DISCUSSION
Currently there is a range of flow cytometers with varied functional and operational specifications. Some can perform high resolution cytometric particle analysis which extends the limit of detection and sensitivity, while others are known for their high throughput analysis but provide limited functional specifications. In addition, it is quite clear that every application has its unique requirements with respect to functional specifications of the flow cytometer. This clearly indicates that flow cytometers should be designed as per the requirements of the applications.
In applications such as the detection of circulating tumor cells that are low in number, or single cell profiling which requires multi-parameter analysis for cell biological studies, high throughput flow cytometers cannot provide reliable quantification. An example of a device that emphasizes sensitivity and resolution is the LIF-based microfluidic flow cytometer developed by Nawaz et al. Using a combination of hydrodynamic and inertial focusing, the device is able to precisely manipulate particles and achieved coefficient of variances of 2.37% and 13.35% for microbeads and cells, among the lowest of any microfluidic device and comparable to a conventional commercial flow cytometer166. However, this device required a substantial amount of external equipment, including four microsyringe pumps, a sheath fluid reservoir, and an inverted fluorescent microscope, which reduces its portability and affordability.
On the other hand, for applications such as fluorescently labelled cell sorting or cell purifications that do not require high resolution particle analysis, high speed operation and high throughput is highly desirable. For example, McKenna et al. have developed a parallelized LIF micro-fluidic flow cytometer for the quantification of dyed and GFP-expressing cells167. This device uses 1D multicolor fluorescent image detection as opposed to high content screening methods such as high resolution 2D imaging to reduce data load and increase throughput. With its multiple microchannels (from 32 to up to 384), amenability to automation (robots were used to load and wash the device), and simplified detection scheme, the device has the potential for cell sorting and is expected to have an increase in throughput of several orders of magnitude compared to microscope-based imaging flow cytometers.
In some applications such as health care monitoring in remote places, flow cytometry devices that provide moderate sensitivity and selectivity with simple operation and use of fewer resources are highly desirable as opposed to high throughput or high resolution particle analysis. One case to illustrate this point is the impedance-based microfluidic flow cytometer developed by Emaminejad et al. The researchers wanted to create a low cost device that could be used in point-of-care settings in developing nations168. To accomplish this, they made a contactless impedance flow cytometer consisting of inexpensive reusable (PCB circuit board for electrodes) and disposable (PDMS bio-chip) components that eliminated the need for the extensive cleaning processes associated with conventional impedance-based devices. However, the contactless and pump-free nature of the device placed limitations on its sensitivity/signal-to-noise ratio and throughput, though neither of these properties was of central importance to the researchers.
In addition, the interdependence of functional and operational parameters on each other makes it difficult to achieve the best performance values for all the parameters. Therefore, application specific flow cytometers are an obvious choice in order to improve the current state of this tool. Microfluidic research is playing a significant role and has great potential to assist in development of application specific flow cytometers. Although simultaneous improvement in all the functional and operational parameters is unlikely, microfluidics will be able to provide improvement in these parameters on an individual basis. The ability of microfluidics to parallelize processes enables the expansion of sample processing and investigations to increase the speed of operation and throughput. Sub-micron dimensions and the ability to support integration of heterogeneous components allows these devices to have a small footprint, which is promising for reducing size and increasing portability in these systems. Microfluidic flow cytometers not only support conventional optical detection but also provide alternative but powerful detection techniques, such as impedance spectroscopy and electrochemical detection, providing the enhanced sensitivity and selectivity necessary in high resolution cytometric particle analysis. The efficient sample handling in microfluidics platforms, which includes particle manipulation techniques, the ability to use small volumes of reagents and samples as well as automation in sample preparation, is an important attribute to simplify operation and reduce resource consumption while performing assays. A review of several researchers’ work on flow cytometry highlights the same fact that it is quite difficult achieve the optimal value for every functional and operational specification. However, microfluidics is capable of handling the tradeoff-driven design constraint of modern microfluidic flow cytometers.
9. SUMMARY
Since many researchers would state that the purpose of microfluidic flow cytometry is developing effective point-of-care diagnostic devices, the ideal device should reflect this goal. Such a device should be inexpensive and not require bulky equipment that would hinder its portability. Other important considerations include the manufacturing processes utilized and ease of use. A device that is simple to make can be more effectively mass produced, and one that is easy to use-with minimal sample preparation and other user intervention steps, will cut down on process time and allow for widespread adoption of the device outside the realm of experienced technicians. However, all of these considerations must be balanced against the often competing needs of device sensitivity, specificity, and overall performance, which is the inherent challenge in designing a microfluidic flow cytometer. Table 6 summarizes these design criteria and provides suggestions for improving them.
Table 6.
Design consideration of microfluidic flow cytometry.
| Parameter | Criteria | Suggestions | Example |
|---|---|---|---|
| Cost | The entire device setup-including chip and external equipment should not be overly expensive. | Mass fabrication using inexpensive, readily available and biocompatible materials. | Polymers such as PDMS, polystyrene, and hydrogels are inexpensive and biocompatible materials. |
| Size | The entire device setup should be portable with a small and easy to handle footprint. | The operation of the device should not rely on large and bulky external equipment. | Impedance-based detectors are small and portable compared to bulky optical detectors. |
| Manufacturing | Mass fabrication of the device without need for resource intensive manufacturing setups. | The minimal use of expensive and highly technical microfabrication processes. | Soft lithography and injection molding are highly efficient and suitable for mass manufacturing. |
| Operation | Simple and rapid operation of the device without the need for skilled user intervention. | No or minimal automated on-chip sample preparation. | Impedance detection can avoid sample labeling and microvalves and micropumps can be used for automated sample preparation. |
| Performance | The device should have a low operating cost with the appropriate degree of sensitivity and selectivity. | Use small volumes of reagents and detectors suitable for the discrete analysis of individual particles. | Unlike hydrodynamic, inertial focusing requires no sheath fluid and advanced impedance detectors or optical sensing using optical fibers and air lenses enhance the detection performance. |
Besides taking into account all of these criteria, it is difficult to describe the “ideal” microfluidic flow cytometer due to the differing purposes and specifications required by different users. However, several of the devices discussed here can be noted for their exemplary advances to the field. Vercruysse et al.’s imaging flow cytometer (Figure 10b) displayed optimal features such as no requirements for cell labeling, a relatively simple and inexpensive optical setup, and a tunable algorithm for cell classification that compares favorably with a conventional hematology analyzer156. An example of a device that could be applied for molecular applications like immunoassays would Chung et al.’s LIF based flow cytometer (Figure 7), which used stepped inertial particle focusing with exceptional efficiency, eliminated the need for large sheath fluid reservoirs, and was simple to make using PDMS soft lithography148. All the same, each of these devices leaves room for improvement; this, in conjunction with the technology’s strong commercialization potential, ensures that the field of microfluidic flow cytometry has a bright future ripe for advancement and innovation.
Acknowledgments
This work was partially funded by NIH grants P41EB002503, R01EB020036, and T32GM008339; and NSF IDBR grant DBI1353918. Authors want to thanks Stephen C. Van Nostrand (Department of Molecular Biology and Biochemistry, Rutgers University) for his assistance in literature survey during the preparation of this manuscript.
Footnotes
CONFLICTS OF INTEREST
There are no conflicts of interest to declare.
References
- 1.Adan A, Alizada G, Kiraz Y, Baran Y, Nalbant A. Flow cytometry: Basic principles and applications. Crit Rev Biotechnol. 2017;37:163–176. doi: 10.3109/07388551.2015.1128876. [DOI] [PubMed] [Google Scholar]
- 2.Turaç G, et al. Combined flow cytometric analysis of surface and intracellular antigens reveals surface molecule markers of human neuropoiesis. PLoS ONE. 2013;8:e68519. doi: 10.1371/journal.pone.0068519. [DOI] [PMC free article] [PubMed] [Google Scholar]
- 3.Henel G, Schmitz JL. Basic theory and clinical applications of flow cytometry. Lab Med. 2007;38:428–436. doi: 10.1309/ghlewlv0cd8025jl. [DOI] [Google Scholar]
- 4.Doxie DB, Irish JM. High-dimensional single-cell cancer biology. Curr Top Microbiol Immunol. 2014;377:1–21. doi: 10.1007/82_2014_367. [DOI] [PMC free article] [PubMed] [Google Scholar]
- 5.Krishhan VV, Khan IH, Luciw PA. Multiplexed microbead immunoassays by flow cytometry for molecular profiling: Basic concepts and proteomics applications. Crit Rev Biotechnol. 2009;29:29–43. doi: 10.1080/07388550802688847. [DOI] [PubMed] [Google Scholar]
- 6.Sackmann EK, Fulton AL, Beebe DJ. The present and future role of microfluidics in biomedical research. Nature. 2014;507:181–189. doi: 10.1038/nature13118. [DOI] [PubMed] [Google Scholar]
- 7.Cho SH, et al. Review article: Recent advancements in optofluidic flow cytometer. Biomicrofluidics. 2010;4:043001. doi: 10.1063/1.3511706. [DOI] [PMC free article] [PubMed] [Google Scholar]
- 8.Chin CD, Linder V, Sia SK. Lab-on-a-chip devices for global health: Past studies and future opportunities. Lab Chip. 2007;7:41–57. doi: 10.1039/B611455E. [DOI] [PubMed] [Google Scholar]
- 9.Foudeh AM, Fatanat Didar T, Veres T, Tabrizian M. Microfluidic designs and techniques using lab-on-a-chip devices for pathogen detection for point-of-care diagnostics. Lab Chip. 2012;12:3249–3266. doi: 10.1039/C2LC40630F. [DOI] [PubMed] [Google Scholar]
- 10.Spencer D, Elliott G, Morgan H. A sheath-less combined optical and impedance micro-cytometer. Lab Chip. 2014;14:3064–3073. doi: 10.1039/C4LC00224E. [DOI] [PubMed] [Google Scholar]
- 11.Holmes D, et al. Leukocyte analysis and differentiation using high speed microfluidic single cell impedance cytometry. Lab Chip. 2009;9:2881–2889. doi: 10.1039/B910053A. [DOI] [PubMed] [Google Scholar]
- 12.Helou M, et al. Time-of-flight magnetic flow cytometry in whole blood with integrated sample preparation. Lab Chip. 2013;13:1035–1038. doi: 10.1039/C3LC41310A. [DOI] [PubMed] [Google Scholar]
- 13.Nishi Y, Doering R. Handbook of Semiconductor Manufacturing Technology. 2nd. CRC Press; 2007. p. 1720. [Google Scholar]
- 14.Xia Y, Whitesides GM. Soft lithography. Angew Chem Int Ed. 1998;37:550–575. doi: 10.1002/(SICI)1521-3773(19980316)37:5<550::AID-ANIE550>3.0.CO;2-G. [DOI] [PubMed] [Google Scholar]
- 15.Qin D, Xia Y, Whitesides GM. Soft lithography for micro- and nanoscale patterning. Nat Protoc. 2010;5:491–502. doi: 10.1038/nprot.2009.234. [DOI] [PubMed] [Google Scholar]
- 16.Shrirao AB, Hussain A, Cho CH, Perez-Castillejos R. Adhesive-tape soft lithography for patterning mammalian cells: Application to wound-healing assays. BioTechniques. 2012;53:315–318. doi: 10.2144/000113928. [DOI] [PubMed] [Google Scholar]
- 17.Shrirao A, Perez-Castillejos R. Simple fabrication of microfluidic devices by replicating Scotch-tape masters. Chips Tips. 2010 May 17; [Google Scholar]
- 18.Shrirao AB, Perez-Castillejos R. Microfluidics labs using devices fabricated by soft lithographic replication of scotch-tape molds. Am Soc Eng Educ. 2010 2010 Northeast Section Proceedings. [Google Scholar]
- 19.Duffy DC, McDonald JC, Schueller OJA, Whitesides GM. Rapid prototyping of microfluidic systems in poly(dimethylsiloxane) Anal Chem. 1998;70:4974–4984. doi: 10.1021/ac980656z. [DOI] [PubMed] [Google Scholar]
- 20.Rodrigue H, Bhandari B, Wang W, Ahn S-H. 3D soft lithography: A fabrication process for thermocurable polymers. J Mater Process Technol. 2015;217:302–309. http://dx.doi.org/10.1016/j.jmatprotec.2014.11.005. [Google Scholar]
- 21.Ju Y, et al. A microfluidics cytometer for mice anemia detection. Lab Chip. 2012;12:4355–4362. doi: 10.1039/C2LC40332C. [DOI] [PubMed] [Google Scholar]
- 22.Ushikubo FY, Birribilli FS, Oliveira DRB, Cunha RL. Y- and T-junction microfluidic devices: Effect of fluids and interface properties and operating conditions. Microfluid Nanofluid. 2014;17:711–720. doi: 10.1007/s10404-014-1348-4. [DOI] [Google Scholar]
- 23.Yang SY, Lien KY, Huang KJ, Lei HY, Lee G-B. Micro flow cytometry utilizing a magnetic bead-based immunoassay for rapid virus detection. Biosens Bioelectron. 2008;24:855–862. doi: 10.1016/j.bios.2008.07.019. http://dx.doi.org/10.1016/j.bios.2008.07.019. [DOI] [PubMed] [Google Scholar]
- 24.Yang R, Feeback DL, Wang W. Microfabrication and test of a three-dimensional polymer hydro-focusing unit for flow cytometry applications. Sens Actuat A Phys. 2005;118:259–267. https://doi.org/10.1016/j.sna.2004.09.001. [Google Scholar]
- 25.Hu YH, Chang M, Lin KH. A study of two fluids mixing in a helical-type micromixer. J Phys Conf Ser. 2006;48:531. [Google Scholar]
- 26.Wong SH, Ward MCL, Wharton CW. Micro T-mixer as a rapid mixing micromixer. Sens Actuat B Chem. 2004;100:359–379. http://dx.doi.org/10.1016/j.snb.2004.02.008. [Google Scholar]
- 27.Mengeaud V, Josserand J, Girault HH. Mixing processes in a zigzag microchannel: Finite element simulations and optical study. Anal Chem. 2002;74:4279–4286. doi: 10.1021/ac025642e. [DOI] [PubMed] [Google Scholar]
- 28.Vijayendran RA, Motsegood KM, Beebe DJ, Leckband DE. Evaluation of a three-dimensional micromixer in a surface-based biosensor. Langmuir ACS J Surf Colloids. 2003;19:1824–1828. doi: 10.1021/la0262250. [DOI] [Google Scholar]
- 29.Liu YZ, Kim BJ, Sung HJ. Two-fluid mixing in a microchannel. Int J Heat Fluid Flow. 2004;25:986–995. http://dx.doi.org/10.1016/j.ijheatfluidflow.2004.03.006. [Google Scholar]
- 30.Howell PB, Jr, et al. A microfluidic mixer with grooves placed on the top and bottom of the channel. Lab Chip. 2005;5:524–530. doi: 10.1039/b418243j. [DOI] [PubMed] [Google Scholar]
- 31.Jackson WC, et al. Mixing small volumes for continuous high-throughput flow cytometry: Performance of a mixing Y and peristaltic sample delivery. Cytometry. 2002;47:183–191. doi: 10.1002/cyto.10067. [DOI] [PubMed] [Google Scholar]
- 32.Ochs CJ, Abate AR. Rapid modulation of droplet composition with pincer microvalves. Lab Chip. 2015;15:52–56. doi: 10.1039/c4lc01040j. [DOI] [PMC free article] [PubMed] [Google Scholar]
- 33.Shrirao AB, et al. Microfluidic platforms for the study of neuronal injury in vitro. Biotechnol Bioeng. 2017 Dec 18; doi: 10.1002/bit.26519. (2017) [DOI] [PMC free article] [PubMed] [Google Scholar]
- 34.Studer V, et al. Scaling properties of a low-actuation pressure microfluidic valve. J Appl Phys. 2004:95, 393–398. doi: 10.1063/1.1629781. [DOI] [Google Scholar]
- 35.Grover WH, Skelley AM, Liu CN, Lagally ET, Mathies RA. Monolithic membrane valves and diaphragm pumps for practical large-scale integration into glass microfluidic devices. Sens Actuat B Chem. 2003;89:315–323. http://dx.doi.org/10.1016/S0925-4005(02)00468-9. [Google Scholar]
- 36.Au AK, Lai H, Utela BR, Folch A. Microvalves and micropumps for BioMEMS. Micromachines. 2011;2:179. [Google Scholar]
- 37.Sundararajan N, Kim D, Berlin AA. Microfluidic operations using deformable polymer membranes fabricated by single layer soft lithography. Lab Chip. 2005;5:350–354. doi: 10.1039/b500792p. [DOI] [PubMed] [Google Scholar]
- 38.Weibel DB, et al. Torque-actuated valves for microfluidics. Anal Chem. 2005;77:4726–4733. doi: 10.1021/ac048303p. [DOI] [PubMed] [Google Scholar]
- 39.Diercks AH, et al. A microfluidic device for multiplexed protein detection in nano-liter volumes. Anal Biochem. 2009;386:30–35. doi: 10.1016/j.ab.2008.12.012. [DOI] [PMC free article] [PubMed] [Google Scholar]
- 40.Kong J, et al. Integrated microfluidic immunoassay for the rapid determination of clenbuterol. Lab Chip. 2009;9:1541–1547. doi: 10.1039/b818430e. [DOI] [PubMed] [Google Scholar]
- 41.Yang SY, Lien KY, Huang KJ, Lei HY, Lee GB. Micro flow cytometry utilizing a magnetic bead-based immunoassay for rapid virus detection. Biosens Bioelectron. 2008;24:861–868. doi: 10.1016/j.bios.2008.07.019. [DOI] [PubMed] [Google Scholar]
- 42.Byun CK, Abi-Samra K, Cho YK, Takayama S. Pumps for microfluidic cell culture. Electrophoresis. 2014;35:245–257. doi: 10.1002/elps.201300205. [DOI] [PubMed] [Google Scholar]
- 43.Shrirao AB, et al. A versatile method of patterning proteins and cells. J Visual Exp JoVE. 2017 doi: 10.3791/55513. [DOI] [PMC free article] [PubMed] [Google Scholar]
- 44.Shrirao AB, Kung FH, Yip D, Cho CH, Townes-Anderson E. Vacuum-assisted fluid flow in microchannels to pattern substrates and cells. Biofabrication. 2014;6:035016. doi: 10.1088/1758-5082/6/3/035016. [DOI] [PMC free article] [PubMed] [Google Scholar]
- 45.Unger MA, Chou HP, Thorsen T, Scherer A, Quake SR. Monolithic microfabricated valves and pumps by multilayer soft lithography. Science (NY) 2000;288:113–116. doi: 10.1126/science.288.5463.113. [DOI] [PubMed] [Google Scholar]
- 46.Chih-Hao W, Gwo-Bin L. Pneumatically driven peristaltic micropumps utilizing serpentine-shape channels. J Micromech Microeng. 2006;16:341. [Google Scholar]
- 47.Camou S, Fujita H, Fujii T. PDMS 2D optical lens integrated with microfluidic channels: Principle and characterization. Lab Chip. 2003;3:40–45. doi: 10.1039/B211280A. [DOI] [PubMed] [Google Scholar]
- 48.Seo J, Lee LP. Disposable integrated microfluidics with self-aligned planar microlenses. Senso Actuat B Chem. 2004;99:615–622. http://dx.doi.org/10.1016/j.snb.2003.11.014. [Google Scholar]
- 49.Rodríguez-Ruiz I, Ackermann TN, Muñoz-Berbel X, Llobera A. Photonic lab-on-a-chip: Integration of optical spectroscopy in microfluidic systems. Anal Chem. 2016;88:6630–6637. doi: 10.1021/acs.analchem.6b00377. [DOI] [PubMed] [Google Scholar]
- 50.Golden JP, et al. Multi-wavelength microflow cytometer using groove-generated sheath flow. Lab Chip. 2009;9:1942–1950. doi: 10.1039/b822442k. [DOI] [PMC free article] [PubMed] [Google Scholar]
- 51.Mao X, et al. An integrated, multiparametric flow cytometry chip using “microfluidic drifting” based three-dimensional hydrodynamic focusing. Biomicrofluidics. 2012;6:024113–024113-024119. doi: 10.1063/1.3701566. [DOI] [PMC free article] [PubMed] [Google Scholar]
- 52.Mao X, Lin SCS, Dong C, Huang TJ. Single-layer planar on-chip flow cytometer using microfluidic drifting based three-dimensional (3D) hydrodynamic focusing. Lab Chip. 2009;9:1583–1589. doi: 10.1039/B820138B. [DOI] [PubMed] [Google Scholar]
- 53.Zhao Y, Li Q, Hu X-M. Microfluidic cytometers with integrated on-chip optical components for blood cell analysis. SPIE/COS Photonics Asia. 2016;10024:100240, J1–J8. doi: 10.1117/12.2245995. [DOI] [Google Scholar]
- 54.Tung YC, Zhang M, Lin CT, Kurabayashi K, Skerlos SJ. PDMS-based opto-fluidic micro flow cytometer with two-color, multi-angle fluorescence detection capability using PIN photodiodes. Sensors and Actuators B: Chemical. 2004;98:356–367. http://dx.doi.org/10.1016/j.snb.2003.10.010. [Google Scholar]
- 55.Fan YJ, et al. Three dimensional microfluidics with embedded microball lenses for parallel and high throughput multicolor fluorescence detection. Biomicrofluidics. 2013;7:044121. doi: 10.1063/1.4818944. [DOI] [PMC free article] [PubMed] [Google Scholar]
- 56.Xun W, Feng J, Chang H. A microflow cytometer based on a disposable microfluidic chip with side scatter and fluorescence detection capability. IEEE Trans NanoBiosci. 2015;14:850–856. doi: 10.1109/TNB.2015.2455073. [DOI] [PubMed] [Google Scholar]
- 57.Kummrow A, et al. Microfluidic structures for flow cytometric analysis of hydrodynamically focussed blood cells fabricated by ultraprecision micromachining. Lab Chip. 2009;9:972–981. doi: 10.1039/B808336C. [DOI] [PubMed] [Google Scholar]
- 58.Testa G, Persichetti G, Bernini R. Micro flow cytometer with self-aligned 3D hydrodynamic focusing. Biomed Optics Express. 2015;6:54–62. doi: 10.1364/BOE.6.000054. [DOI] [PMC free article] [PubMed] [Google Scholar]
- 59.Alrifaiy A, Lindahl OA, Ramser K. Polymer-based microfluidic devices for pharmacy, biology and tissue engineering. Polymers. 2012;4:1349. [Google Scholar]
- 60.Voldman J, Gray ML, Schmidt MA. Microfabrication in biology and medicine. Annu Rev Biomed Eng. 1999;1:401–425. doi: 10.1146/annurev.bioeng.1.1.401. [DOI] [PubMed] [Google Scholar]
- 61.Polla DL, et al. Microdevices in medicine. Annu Rev Biomed Eng. 2000;2:551–576. doi: 10.1146/annurev.bioeng.2.1.551. [DOI] [PubMed] [Google Scholar]
- 62.Miao J. Silicon micromachining. In: Li D, editor. Encyclopedia of Microfluidics and Nanofluidics. Springer; USA: 2008. pp. 1840–1846. [Google Scholar]
- 63.Smart WH, Subramanian K. The use of silicon microfabrication technology in painless blood glucose monitoring. Diabetes Technol Ther. 2000;2:549–559. doi: 10.1089/15209150050501961. [DOI] [PubMed] [Google Scholar]
- 64.Fuller G. Optical lithography. In: Nishi Y, Doering R, editors. Handbook of Semiconductor Manufacturing Technology. 2nd. CRC Press; 2007. pp. 1–50. Chap. 18. [Google Scholar]
- 65.Depla D, Mahieu S, Greene JE. Handbook of Deposition Technologies for Films and Coatings. 3rd. William Andrew Publishing: 2010. Sputter deposition processes; pp. 253–296. [Google Scholar]
- 66.Shah SI, Jaffari GH, Yassitepe E, Ali B. Handbook of Deposition Technologies for Films and Coatings. 3rd. William Andrew Publishing: 2010. Evaporation: Processes, bulk microstructures, and mechanical properties; pp. 135–252. Chap. 4. [Google Scholar]
- 67.Pandey RK. In: Handbook of Semiconductor Electrodeposition. Sahu SN, Chandra S, editors. M. Dekker; New York: 1996. p. 304. [Google Scholar]
- 68.Reid J. Handbook of Semiconductor Manufacturing Technology. 2nd. CRC Press; 2007. Damascene copper electroplating; pp. 1–48. Chap. 16. [Google Scholar]
- 69.Carlsson JO, Martin PM. Chemical vapor deposition. In: Martin PM, editor. Handbook of Deposition Technologies for Films and Coatings. 3rd. William Andrew Publishing; 2010. pp. 314–363. Chap. 7. [Google Scholar]
- 70.Xia LQ, Chang M. Chemical vapor deposition. In: Nishi Y, Doering R, editors. Handbook of Semiconductor Manufacturing Technology. 2nd. CRC Press; 2007. pp. 1–88. Chap. 13. [Google Scholar]
- 71.Martin KD. The chemistry of wet etching. In: Reinhardt KA, Reidy RF, editors. Handbook of Cleaning in Semiconductor Manufacturing. John Wiley & Sons, Inc; 2011. pp. 95–141. Chap. 3. [Google Scholar]
- 72.Misra A, Hogan JD, Chorush R. Wet and dry etching materials. In: Misra A, editor. Handbook of Chemicals and Gases for the Semiconductor Industry. John Wiley & Sons, Inc; 2002. pp. 1–50. Chap. 4. [Google Scholar]
- 73.Flamm DL, Donnelly VM, Ibbotson DE. Basic principles of plasma etching for silicon devices. In: Norman GE, Dale MB, editors. VLSI Electronics Microstructure Science. Vol. 8. Elsevier; 1984. pp. 189–251. [Google Scholar]
- 74.Timans PJ. Rapid thermal processing. In: Nishi Y, Doering R, editors. Handbook of Semiconductor Manufacturing Technology. 2nd. CRC Press; 2007. pp. 1–118. Chap. 11. [Google Scholar]
- 75.Rinn Cleavelin C, Colombo L, Niimi H, Pas S, Vogel E. Oxidation and gate dielectrics. In: Nishi Y, Doering R, editors. Handbook of Semiconductor Manufacturing Technology. 2nd. CRC Press; 2007. pp. 1–38. Chap. 9. [Google Scholar]
- 76.Banerjee S. Dopant diffusion. In: Nishi Y, Doering R, editors. Handbook of Semiconductor Manufacturing Technology. 2nd. CRC Press; 2007. pp. 1–20. Chap. 8. [Google Scholar]
- 77.Iliescu C, Taylor H, Avram M, Miao J, Franssila S. A practical guide for the fabrication of microfluidic devices using glass and silicon. Biomicrofluidics. 2012;6 doi: 10.1063/1.3689939. 16505-016505-16. [DOI] [PMC free article] [PubMed] [Google Scholar]
- 78.Bu M, Melvin T, Ensell GJ, Wilkinson JS, Evans AGR. A new masking technology for deep glass etching and its microfluidic application. Sens Actuat A Phys. 2004;115:476–482. http://dx.doi.org/10.1016/j.sna.2003.12.013. [Google Scholar]
- 79.Saito Y, et al. Micro-fabrication techniques applied to aluminosilicate glass surfaces: Micro-indentation and wet etching process. Thin Solid Films. 2009;517:2900–2904. http://dx.doi.org/10.1016/j.tsf.2008.11.077. [Google Scholar]
- 80.Haandbaek N, Burgel SC, Heer F, Hierlemann A. Characterization of subcel-lular morphology of single yeast cells using high frequency microfluidic impedance cytometer. Lab Chip. 2014;14:369–377. doi: 10.1039/C3LC50866H. [DOI] [PubMed] [Google Scholar]
- 81.Thomas JH, Kim SK, Hesketh PJ, Halsall HB, Heineman WR. Bead-based electrochemical immunoassay for bacteriophage MS2. Anal Chem. 2004;76:2700–2707. doi: 10.1021/ac035503c. [DOI] [PubMed] [Google Scholar]
- 82.Holmes D, She JK, Roach PL, Morgan H. Bead-based immunoassays using a micro-chip flow cytometer. Lab Chip. 2007;7:1048–1056. doi: 10.1039/B707507N. [DOI] [PubMed] [Google Scholar]
- 83.Yaralioglu GG, Wygant IO, Marentis TC, Khuri-Yakub BT. Ultrasonic mixing in microfluidic channels using integrated transducers. Anal Chem. 2004;76:3694–3698. doi: 10.1021/ac035220k. [DOI] [PubMed] [Google Scholar]
- 84.Liu RH, Lenigk R, Druyor-Sanchez RL, Yang J, Grodzinski P. Hybridization enhancement using cavitation microstreaming. Anal Chem. 2003;75:1911–1917. doi: 10.1021/ac026267t. [DOI] [PubMed] [Google Scholar]
- 85.Salmanzadeh A, Shafiee H, Davalos RV, Stremler MA. Microfluidic mixing using contactless dielectrophoresis. Electrophoresis. 2011;32:2569–2578. doi: 10.1002/elps.201100171. [DOI] [PubMed] [Google Scholar]
- 86.Hsin-Yu W, Cheng-Hsien L. A novel electrokinetic micromixer. TRANSDUCERS, Solid-State Sensors, Actuators and Microsystems, 12th International Conference on. 2003;1:631–634. doi: 10.1109/SENSOR.2003.1215552. [DOI] [Google Scholar]
- 87.Xize N, Yi-Kuen L. Efficient spatial-temporal chaotic mixing in microchannels. J Micromech Microeng. 2003;13:454. [Google Scholar]
- 88.Wei-Kuo T, Jr-Lung L, Wang-Chou S, Shu-Hui C, Gwo-Bin L. Active micro-mixers using surface acoustic waves on Y-cut 128° LiNbO3. J Micromech Microeng. 2006;16:539. [Google Scholar]
- 89.Cazorla PH, et al. Piezoelectric micro-pump with PZT thin film for low consumption microfluidic devices. Proc Eng. 2014;87:488–491. http://dx.doi.org/10.1016/j.proeng.2014.11.402. [Google Scholar]
- 90.Tracey MC, Johnston ID, Davis JB, Tan CKL. Dual independent displacement-amplified micropumps with a single actuator. J Micromech Microeng. 2006;16:1444. [Google Scholar]
- 91.Cheung K, Gawad S, Renaud P. Impedance spectroscopy flow cytometry: On-chip label-free cell differentiation. Cytom Part A J Int Soc Anal Cytol. 2005;65:124–132. doi: 10.1002/cyto.a.20141. [DOI] [PubMed] [Google Scholar]
- 92.Shrirao AB. High aspect ratio electrodes for high yield electroporation of cells. New Jersey Institute of Technology; 2012. dissertation thesis. [Google Scholar]
- 93.Chen J, et al. Classification of cell types using a microfluidic device for mechanical and electrical measurement on single cells. Lab Chip. 2011;11:3174–3181. doi: 10.1039/C1LC20473D. [DOI] [PubMed] [Google Scholar]
- 94.Cheung KC, et al. Microfluidic impedance-based flow cytometry. Cytom Part A J Int Soc Anal Cytol. 2010;77:648–666. doi: 10.1002/cyto.a.20910. [DOI] [PubMed] [Google Scholar]
- 95.Evander M, et al. Microfluidic impedance cytometer for platelet analysis. Lab Chip. 2013;13:722–729. doi: 10.1039/c2lc40896a. [DOI] [PubMed] [Google Scholar]
- 96.Holmes D, et al. Label-free differential leukocyte counts using a microfabricated, single-cell impedance spectrometer. IEEE Sensors. 2007:1452–1455. doi: 10.1109/ICS-ENS.2007.4388687. [DOI] [Google Scholar]
- 97.Chen Y, et al. Standing surface acoustic wave (SSAW)-based microfluidic cytometer. Lab Chip. 2014;14:916–923. doi: 10.1039/c3lc51139a. [DOI] [PMC free article] [PubMed] [Google Scholar]
- 98.Watts BR, et al. Fabrication and performance of a photonic-microfluidic integrated device. Micromachines. 2012;3:62. [Google Scholar]
- 99.Kowpak T, Watts BR, Zhang Z, Zhu S, Xu C. Fabrication of photonic/microfluidic integrated devices using an epoxy photoresist. Macromol Mater Eng. 2010;295:559–565. doi: 10.1002/mame.200900340. [DOI] [Google Scholar]
- 100.Watts BR, Zhang Z, Xu CQ, Cao X, Lin M. Integration of optical components on-chip for scattering and fluorescence detection in an optofluidic device. Biomed Optics Express. 2012;3:2784–2793. doi: 10.1364/BOE.3.002784. [DOI] [PMC free article] [PubMed] [Google Scholar]
- 101.Watts BR, Kowpak T, Zhang Z, Xu CQ, Zhu S. Formation and characterization of an ideal excitation beam geometry in an optofluidic device. Biomed Optics Express. 2010;1:848–860. doi: 10.1364/BOE.1.000848. [DOI] [PMC free article] [PubMed] [Google Scholar]
- 102.Watts BR, Zhang Z, Xu CQ, Cao X, Lin M. A method for detecting forward scattering signals on-chip with a photonic-microfluidic integrated device. Biomed Optics Express. 2013;4:1051–1060. doi: 10.1364/BOE.4.001051. [DOI] [PMC free article] [PubMed] [Google Scholar]
- 103.Wang Z, et al. Measurements of scattered light on a microchip flow cytometer with integrated polymer based optical elements. Lab Chip. 2004;4:372–377. doi: 10.1039/B400663A. [DOI] [PubMed] [Google Scholar]
- 104.Rosenauer M, Buchegger W, Finoulst I, Verhaert P, Vellekoop M. Miniaturized flow cytometer with 3D hydrodynamic particle focusing and integrated optical elements applying silicon photodiodes. Microfluid Nanofluid. 2011;10:761–771. doi: 10.1007/s10404-010-0707-z. [DOI] [Google Scholar]
- 105.Sato K, et al. Microchip-based immunoassay system with branching multichannels for simultaneous determination of interferon-γ. Electrophoresis. 2002;23:734–739. doi: 10.1002/1522-2683(200203)23:5<734::AID-ELPS734>3.0.CO;2-W. [DOI] [PubMed] [Google Scholar]
- 106.Sung Kim K, Park J-K. Magnetic force-based multiplexed immunoassay using superparamagnetic nanoparticles in microfluidic channel. Lab Chip. 2005;5:657–664. doi: 10.1039/B502225H. [DOI] [PubMed] [Google Scholar]
- 107.Ralf S, Martin B, Thomas P, Stephan H. Droplet based microfluidics. Rep Prog Phys. 2012;75:016601. doi: 10.1088/0034-4885/75/1/016601. [DOI] [PubMed] [Google Scholar]
- 108.Sharma S, Srisa-Art M, Scott S, Asthana A, Cass A. Droplet-based microfluidics. Meth Mol Biol (Clifton, NJ) 2013;949:207–230. doi: 10.1007/978-1-62703-134-9_15. [DOI] [PubMed] [Google Scholar]
- 109.Fook Kong T, et al. Enhancing malaria diagnosis through microfluidic cell enrichment and magnetic resonance relaxometry detection. Sci Rep. 2015;5:11425. doi: 10.1038/srep11425. [DOI] [PMC free article] [PubMed] [Google Scholar]
- 110.Piyasena ME, Graves SW. The intersection of flow cytometry with microfluidics and microfabrication. Lab Chip. 2014;14:1044–1059. doi: 10.1039/c3lc51152a. [DOI] [PMC free article] [PubMed] [Google Scholar]
- 111.Chen H-h, Sun B, Tran KK, Shen H, Gao D. A microfluidic manipulator for enrichment and alignment of moving cells and particles. J Biomech Eng. 2009;131:074505–074505-4. doi: 10.1115/1.3127258. [DOI] [PubMed] [Google Scholar]
- 112.Wang G, et al. Microfluidic cellular enrichment and separation through differences in viscoelastic deformation. Lab Chip. 2015;15:532–540. doi: 10.1039/C4LC01150C. [DOI] [PubMed] [Google Scholar]
- 113.Augustsson P, Magnusson C, Nordin M, Lilja H, Laurell T. Microfluidic, label-free enrichment of prostate cancer cells in blood based on acoustophoresis. Anal Chem. 2012;84:795–7962. doi: 10.1021/ac301723s. [DOI] [PMC free article] [PubMed] [Google Scholar]
- 114.Çetin B, Li D. Dielectrophoresis in microfluidics technology. Electrophoresis. 2011;32:2410–2427. doi: 10.1002/elps.201100167. [DOI] [PubMed] [Google Scholar]
- 115.Gascoyne PRC, Vykoukal J. Particle separation by dielectrophoresis. Electro phoresis. 2002;23:1973–1983. doi: 10.1002/1522-2683(200207)23:13<1973::AID-ELPS1973>3.0.CO;2-1. [DOI] [PMC free article] [PubMed] [Google Scholar]
- 116.Pohl HA. Biological dielectrophoresis: Applications to the determination of the dielectric properties of cells, to cell sorting, and to fusion. Conference on Electrical Insulation and Dielectric Phenomena — Annual Report 1982. 1982:71–78. doi: 10.1109/CEIDP.1982.7726515. [DOI] [Google Scholar]
- 117.Shafiee H, Caldwell JL, Davalos RV. A microfluidic system for biological particle enrichment using contactless dielectrophoresis. J Assoc Lab Autom. 2010;15:224–232. doi: 10.1016/j.jala.2010.02.003. [DOI] [Google Scholar]
- 118.Osman O, et al. Microfluidic immunomagnetic cell separation using integrated permanent micromagnets. Biomicrofluidics. 2013;7:054115. doi: 10.1063/1.4825395. [DOI] [PMC free article] [PubMed] [Google Scholar]
- 119.Robert D, et al. Cell sorting by endocytotic capacity in a microfluidic magnetophoresis device. Lab Chip. 2011;11:1902–1910. doi: 10.1039/C0LC00656D. [DOI] [PubMed] [Google Scholar]
- 120.Lin YH, et al. A negative-pressure-driven microfluidic chip for the rapid detection of a bladder cancer biomarker in urine using bead-based enzyme-linked immunosorbent assay. Biomicrofluidics. 2013;7:024103. doi: 10.1063/1.4794974. [DOI] [PMC free article] [PubMed] [Google Scholar]
- 121.Svobodova Z, et al. Development of a magnetic immunosorbent for on-chip precon-centration of amyloid β isoforms: Representatives of Alzheimer’s disease biomarkers. Biomicrofluidics. 2012;6:024126. doi: 10.1063/1.4722588. [DOI] [PMC free article] [PubMed] [Google Scholar]
- 122.Pamme N, Wilhelm C. Continuous sorting of magnetic cells via on-chip free-flow magnetophoresis. Lab Chip. 2006;6:974–980. doi: 10.1039/B604542A. [DOI] [PubMed] [Google Scholar]
- 123.Plouffe BD, Murthy SK, Lewis LH. Fundamentals and application of magnetic particles in cell isolation and enrichment. Rep Progr Phys Phys Soc (Great Britain) 2015;78:016601–016601. doi: 10.1088/0034-4885/78/1/016601. [DOI] [PMC free article] [PubMed] [Google Scholar]
- 124.Shields CW, Reyes CD, López GP. Microfluidic cell sorting: A review of the advances in the separation of cells from debulking to rare cell isolation. Lab Chip. 2015;15:1230–1249. doi: 10.1039/c4lc01246a. [DOI] [PMC free article] [PubMed] [Google Scholar]
- 125.Guiping Z, Nam Trung N. Particle sorting in microfluidic systems. Micro Nanosyst. 2010;2:202–216. http://dx.doi.org/10.2174/1876402911002030202. [Google Scholar]
- 126.Cho SH, Chen CH, Lo Y-H. Optofluidic biosensors: Miniaturized multi-color flow cytometer and fluorescence-activated cell sorter (microFACS) Proc SPIE 8099, Biosensing and Nanomedicine IV. 2011:80990F–80990F-8. doi: 10.1117/12.901258. http://dx.doi.org/10.1117/12.901258. [DOI]
- 127.Wang X, et al. Enhanced cell sorting and manipulation with combined optical tweezer and microfluidic chip technologies. Lab Chip. 2011;11:3656–3662. doi: 10.1039/C1LC20653B. [DOI] [PubMed] [Google Scholar]
- 128.Wang MM, et al. Microfluidic sorting of mammalian cells by optical force switching. Nat Biotechnol. 2005;23:83–87. doi: 10.1038/nbt1050. http://www.nature.com/nbt/journal/v23/n1/suppinfo/nbt1050_S1.html. [DOI] [PubMed] [Google Scholar]
- 129.Fulcrand R, et al. On chip magnetic actuator for batch-mode dynamic manipulation of magnetic particles in compact lab-on-chip. Sens Actuat B Chem. 2011;160:1520–1528. http://dx.doi.org/10.1016/j.snb.2011.08.011. [Google Scholar]
- 130.Takahashi K, Hattori A, Suzuki I, Ichiki T, Yasuda K. Non-destructive on-chip cell sorting system with real-time microscopic image processing. J Nanobiotechnol. 2004;2:5. doi: 10.1186/1477-3155-2-5. [DOI] [PMC free article] [PubMed] [Google Scholar]
- 131.Yao B, et al. A microfluidic device based on gravity and electric force driving for flow cytometry and fluorescence activated cell sorting. Lab Chip. 2004;4:603–607. doi: 10.1039/B408422E. [DOI] [PubMed] [Google Scholar]
- 132.Baret JC, et al. Fluorescence-activated droplet sorting (FADS): Efficient microfluidic cell sorting based on enzymatic activity. Lab Chip. 2009;9:1850–1858. doi: 10.1039/B902504A. [DOI] [PubMed] [Google Scholar]
- 133.Girault M, et al. An on-chip imaging droplet-sorting system: A real-time shape recognition method to screen target cells in droplets with single cell resolution. Sci Rep. 2017;7:40072. doi: 10.1038/srep40072. [DOI] [PMC free article] [PubMed] [Google Scholar]
- 134.Mazutis L, et al. Single-cell analysis and sorting using droplet-based microfluidics. Nat Protoc. 2013;8:870–891. doi: 10.1038/nprot.2013.046. [DOI] [PMC free article] [PubMed] [Google Scholar]
- 135.Wang L, Flanagan LA, Jeon NL, Monuki E, Lee AP. Dielectrophoresis switching with vertical sidewall electrodes for microfluidic flow cytometry. Lab Chip. 2007;7:1114–1120. doi: 10.1039/B705386J. [DOI] [PMC free article] [PubMed] [Google Scholar]
- 136.Fu AY, Chou HP, Spence C, Arnold FH, Quake SR. An integrated microfabri-cated cell sorter. Anal Chem. 2002;74:2451–2457. doi: 10.1021/ac0255330. [DOI] [PubMed] [Google Scholar]
- 137.Wolff A, et al. Integrating advanced functionality in a microfabricated high-throughput fluorescent-activated cell sorter. Lab Chip. 2003;3:22–27. doi: 10.1039/B209333B. [DOI] [PubMed] [Google Scholar]
- 138.Chang C, Yang R. Hydrodynamic focusing effect on two-unmixed-fluid in micro-channels. Int J Nonlin Sci Numer Simul. 2008;9:213. [Google Scholar]
- 139.Choi H, et al. A flow cytometry-based submicron-sized bacterial detection system using a movable virtual wall. Lab Chip. 2014;14:2327–2333. doi: 10.1039/c4lc00238e. [DOI] [PubMed] [Google Scholar]
- 140.Lin SC, Yen PW, Peng CC, Tung Y-C. Single channel layer, single sheath-flow inlet microfluidic flow cytometer with three-dimensional hydrodynamic focusing. Lab Chip. 2012;12:3135–3141. doi: 10.1039/C2LC40246G. [DOI] [PubMed] [Google Scholar]
- 141.Zhang M, Lian Y, Harnett C, Brehob E. Investigation of hydrodynamic focusing in a microfluidic Coulter counter device. J Biomech Eng. 2012;134:081001–081001-9. doi: 10.1115/1.4007091. [DOI] [PubMed] [Google Scholar]
- 142.Rodriguez-Trujillo R, Mills CA, Samitier J, Gomila G. Low cost micro-Coulter counter with hydrodynamic focusing. Microfluid Nanofluid. 2007;3:171–176. doi: 10.1007/s10404-006-0113-8. [DOI] [Google Scholar]
- 143.Scott R, Sethu P, Harnett CK. Three-dimensional hydrodynamic focusing in a microfluidic Coulter counter. Rev Sci Instrum. 2008;79:046104. doi: 10.1063/1.2900010. [DOI] [PubMed] [Google Scholar]
- 144.Huang SB, et al. A clogging-free microfluidic platform with an incorporated pneumatically driven membrane-based active valve enabling specific membrane capacitance and cytoplasm conductivity characterization of single cells. Sens Actuat B Chem. 2014;190:928–936. http://dx.doi.org/10.1016/j.snb.2013.09.070. [Google Scholar]
- 145.Martel JM, Toner M. Inertial focusing in microfluidics. Annu Rev Biomed Eng. 2014;16:371–396. doi: 10.1146/annurev-bioeng-121813-120704. [DOI] [PMC free article] [PubMed] [Google Scholar]
- 146.Oakey J, et al. Particle focusing in staged inertial microfluidic devices for flow cytometry. Anal Chem. 2010;82:3862–3867. doi: 10.1021/ac100387b. [DOI] [PMC free article] [PubMed] [Google Scholar]
- 147.Bhagat AAS, Kuntaegowdanahalli SS, Kaval N, Seliskar CJ, Papautsky I. Inertial microfluidics for sheath-less high-throughput flow cytometry. Biomed Microdev. 2010;12:187–195. doi: 10.1007/s10544-009-9374-9. [DOI] [PubMed] [Google Scholar]
- 148.Chung AJ, Gossett DR, Di Carlo D. Three dimensional, sheathless, and high-throughput microparticle inertial focusing through geometry-induced secondary flows. Small. 2013;9:685–690. doi: 10.1002/smll.201202413. [DOI] [PubMed] [Google Scholar]
- 149.Austin Suthanthiraraj PP, et al. One-dimensional acoustic standing waves in rectangular channels for flow cytometry. Methods. 2012;57:259–271. doi: 10.1016/j.ymeth.2012.02.013. https://doi.org/10.1016/j.ymeth.2012.02.013. [DOI] [PubMed] [Google Scholar]
- 150.Regmi R, Mohan K, Mondal PP. Light sheet based imaging flow cytometry on a microfluidic platform. Microsc Res Tech. 2013;76:1101–1107. doi: 10.1002/jemt.22296. [DOI] [PubMed] [Google Scholar]
- 151.Skommer J, et al. Multiparameter lab-on-a-chip flow cytometry of the cell cycle. Biosens Bioelectron. 2013;42:586–591. doi: 10.1016/j.bios.2012.11.008. https://doi.org/10.1016/j.bios.2012.11.008. [DOI] [PubMed] [Google Scholar]
- 152.Houston JP, et al. In: Overview of Fluorescence Lifetime Measurements in Flow Cytometry Protocols. Hawley TS, Hawley RG, editors. Springer; New York: 2018. pp. 421–446. [DOI] [PubMed] [Google Scholar]
- 153.Jenkins P, Naivar MA, Houston JP. Toward the measurement of multiple fluorescence lifetimes in flow cytometry: Maximizing multi-harmonic content from cells and microspheres. J Biophoton. 2015;8:908–917. doi: 10.1002/jbio.201400115. [DOI] [PMC free article] [PubMed] [Google Scholar]
- 154.Nedbal J, et al. Time-domain microfluidic fluorescence lifetime flow cytometry for high-throughput Förster resonance energy transfer screening. Cytometry. 2015;87:104–118. doi: 10.1002/cyto.a.22616. [DOI] [PMC free article] [PubMed] [Google Scholar]
- 155.Cho SH, Chen CH, Tsai FS, Godin JM, Lo Y-H. Human mammalian cell sorting using a highly integrated micro-fabricated fluorescence-activated cell sorter (μFACS) Lab Chip. 2010;10:1567–1573. doi: 10.1039/c000136h. [DOI] [PMC free article] [PubMed] [Google Scholar]
- 156.Vercruysse D, et al. Three-part differential of unlabeled leukocytes with a compact lens-free imaging flow cytometer. Lab Chip. 2015;15:1123–1132. doi: 10.1039/C4LC01131G. [DOI] [PubMed] [Google Scholar]
- 157.Huang X, et al. A contact-imaging based microfluidic cytometer with machine-learning for single-frame super-resolution processing. PLoS One. 2014;9:e104539. doi: 10.1371/journal.pone.0104539. [DOI] [PMC free article] [PubMed] [Google Scholar]
- 158.Su TW, Seo S, Erlinger A, Ozcan A. High-throughput lensfree imaging and characterization of a heterogeneous cell solution on a chip. Biotechnol Bioeng. 2009;102:856–868. doi: 10.1002/bit.22116. [DOI] [PMC free article] [PubMed] [Google Scholar]
- 159.Seo S, Su TW, Tseng DK, Erlinger A, Ozcan A. Lensfree holographic imaging for on-chip cytometry and diagnostics. Lab Chip. 2009;9:777–787. doi: 10.1039/b813943a. [DOI] [PMC free article] [PubMed] [Google Scholar]
- 160.Gopakumar G, Jagannadh VK, Gorthi SS, Subrahmanyam GRKS. Framework for morphometric classification of cells in imaging flow cytometry. J Microsc. 2016:261, 307–319. doi: 10.1111/jmi.12335. [DOI] [PubMed] [Google Scholar]
- 161.Graham MD. The Coulter principle: Foundation of an industry. J Assoc Lab Autom. 2003;8:72–81. doi: 10.1016/s1535-5535-03-00023-6. [DOI] [Google Scholar]
- 162.Robinson JP, Roederer M. Flow cytometry strikes gold. Science (New York, NY) 2015;350:739. doi: 10.1126/science.aad6770. [DOI] [PubMed] [Google Scholar]
- 163.Volpatti LR, Yetisen AK. Commercialization of microfluidic devices. Trends Biotechnol. 2014;32:347–350. doi: 10.1016/j.tibtech.2014.04.010. [DOI] [PubMed] [Google Scholar]
- 164.Haber C. Microfluidics in commercial applications; An industry perspective. Lab Chip. 2006;6:1118–1121. doi: 10.1039/B610250F. [DOI] [PubMed] [Google Scholar]
- 165.Wlodkowic D, Darzynkiewicz Z. Rise of the micromachines: Microfluidics and the future of cytometry. Meth Cell Biol. 2011;102:105–125. doi: 10.1016/B978-0-12-374912-3.00005-5. [DOI] [PMC free article] [PubMed] [Google Scholar]
- 166.Nawaz AA, et al. Sub-micrometer-precision, three-dimensional (3D) hydrodynamic focusing via “microfluidic drifting”. Lab Chip. 2014;14:415–423. doi: 10.1039/c3lc50810b. [DOI] [PMC free article] [PubMed] [Google Scholar]
- 167.McKenna BK, Evans JG, Cheung MC, Ehrlich DJ. A parallel microfluidic flow cytometer for high content Screening. Nature Methods. 2011;8:401–403. doi: 10.1038/nmeth.1595. [DOI] [PMC free article] [PubMed] [Google Scholar]
- 168.Emaminejad S, Javanmard M, Dutton RW, Davis RW. Microfluidic diagnostic tool for the developing world: Contactless impedance flow cytometry. Lab Chip. 2012;12:4499–4507. doi: 10.1039/c2lc40759k. [DOI] [PMC free article] [PubMed] [Google Scholar]
- 169.Shi W, Guo L, Kasdan H, Tai Y-C. Four-part leukocyte differential count based on sheathless microflow cytometer and fluorescent dye assay. Lab Chip. 2013;13:1257–1265. doi: 10.1039/c3lc41059e. [DOI] [PubMed] [Google Scholar]
- 170.Loureiro J, et al. Toward a magnetoresistive chip cytometer: Integrated detection of magnetic beads flowing at cm/s velocities in microfluidic channels. Appl Phys Lett. 2009;95:034104. doi: 10.1063/1.3182791. [DOI] [Google Scholar]
- 171.Fu AY, Spence C, Scherer A, Arnold FH, Quake SR. A microfabricated fluorescence-activated cell sorter. Nat Biotechnol. 1999;17:1109–1111. doi: 10.1038/15095. [DOI] [PubMed] [Google Scholar]
- 172.Hulett HR, Bonner WA, Sweet RG, Herzenberg LA. Development and application of a rapid cell sorter. Clin Chem. 1973;19:813–816. [PubMed] [Google Scholar]
- 173.Kiermer V. FACS-on-a-chip. Nat Meth. 2005;2:91–91. [Google Scholar]
- 174.Cheng Z, Wu X, Cheng J, Liu P. Microfluidic fluorescence-activated cell sorting (μFACS) chip with integrated piezoelectric actuators for low-cost mammalian cell enrichment. Microfluid Nanofluid. 2017;21:9. doi: 10.1007/s10404-017-1847-1. [DOI] [Google Scholar]
- 175.Hassan U, et al. A microfluidic biochip for complete blood cell counts at the point-of-care. Technology. 2015;3:201–213. doi: 10.1142/s2339547815500090. [DOI] [PMC free article] [PubMed] [Google Scholar]
- 176.Hassan U, Watkins NN, Reddy B, Jr, Damhorst G, Bashir R. Microfluidic differential immunocapture biochip for specific leukocyte counting. Nat Protoc. 2016;11:714–726. doi: 10.1038/nprot.2016.038. [DOI] [PMC free article] [PubMed] [Google Scholar]
- 177.Han X, van Berkel C, Gwyer J, Capretto L, Morgan H. Microfluidic lysis of human blood for leukocyte analysis using single cell impedance cytometry. Anal Chem. 2012;84:1070–1075. doi: 10.1021/ac202700x. [DOI] [PubMed] [Google Scholar]
- 178.Hayashi M, et al. Fully automated on-chip imaging flow cytometry system with disposable contamination-free plastic re-cultivation chip. Int J Mol Sci. 2011;12:3618–3634. doi: 10.3390/ijms12063618. [DOI] [PMC free article] [PubMed] [Google Scholar]
- 179.Karabacak NM, et al. Microfluidic marker-free isolation of circulating tumor cells from blood samples. Nat Protoc. 2014;9:694–710. doi: 10.1038/nprot.2014.044. [DOI] [PMC free article] [PubMed] [Google Scholar]
- 180.Sequist LV, Nagrath S, Toner M, Haber DA, Lynch TJ. The CTC-chip: An exciting new tool to detect circulating tumor cells in lung cancer patients. J Thorac Oncol. 2009;4:281–283. doi: 10.1097/JTO.0b013e3181989565. [DOI] [PMC free article] [PubMed] [Google Scholar]
- 181.García-Herrero S, et al. BACs-on-Beads technology: A reliable test for rapid detection of aneuploidies and microdeletions in prenatal diagnosis. BioMed Res Int. 2014;2014:7. doi: 10.1155/2014/590298. [DOI] [PMC free article] [PubMed] [Google Scholar]
- 182.Grati FR, Vialard F, Gross S. BACs-on-Beads (BoBs) assay for the genetic evaluation of prenatal samples and products of conception. Meth Mol Biol (Clifton, NJ) 2015;1227:259–278. doi: 10.1007/978-1-4939-1652-8_13. [DOI] [PubMed] [Google Scholar]
- 183.Wu M, Piccini M, Koh CY, Lam KS, Singh AK. Single cell microRNA analysis using microfluidic flow cytometry. PLoS One. 2013;8:e55044. doi: 10.1371/journal.pone.0055044. [DOI] [PMC free article] [PubMed] [Google Scholar]
- 184.Lee W, Fon W, Axelrod BW, Roukes ML. High-sensitivity microfluidic calorimeters for biological and chemical applications. Proc Natl Acad Sci USA. 2009;106:15225–15230. doi: 10.1073/pnas.0901447106. [DOI] [PMC free article] [PubMed] [Google Scholar]
- 185.Schafer D, et al. Microfluidic cell counter with embedded optical fibers fabricated by femtosecond laser ablation and anodic bonding. Optics Express. 2009;17:6068–6073. doi: 10.1364/oe.17.006068. [DOI] [PMC free article] [PubMed] [Google Scholar]
- 186.Hulspas R, et al. Purification of regulatory T cells with the use of a fully enclosed high-speed microfluidic system. Cytotherapy. 2014;16:1384–1389. doi: 10.1016/j.jcyt.2014.05.016. https://doi.org/10.1016/j.jcyt.2014.05.016. [DOI] [PubMed] [Google Scholar]
- 187.Tak For Yu Z, et al. Rapid, automated, parallel quantitative immunoassays using highly integrated microfluidics and AlphaLISA. Sci Rep. 2015;5:11339. doi: 10.1038/srep11339. [DOI] [PMC free article] [PubMed] [Google Scholar]
- 188.Issadore D, et al. Ultrasensitive clinical enumeration of rare cells ex vivo using a micro-hall detector. Sci Transl Med. 2012;4:141ra92. doi: 10.1126/scitranslmed.3003747. [DOI] [PMC free article] [PubMed] [Google Scholar]
- 189.Zhao Y, et al. Single-cell electrical phenotyping enabling the classification of mouse tumor samples. Sci Rep. 2016;6:19487. doi: 10.1038/srep19487. [DOI] [PMC free article] [PubMed] [Google Scholar]
- 190.Tibbe AG, et al. Optical tracking and detection of immunomagnetically selected and aligned cells. Nat Biotechnol. 1999;17:1210–1213. doi: 10.1038/70761. [DOI] [PubMed] [Google Scholar]
- 191.Chan SDH, Luedke G, Valer M, Buhlmann C, Preckel T. Cytometric analysis of protein expression and apoptosis in human primary cells with a novel microfluidic chip-based system. Cytom Part A. 2003;55A:119–125. doi: 10.1002/cyto.a.10070. [DOI] [PubMed] [Google Scholar]
- 192.Patra B, Peng CC, Liao WH, Lee CH, Tung Y-C. Drug testing and flow cytometry analysis on a large number of uniform sized tumor spheroids using a microfluidic device. Sci Rep. 2016;6:21061. doi: 10.1038/srep21061. [DOI] [PMC free article] [PubMed] [Google Scholar]
- 193.Ehrlich DJ, et al. Parallel imaging microfluidic cytometer. Meth Cell Biol. 2011;102:49–75. doi: 10.1016/B978-0-12-374912-3.00003-1. [DOI] [PMC free article] [PubMed] [Google Scholar]
- 194.Akagi J, et al. Microflow cytometry in studies of programmed tumour cell death. Proc Eng. 2012;47:88–91. http://dx.doi.org/10.1016/j.proeng.2012.09.091. [Google Scholar]
- 195.Wlodkowic D, et al. Chip-based dynamic real-time quantification of drug-induced cytotoxicity in human tumor cells. Anal Chem. 2009;81:6952–6959. doi: 10.1021/ac9010217. [DOI] [PMC free article] [PubMed] [Google Scholar]
- 196.Jagannadh VK, Adhikari JV, Gorthi SS. Automated cell viability assessment using a microfluidics based portable imaging flow analyzer. Biomicrofluidics. 2015;9:024123. doi: 10.1063/1.4919402. [DOI] [PMC free article] [PubMed] [Google Scholar]
- 197.Wang J, et al. A new hand-held microfluidic cytometer for evaluating irradiation damage by analysis of the damaged cells distribution. Sci Rep. 2016;6:23165. doi: 10.1038/srep23165. [DOI] [PMC free article] [PubMed] [Google Scholar]
- 198.Lombardi D, Dittrich PS. Droplet microfluidics with magnetic beads: A new tool to investigate drug–protein interactions. Anal Bioanal Chem. 2011;399:347–352. doi: 10.1007/s00216-010-4302-7. [DOI] [PubMed] [Google Scholar]
- 199.Wilding P, et al. Integrated cell isolation and polymerase chain reaction analysis using silicon microfilter chambers. Anal Biochem. 1998;257:95–100. doi: 10.1006/abio.1997.2530. http://dx.doi.org/10.1006/abio.1997.2530. [DOI] [PubMed] [Google Scholar]
- 200.Khamenehfar A, Gandhi MK, Chen Y, Hogge DE, Li PCH. Dielectrophoretic microfluidic chip enables single-cell measurements for multidrug resistance in heterogeneous acute myeloid leukemia patient samples. Anal Chem. 2016;88:5680–5688. doi: 10.1021/acs.analchem.5b04446. [DOI] [PubMed] [Google Scholar]
- 201.Li X, Chen Y, Li PC. A simple and fast microfluidic approach of same-single-cell analysis (SASCA) for the study of multidrug resistance modulation in cancer cells. Lab Chip. 2011;11:1378–1384. doi: 10.1039/c0lc00626b. [DOI] [PubMed] [Google Scholar]
- 202.Palková Z, Váchová L, Valer M, Preckel T. Single-cell analysis of yeast, mammalian cells, and fungal spores with a microfluidic pressure-driven chip-based system. Cytom Part A. 2004;59A:246–253. doi: 10.1002/cyto.a.20049. [DOI] [PubMed] [Google Scholar]