

Abstract
Background
Vascular calcification and increased cardiovascular morbidity and mortality are closely related in patients with end‐stage renal disease and diabetes mellitus. Specific protein 1 (Sp1) is a transactivation molecule that plays a crucial role in the regulation of apoptosis, fibrosis, angiogenesis, and other pathological disorders. There is evidence that specific protein 1 (Sp1) directly stimulates the transcription of bone morphogenetic protein 2 (BMP2) and that BMP2 plays a key role in the calcification process in the BMP2–expressing F9 cell model system. Here, we investigated whether Sp1 plays an important role in vascular calcification and its potential regulatory mechanism in vascular calcification.
Methods and Results
In this study, vascular calcification was induced in male Wistar rats by administration of nicotine (25 mg/kg) and vitamin D3 (300 000 IU/kg). These rats were randomly selected for treatment with adenovirus harboring Sp1 knockdown gene or empty virus. The mechanism of Sp1 in vascular smooth muscle cells cultured in high phosphate medium was studied. Based on our findings, the Sp1 gene silencing or inhibition improved calcium deposition, which was partly achieved by inhibiting phenotype switch, apoptosis, and matrix vesicle release of vascular smooth muscle cells. Moreover, Sp1 can activate BMP2 transcription by binding to the Sp1‐binding element of the BMP2 promoter.
Conclusions
Overall, elevated Sp1 exerts a pro‐apoptotic effect, promoting BMP2 transcription and further accumulating vascular calcification. Proper and timely regulation of Sp1 expression may be a potential strategy for treatment of aging, end‐stage renal disease, and diabetic‐related macrovascular disease treatment.
Keywords: apoptosis, BMP2, calcification, phenotype switching of vascular smooth muscle cells, Sp1
Subject Categories: Vascular Disease
Clinical Perspective
What Is New?
Specific protein 1 expression is elevated in both human and rat calcified aorta.
Elevated specific protein 1 plays a pro‐apoptotic role and promotes bone morphogenetic protein 2 transcription, thereby accelerating vascular calcification.
What Are the Clinical Implications?
This study could account for the mechanism of vascular calcification, at least in part.
Proper and timely regulation of specific protein 1 expression and activity might be a potential therapeutic strategy for treatment of vascular calcification.
Introduction
Vascular calcification is an important link between cardiovascular diseases and end‐stage renal disease, aging, and diabetes mellitus and is a major risk factor for cardiovascular mortality1, 2 and a predictor of mortality in patients with end‐stage renal disease and diabetes mellitus.2 Recent studies have shown that phosphate levels are key in vascular calcification in terms of both clinical trials and experimental models.3 Vascular calcification is a process of active cell regulation rather than pure passive calcium deposition.1, 4 Potential mechanisms of vascular smooth muscle cells (VSMCs) calcification are involved in apoptosis, matrix vesicle (MV) release, conversion of the phenotype of vascular smooth muscle cells into osteoblast‐like cells characterized by the loss of contractile markers of VSMCs, such as α‐smooth muscle actin (α‐SMA), calponin, and smooth muscle 22α, and expressing osteogenic‐profile markers, including runt‐related transcription factor 2 (Runx2), alkaline phosphatase (ALP), osteopontin, osteocalcin, bone morphogenetic protein 2 (BMP2), and osterix,5 and vascular remodeling. Apoptosis and the products of apoptosis degradation—MVs—are considered a starting point or initiating link of vascular calcification.6, 7
Specific protein 1 (Sp1) is a transactivation molecule that is a founding member of the Sp/KLF family of transcription factors.8 Previous studies have shown that there are Sp1 binding sites in the human genome, which explains the role of Sp1 as an activator or suppressor, including cell growth, differentiation, apoptosis, chromatin remodeling, fibrosis, inflammation, and DNA damage.9, 10, 11, 12, 13, 14, 15, 16, 17 BMP2, an osteogenic‐profile marker, is the target gene for Sp1 in the BMP2‐expressing F9 cell model system.18 Given that the above function of Sp1 is highly correlated with the pathology of vascular calcification, we hypothesized that Sp1 may be involved in the regulation of vascular calcification. To test this hypothesis, we used in vitro and in vivo experimental models to mimic the internal environment of patients with vascular calcification.
Methods
The data that support the findings of this study are available from the corresponding author upon reasonable request.
Patients and Sample Processing
To detect the Sp1 expression in calcified human aorta, the discarded aortic tissue is collected from patients (n=4) undergoing coronary artery bypass graft surgery with or without aortic calcification. These protocols complied with the Management Rules of the Chinese Ministry of Health; all procedures met the appropriate criteria for the use and handling of human tissue in China. The study was approved by the review committee of Qilu Hospital, Jinan, China, and all subjects gave informed consent.
Animal Model and Gene Silencing of Sp1
A total of 30 male Wistar rats (170–200 g at the beginning of the experiments, provided by the experimental animal center of Shandong University, Jinan, China) were housed under standard conditions. After a 1‐week period of acclimatization, the rats were randomly assigned to 3 groups: control (n=10), vitamin D3 and nicotine‐induced calcification +Ad‐Sp1 (n=10), and vitamin D3 and nicotine‐induced calcification +vehicle (n=10). Plaque‐forming units (5×10¹⁰) of either adenovirus harboring Sp1 knockdown gene (Ad‐Sp1) or empty virus (vehicle) was delivered into the rats via jugular vein injection. Adenovirus transfer was repeated in 2 weeks. After a 3‐day recovery period of the first adenovirus injection, vascular calcification was induced with vitamin D3 (300 000 IU/kg) (Sigma, St Louis, MO) intramuscularly and administered nicotine (25 mg/kg) (Wuhan 3B Scientific Corporation, Hubei, China) dissolved in an intragastric manner in peanut oil as described previously.19 The rats were euthanized after 4 weeks of inducing calcification. We adhered to the animal protocols approved by the Shandong University Animal Care Committee. All animal care and experimental protocols complied with the Animal Management Rule of the Ministry of Health, People's Republic of China (Document No. 55, 2001). The pain of laboratory animals was kept to a minimum.
Experimental Procedure
At the end of the experiment, we anesthetized rats with 2% pentobarbital sodium and then dissected and perfused with saline. After these procedures, the thoracic aortas were removed from the chest and washed with saline after the rats were euthanized. A part of the aorta (≈5 mm) was fixed in 4% paraformaldehyde for 72 hours. Then, the tissues were dehydrated by ethanol, embedded in paraffin, and 5‐μm‐thick sections were used to analyze histology and morphometry. The remaining part of the aortas was immediately frozen in liquid nitrogen and stored at −80°C for further molecular experiments.
Calcification Staining
To visualize calcium deposition, the sections of aortas were stained with 1 mg/mL Alizarin red solution (pH 4.2). VSMCs were fixed with 95% ethanol for 15 minutes, rinsed, and then stained with Alizarin red solution for 30 minutes.
Quantification of Calcium Deposition and ALP Activity
Calcium content was determined using the QuantiChrom Calcium Assay Kit (Biosino Bio‐Technology and Science, Beijing) according to the manufacturer's instructions and was normalized to the protein content. The ALP activity was measured using an ALP assay kit (Beyotime Biotechnology, Jiangsu, China) and the results were normalized to the total protein concentration.
Immunohistochemical Staining
Immunohistochemical staining was performed as previously described.19 Briefly, tissue sections (5 μm) were rehydrated, and heat‐mediated antigen retrieval was performed using 0.05 mol/L sodium citrate buffer (pH 6.0). Tissues were treated with 3% hydrogen peroxide to block endogenous peroxidase activity and with BSA to prevent nonspecific staining. Primary antibody against Sp1 (1 μg/mL, Millipore) was added and incubated overnight at 4°C in a humid box. After a wash step using PBS, the sections were incubated with secondary antibody (Beijing Zhong Shan Golden Bridge Biological Technology, China) at 37°C for 30 minutes. After washing with PBS, the sections were incubated with DAB solution (Beijing Zhong Shan Golden Bridge Biological Technology, China). Nuclei were counterstained with hematoxylin. The tissue sections were observed under a confocal FV 1000 SPD laser‐scanning microscope (Olympus, Japan). Obtained images were analyzed with the Image‐Pro Plus 5.0 software. At least 3 fields per section were analyzed.
Terminal Deoxynucleotidyl Transferase‐Mediated dUTP Nick‐End Labeling Staining
Apoptosis in rats was assessed using the In Situ Cell Death Detection Kit (Millipore, MA) according to the manufacturer's specifications. Apoptosis in VSMCs were detected using the In Situ Cell Death Detection Kit (Roche, Germany) according to the manufacturer's instructions. At least 3 fields positive for apoptotic cells were counted in a blinded selection.
Cell Culture and Treatments
The A7r5 and MOVAs cell line, purchased from the Type Culture Collection of the Chinese Academy of Sciences (Shanghai, China), were cultured in DMEM containing 10% fetal bovine serum, 5.5 mmol/L glucose, and 2 mmol/L glutamine in a humidified incubator with 5% CO2. MOVAs cells were used for luciferase assays and chromatin immunoprecipitation assays (ChIP) and A7r5 cells were used in the other experiments. In addition, primary VSMCs that were isolated from rat thoracic aorta were used to detect the main indicators of smooth muscle cell calcification in order to verify the effect of Sp1 gene silencing. For calcification, confluent VSMCs were incubated in DMEM containing 10% fetal bovine serum and 10 mmol/L β‐glycerophosphate (β‐GP, Sigma‐Aldrich) for 2 to 14 days. The medium was replaced every 3 days. Sp1 gene silencing was achieved by infecting the cells with adenovirus harboring Sp1 knockdown gene (Ad‐Sp1). The cells in the Sp1 inhibition group were treated with Sp1 inhibitor mithramycin (MTM, Cayman Chemical) before inducing calcification.
Immunofluorescence Staining
A7r5 cells were seeded on glass‐bottom dishes treated with β‐GP after transfection of adenovirus or mithramycin as described above, washed with PBS, and then fixed with immunol staining fix solution (Beyotime Biotechnology, Jiangsu, China) for 20 minutes at room temperature. Then cells were washed with PBS, blocked in 5% BSA for 1 hour in a 37°C incubator, and incubated with primary antibody against Sp1 (2 μg/mL, Millipore), BMP2 (1:100 dilution, Proteintech Group, Chicago, IL), and α‐SMA (1:200 dilution, Cell Signaling Technology) in PBS with 0.1% Triton X‐100 in a humidified chamber overnight at 4°C. The cells were further washed with PBS before incubation with secondary antibody (1:200 dilution, Proteintech Group, Chicago, IL) for 30 minutes at 37°C. Cells were washed 3 times with PBS and covered by a drop of fluoroshield mounting medium with 4′,6‐diamidino‐2‐phenylindole (Abcam, Cambridge, UK). Images were viewed under laser scanning confocal microscopy (LSM710; Zeiss, Jena, Germany) and analyzed using Image‐Pro Plus 6.0.
Western Blot Analysis
Western blot analysis was performed as previously described.19 Primary antibodies against Sp1 (0.1 μg/mL, Millipore), BMP2 (1:1000 dilution), calponin (1:2000 dilution) (Proteintech Group, Chicago, IL), Runx2 (1:1000 dilution), α‐SMA (1:1000 dilution), caspase‐3 (1:1000 dilution), β‐actin (1:1000 dilution), GAPDH (1:1000 dilution) (Cell Signaling Technology), and horseradish peroxidase‐conjugated secondary antibody (Beijing Zhong Shan Golden Bridge Biological Technology, China) were used.
Quantitative Reverse Transcription Polymerase Chain Reaction
Total cellular RNA was prepared with a RNA extraction kit (Qiagen). Reverse transcription quantitative polymerase chain reaction was performed using the following primers: Sp1: Forward: 5′‐CCATCTTTGTCGATTGCTGA‐3′ and reverse: 5′‐AACGGTTTGATCTCGATCCC‐3′. BMP2: Forward: 5′‐CACGAGAATGGACGTGCCC‐3′ and reverse: 5′‐CACTAGAAGACAGCGGGTCC‐3′. Runx2: Forward: 5′‐GGACTGTGGTTACCGTCAT‐3′ and reverse: 5′‐GGAGGATTTGTGAAGACTGTT‐3′. α‐SMA: Forward: 5′‐CCACCGCAAATGCTTCTAAGT‐3′ and reverse: 5′‐GGCAGGAATGATTTGGAAAGG‐3′. Calponin: Forward: 5′‐GGAACACTGTGACACGCTCAA‐3′ and reverse 5′‐AGTTGTGTGGGTGGTGATTGTG‐3′. GAPDH: Forward: 5′‐GAAGGGGTTAAACACCTCTGC‐3′ and reverse: 5′‐ATGCTCTGCTTAAACACAATCCT‐3′. Reactions were carried out on a Real‐Time PCR System (LightCycler 96, Roche), using SYBR green as fluorescence dye. Experiments were performed in duplicate. Relative expression analysis involved the 2‐▵▵CT method.
Annexin V/Propidium Iodide Double Staining
Annexin V/propidium iodide double staining was performed using Annexin V‐FITC Apoptosis Detection Kits according to the manufacturer's protocols, and fluorescence intensity was measured by BD FACSCalibur (BD Biosciences, San Jose, CA).
Caspase‐3 Activity Assay
Caspase‐3 activity was assessed using caspase‐3 colorimetric assay kits according to the manufacturer's specifications (BioVison, Milpitas, CA), measured from the absorbance at 400 nm using a microplate reader.
Quantification of MVs
MVs isolation was performed as previously described.3 A7r5 cells were treated as described above for 3 days, and then the medium was collected after digested by collagenase and centrifuged at 10 000g at 4°C. MVs were isolated from the supernatant after centrifugation at 100 000g for 30 minutes at 4°C. MVs were then resuspended in 1% Triton X‐100, and protein content was determined by using BCA protein assay kits (Solarbio). An increase in protein content indicated an increased number of MVs.
Luciferase Assays
All nucleotide positions are indicated with respect to the murine distal Bmp2 promoter that is 2201 nt upstream of the initiator codon (ATG). Target DNA fragments were synthesized and ligated into the T‐vector (Genechem, Shanghai). Constructs BMP2‐LUC (full length) and B271‐LUC (nt −241 to 30) were created by digesting the resulting plasmid with KpnI and subcloning into the luciferase reporter vector, GV354 (Genechem, Shanghai) cut with KpnI. All plasmids were sequenced to confirm that they were the expected sequence. The promoter sequences used are shown in Table S1. Constructs were transfected into MOVAs cells before being treated with β‐GP. Firefly and renilla luciferase were measured using the Dual‐Luciferase reporter assay system (Promega) according to the manufacturer's instructions.
Chromatin Immunoprecipitation Assay
Nucleoprotein complexes were prepared from MOVAs cells treated with or without β‐GP. ChIP was performed using SimpleChIP® Plus Enzymatic Chromatin IP Kit (Cell Signaling Technology) according to the manufacturer's instructions. An anti‐Sp1 antibody (Millipore) was used. The primers used for polymerase chain reaction were as follows: BMP2 promoter: Forward: 5′ TCACACTCATCCGGGACGC 3′, and reverse: 5′GAACACCTCCCCCTCGGA 3′.
Electrophoretic Mobility Shift Assay
Nuclear extracts were prepared by using NE‐PER Nuclear and Cytoplasmic Extract kit (PIERCE). Electrophoretic mobility shift assay was performed using LightShift Chemiluminescent EMSA Kit (PIERCE) according to the manufacturer's specifications. The sequences of the probes were as follows: sense: 5′ GCGCTCGCCCCGCCCCGCTCCACC 3′; antisense: 5′ GGTGGAGCGGGGCGGGGCGAGCGC 3′.
Statistical Analysis
Data are reported as the mean±SEM. The Kolmogorov–Smirnov test was performed to analyze the normal distribution of the data. Accordingly, data from most of the parameters showed a normal distribution. For 2‐group comparisons of parametric data, a Student t test was performed, whereas nonparametric data were analyzed with the Mann–Whitney test. Statistical significance between multiple groups was determined by 1‐way ANOVA followed by Tukey's multiple comparisons test (parametric), Kruskal–Wallis test followed by Dunn's multiple comparisons test (nonparametric), where appropriate; P<0.05 was considered statistically significant. All statistical analyses involved use of SPSS v20.0 (SPSS Inc, Chicago, IL).
Results
Elevated Sp1 Expression in Both Human and Rat Calcified Aorta
As shown in Figure 1A, calcium deposition was observed in human aorta, sample 2 and sample 4, although the physician was unable to select a severely calcified region of the aorta to open. Meanwhile, the expression level of Sp1 was detected by Western blot. As shown in Figure 1B, the protein expression level of Sp1 was significantly increased in the calcified aorta, sample 2 and sample 4, compared with sample 1 and sample 3.
Figure 1.
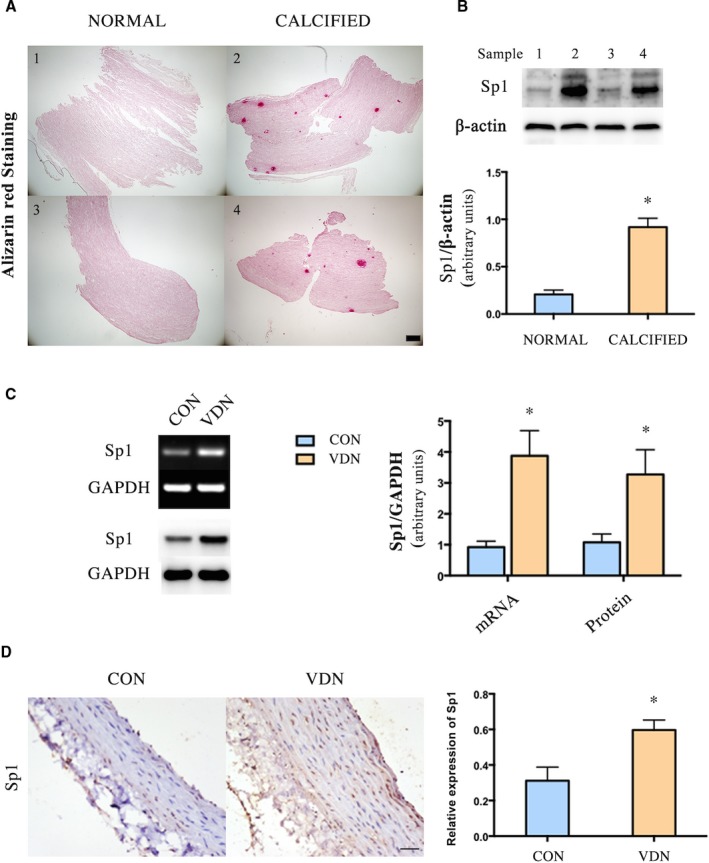
Sp1 was increased in the calcified aorta. A, Alizarin red staining of human aorta (Scale bar: 200 μm). B, Western blot analysis of Sp1 in human aorta, n=2 aortic tissue in each group. C, PCR and Western blot analyses of Sp1 mRNA and protein expression in rat aorta, n=9 aortic sections from 3 rats in each group. D, Representative immunohistochemical staining of Sp1 in rat aorta (n=9 aortic sections from 3 rats in each group, Scale bar: 20 μm). Data are mean±SEM. *P<0.05 vs Control. CON indicates control; PCR, polymerase chain reaction; Sp1, specific protein 1; VDN, vitamin D3 and nicotine‐induced calcification.
In addition, we detected the expression of Sp1 in rat aorta by polymerase chain reaction, Western blot, and immunohistochemical staining. The Sp1 mRNA and protein expression levels were significantly elevated in calcified aorta (Figure 1C and 1D).
Either Sp1 Gene Silencing or Treated with Sp1 Inhibitor Mithramycin Prevented VSMC Transdifferentiation into Osteoblast‐like Cells
To find out whether Sp1 was involved in vascular calcification, we used an adenovirus‐harboring Sp1 knockdown gene (Ad‐Sp1) for the purpose of reducing the expression level of Sp1. We infected A7r5 cells with the adenovirus first to test the efficiency. Sp1 expression was significantly suppressed by Ad‐Sp1 in comparison with the vehicle group (Figure 2A).
Figure 2.
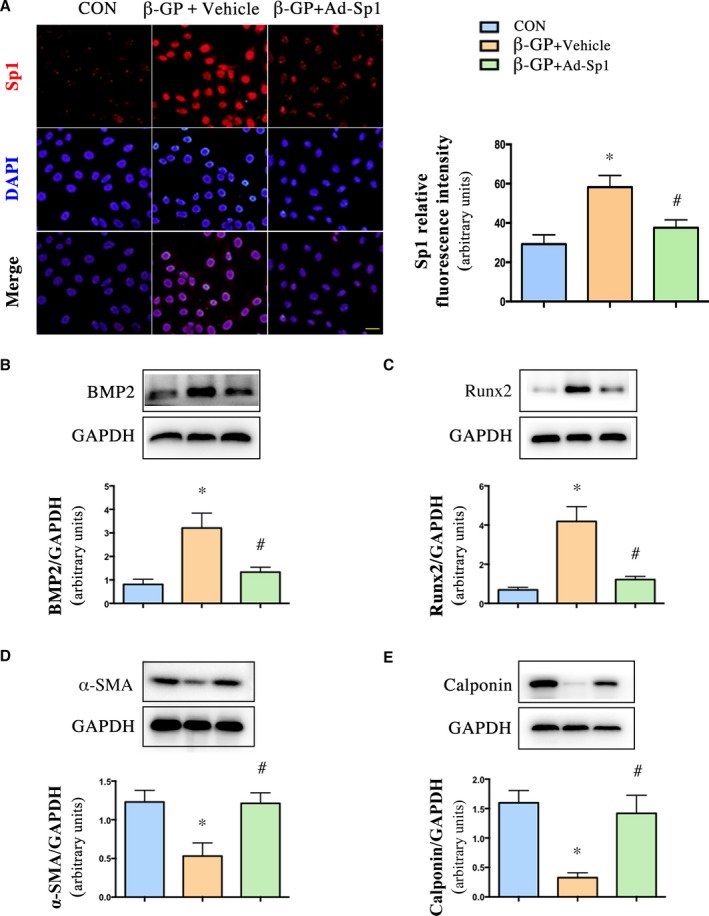
Sp1 gene silencing prevented VSMC transdifferentiation into osteoblast‐like cells. VSMCs were infected with adenovirus harboring Sp1 gene (Ad‐Sp1) or empty virus (Vehicle). A, Immunofluorescence staining and quantification of Sp1 expression in VSMCs (n=4, Scale bar: 20 μm). Representative Western blot images and quantification of (B) BMP2, (C) Runx2, (D) α‐ SMA, (E) calponin expression in treated primary rat VSMCs, n=5. Data are mean±SEM. *P<0.05, β‐GP or β‐GP vs Control; # P<0.05 β‐GP+Ad‐Sp1 vs β‐GP +Vehicle and β‐GP+Ad‐Sp1 vs β‐GP+Vehicle. Ad‐Sp1 indicates adenovirus harboring Sp1 knockdown gene; BMP2, bone morphogenetic protein 2; CON, control; DAPI, 4′,6‐diamidino‐2‐phenylindole; β‐GP, β‐glycerophosphate; Runx2, run‐related transcription factor 2; α‐ SMA, α‐smooth muscle actin; VDN, vitamin D3 and nicotine induced calcification; VSMCs, vascular smooth muscle cells.
In vitro, the calcified VSMCs induced by β‐GP with Ad‐Sp1 or different doses of mithramycin were pretreated, and the expression levels of osteogenic markers, such as BMP2, Runx2, and markers of contractile phenotype of VSMCs, such as α‐SMA and calponin, were detected. Sp1 gene silencing suppressed expression of the osteogenic markers and reserved expression of the contractile phenotype markers (Figure 2B through 2E), mithramycin downregulated expression levels of Sp1, osteogenic markers, and upregulated expression levels of contractile phenotype markers in a concentration‐dependent manner (Figure 3A through 3E), indicating a crucial role of Sp1 in the process of vascular calcification. The maximum effect of mithramycin was observed at 100 nmol/L. Therefore, we chose 100 nmol/L for further study. As shown in Figure 4A, immunofluorescence assay revealed a higher α‐SMA protein level and lower BMP2 protein level in both the Ad‐Sp1‐ and mithramycin‐treated group.
Figure 3.
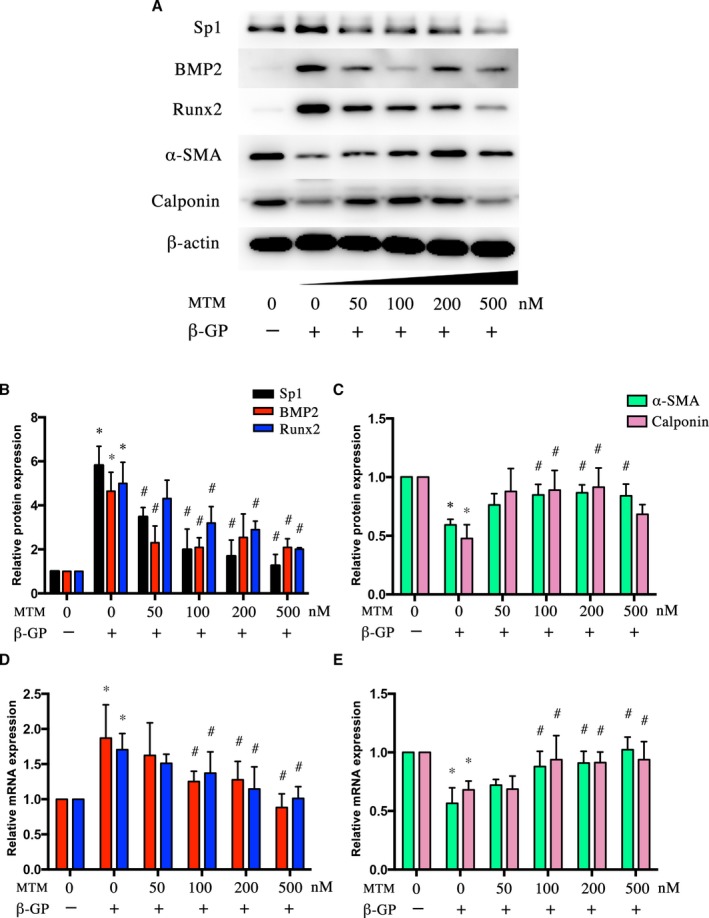
Sp1 inhibitor mithramycin suppressed β‐GP‐induced phenotype switching of VSMCs. VSMCs were treated with β‐GP and mithramycin in different doses. A, Representative Western blot bands and (B and C) quantification of BMP2, Runx2, α‐ SMA, and calponin protein expression. D and E, Real‐time quantitative PCR analyses of BMP2, Runx2, α‐ SMA, and calponin mRNA expression. Data are mean±SEM. n=4, *P<0.05 β‐GP vs Control; # P<0.05 β‐GP+mithramycin vs β‐GP. BMP2 indicates bone morphogenetic protein 2; β‐GP, β‐glycerophosphate; MTM, mithramycin; PCR, polymerase chain reaction; Runx2, run‐related transcription factor 2; α‐ SMA, α‐smooth muscle actin; Sp1, specific protein 1; VSMCs, vascular smooth muscle cells.
Figure 4.
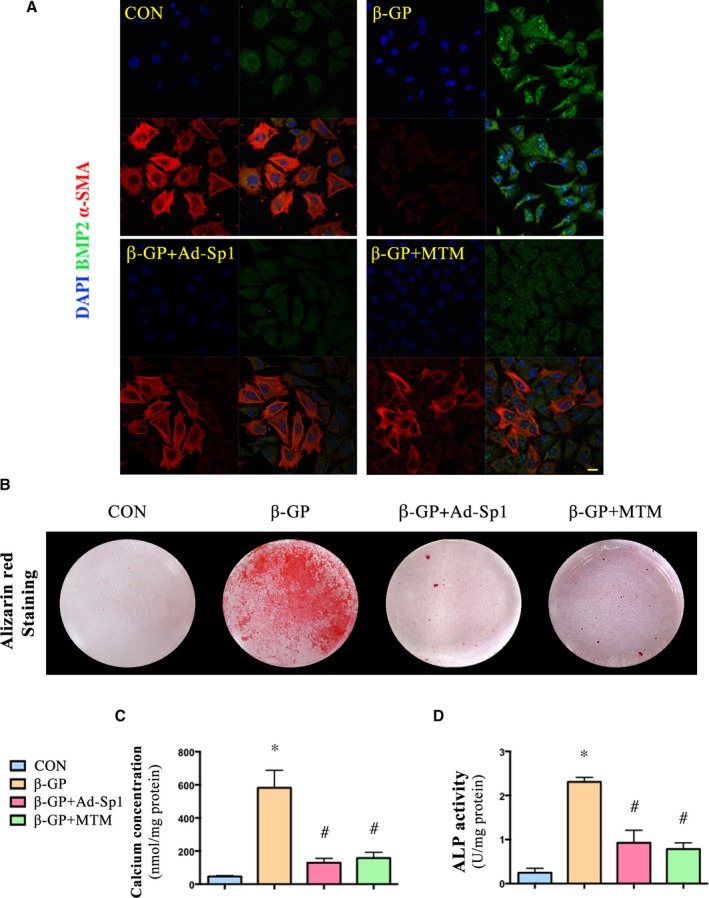
Silencing and inhibition of Sp1 protected VSMCs from β‐GP‐induced calcium deposition. VSMCs were treated with Ad‐Sp1 or mithramycin before being induced calcification by β‐GP. A, Confocal microscopy of immunofluorescence staining of BMP2 (green) and α‐SMA (red) (Scale bar: 20 μm). B, Alizarin red staining of VSMCs (pH 4.2). C, Quantitative analysis of calcium deposition in VSMCs normalized to protein content. D, Alkaline phosphatase (ALP) activity was measured and normalized to protein content for quantitative analysis. Data are mean±SEM. n=4, *P<0.05 β‐GP vs Control; # P<0.05 β‐GP+Ad‐Sp1 or β‐GP+mithramycin vs β‐GP. Ad‐Sp1 indicates adenovirus harboring Sp1 knockdown gene; BMP2, bone morphogenetic protein 2; CON, control; DAPI, 4′,6‐diamidino‐2‐phenylindole; β‐GP, β‐glycerophosphate; MTM, mithramycin; α‐ SMA, α‐smooth muscle actin; VSMCs, vascular smooth muscle cells.
Either Sp1 Gene Silencing or Sp1 Inhibition Protected VSMCs From β‐GP‐Induced Calcium Deposition
Furthermore,Alizarin red staining (Figure 4B), calcium content assay (Figure 4C), and ALP activity assay (Figure 4D) showed that inhibition or knockdown of Sp1 significantly reduced calcium deposition in A7r5 cells treated with β‐GP within 14 days.
Sp1 Gene Silencing Alleviated Vascular Calcification In Vivo
In vivo, adenovirus harboring Sp1 knockdown gene (Ad‐Sp1) was delivered into rats via the jugular vein to induce Sp1 gene silencing. Compared with the vehicle group, Sp1 expression was significantly suppressed by Ad‐Sp1 in vivo (Figure 5A and 5B). Calcium deposition was ameliorated by the treatment, as demonstrated by Alizarin red staining (Figure 5C), calcium concentration assay (Figure 5D), and ALP activity assay (Figure 5E), suggesting that Sp1 gene silencing alleviated vascular calcification. Additionally, the expression levels of osteogenic markers were suppressed (Figure 5F and 5G); in contrast, markers of contractile phenotype of VSMCs were restored in the Sp1 gene silencing group as compared with the vehicle group (Figure 5H and 5I), consistent with the results in vitro, confirming that Sp1 gene silencing prevented VSMC transdifferentiation into osteoblast‐like cells.
Figure 5.
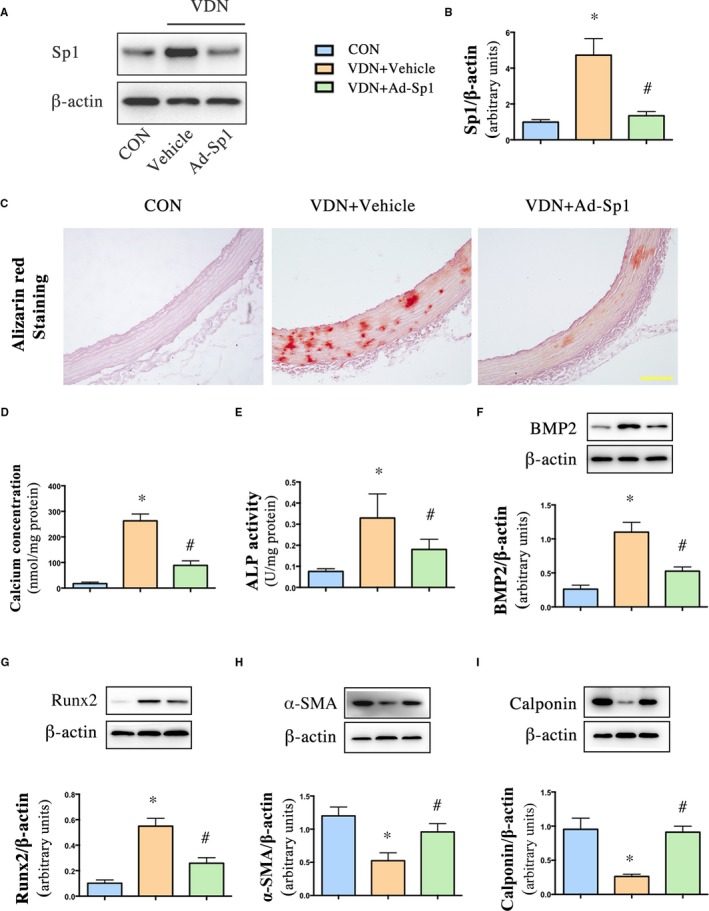
Sp1 gene silencing alleviated vascular calcification in aorta and inhibited VSMCs phenotype switching. Rats were injected with either adenovirus harboring Sp1 gene (Ad‐Sp1) or empty virus (Vehicle). A and B, Western blot analysis of Sp1 in rat aorta. C, Alizarin red staining of aorta (pH 4.2) (Scale bar: 50 μm). D, Quantitative analysis of calcium deposition in aorta normalized to protein content. E, Alkaline phosphatase (ALP) activity was measured and normalized to protein content for quantitative analysis. F through I, Representative Western blot bands and quantification of BMP2, Runx2, α‐ SMA, and calponin expression in aorta extracts. Data are mean±SEM. n=15 aortic sections from 5 rats in each group, *P<0.05β‐GP or VDN vs Control; # P<0.05 β‐GP+Ad‐Sp1 vs β‐GP +Vehicle and VDN+Ad‐Sp1 vs VDN+Vehicle. Ad‐Sp1 indicates adenovirus harboring Sp1 knockdown gene; (ALP), alkaline phosphatase; BMP2, bone morphogenetic protein 2; CON, control; α‐ SMA, α‐smooth muscle actin; VDN, vitamin D3 and nicotine–induced calcification; VSMCs, vascular smooth muscle cells.
Either Sp1 Gene Silencing or Sp1 Inhibition Suppressed Apoptosis as Well as Matrix Vesicles Release
Increasing evidences indicate that matrix vesicles, the production of tunica media apoptotic degradation, were the initiating link or starting point of vascular calcification. To investigate the effect of Sp1 on apoptosis, we assessed the vascular apoptosis extent by terminal deoxynucleotidyl transferase‐mediated dUTP nick end labeling staining (Figure 6A). Sp1 gene silencing significantly reduced the percentage of terminal deoxynucleotidyl transferase‐mediated dUTP nick end labeling–positive VSMCs compared with the vehicle group. In addition, elevated expression levels of cleaved‐caspase‐3 and p53 were also decreased in the Sp1 gene‐silencing group as well (Figure 6B and 6C). We treated A7r5 cells with different doses of mithramycin for the second time to verify whether 100 nmol/L is suitable for inhibiting apoptosis. The results showed that mithramycin reduced the expression of cleaved‐caspase‐3 and p53 in a concentration‐dependent manner (Figure 6D and 6E). The effect of mithramycin on VSMCs apoptosis was similar to that at 100, 200, and 500 nmol/L, so we chose 100 nmol/L for further study.
Figure 6.
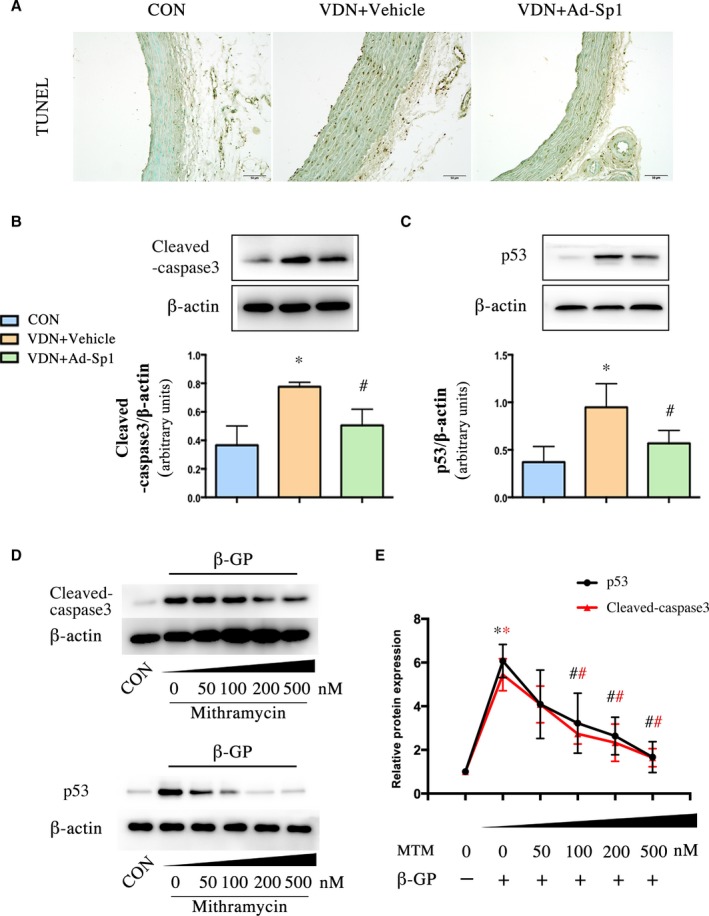
Sp1 gene silencing alleviated tunica media apoptosis during vascular calcification process. A, The apoptosis of aorta was determined by TUNEL staining (scale bar: 50 μm). B and C, Western blot analysis of cleaved‐caspase‐3 and p53 expression in aorta extracts. n=9 aortic sections from 3 rats in each group. VSMCs were treated with mithramycin at doses of 50, 100, 200, and 500 nmol/L in high phosphate medium. D and E, Western blot analysis of cleaved‐caspase‐3 and p53. Data are mean±SEM. n=5, *P<0.05 vs Control; # P<0.05 VDN+Ad‐Sp1 vs VDN+Vehicle and β‐GP+mithramycin vs β‐GP (Red: Cleaved‐caspase3, Black: p53). Ad‐Sp1 indicates adenovirus harboring Sp1 knockdown gene; β‐GP, β‐glycerophosphate; CON, control; MTM, mithramycin; TUNEL, terminal deoxynucleotidyl transferase‐mediated dUTP nick‐end labeling; VDN, vitamin D3 and nicotine induced calcification; VSMCs, vascular smooth muscle cells.
Further confirming whether Sp1 is involved in vascular calcification partly by regulating apoptosis and apoptosis‐degrading products, matrix vesicles, we detected the effects of Sp1 gene silencing or Sp1 inhibition by terminal deoxynucleotidyl transferase‐mediated dUTP nick end labeling staining (Figure 7A), Annexin V/propidium iodide double staining (Figure 7B and 7C), matrix vesicles release assay (Figure 7D), and caspase‐3 activity assay (Figure 7E and 7F) in vitro. Compared with the β‐GP group, Ad‐Sp1 or mithramycin treatment significantly inhibited apoptosis, as well as matrix vesicles release and caspase‐3 activity.
Figure 7.
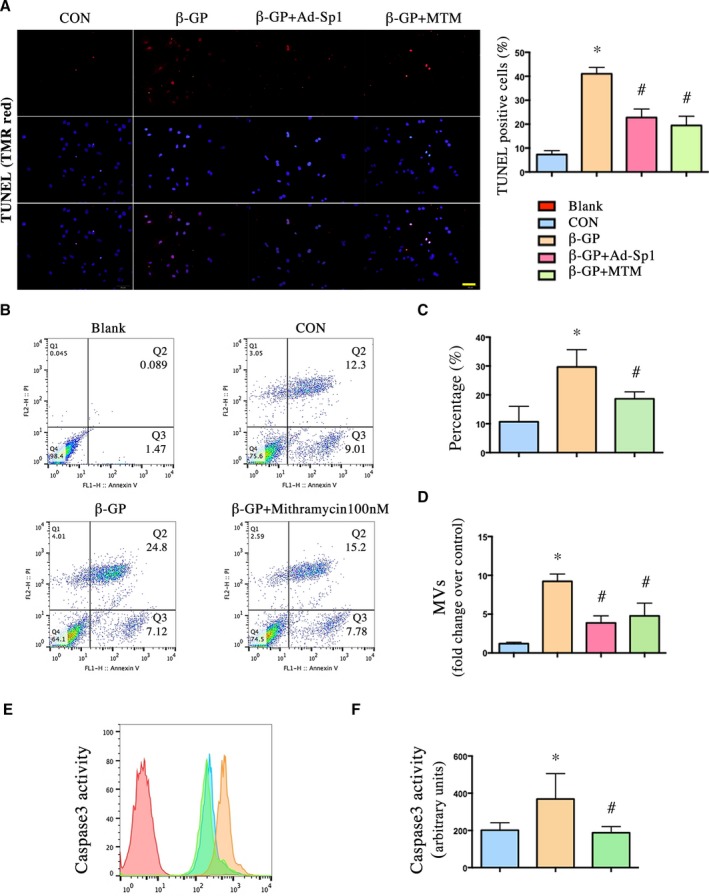
Silencing and inhibition of Sp1 reduced apoptosis in vitro as well as matrix vesicles release. VSMCs induced calcification by β‐GP were treated with Ad‐Sp1 or mithramycin for 3 days; MVs were isolated by centrifugation. The apoptosis rate was determined by (A) TUNEL staining and (B and C) Annexin V/propidium iodide double staining (scale bar: 50 μm). D, MV release was assessed by protein content. E and F, Caspase‐3 activity was assessed by caspase‐3 colorimetric assay. Data are mean±SEM. n=4, *P<0.05 vs Control; # P<0.05 β‐GP+Ad‐Sp1 or β‐GP+mithramycin vs β‐GP. Ad‐Sp1 indicates adenovirus harboring Sp1 knockdown gene; β‐GP, β‐glycerophosphate; CON, control; MTM, mithramycin; MVs, matrix vesicles; TUNEL, terminal deoxynucleotidyl transferase‐mediated dUTP nick‐end labeling; VSMCs, vascular smooth muscle cells.
Sp1 Binding Activity Was Crucially Involved in VSMCs Phenotypic Switching
To further understand the underlying mechanism by which Sp1 is involved in calcification, luciferase assay, ChIP assay, and electrophoretic mobility shift assay are used to clarify the Sp1 binding activity that is involved in VSMC phenotypic switching. Since the BMP2 promoter region contains a Sp1‐binding element as shown in Figure 8A, BMP2 is assumed to be a novel target of Sp1 in the calcifying process of VSMCs. The luciferase activity of both full‐length BMP2 promoter and part of BMP2 promoter containing Sp1‐binding element were elevated by β‐GP treatment as demonstrated by luciferase assay (Figure 8B and 8C). Previous study showed that deletion of 32 bp Not I fragment from the mouse BMP2 gene from −193 nt to −161 nt relative to the distal promoter containing the Sp1 site (Figure 8D) reduced the luciferase activity by half.20
Figure 8.
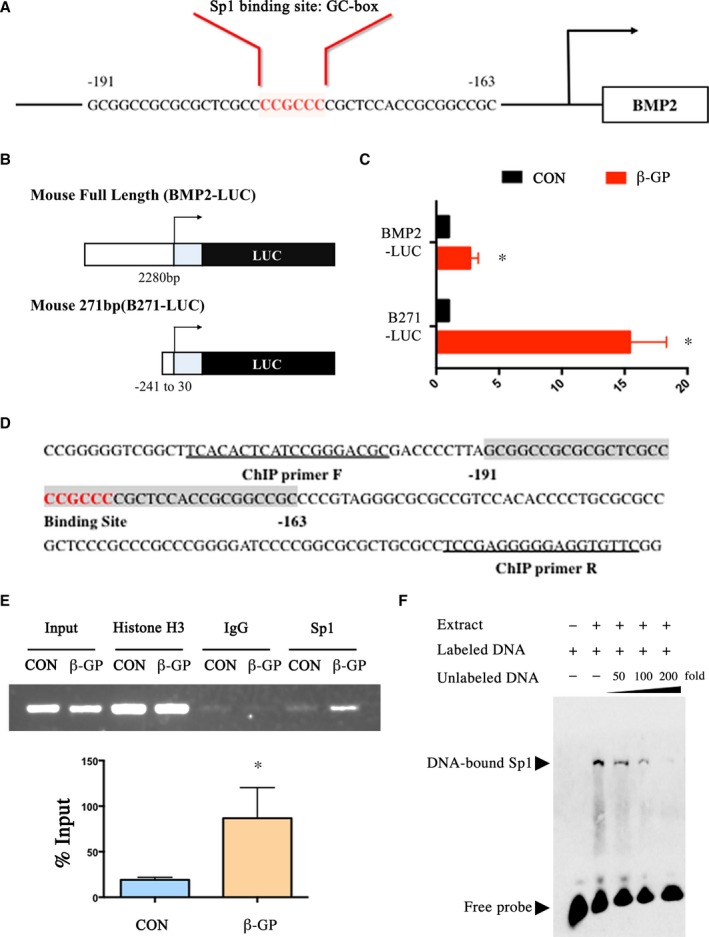
Sp1 binding activity was crucially involved in VSMCs phenotypic switching. A, The BMP2 promoter region contains an element for Sp1‐binding. B and C, The luciferase activity of full‐length BMP2 promoter and part of BMP2 promoter containing Sp1‐binding element were both elevated after the treatment of β‐GP. D, Part of BMP2 promoter sequence. Not I fragment from the BMP2 gene from −193 nt to −161 nt relative to the distal promoter is shaded. The Sp1‐binding site is shaded and highlighted in red. Sequences of ChIP primers are underlined. E, ChIP assay. Nuclear DNA–protein complexes were extracted from VSMCs treated with β‐GP for 3 days and precipitated with anti‐Sp1 antibody. PCR was performed to amplify the region of the BMP2 promoter containing Not I fragment. F, EMSA was performed with biotin‐labeled BMP2 oligonucleotides and nuclear extract from β‐GP‐treated VSMCs. Competition assays were performed with 50‐, 100‐, and 200‐fold molar excess of unlabeled BMP2 oligonucleotide. Data are mean±SEM. n=4, *P<0.05 vs Control. BMP2 indicates bone morphogenetic protein 2; β‐GP, β‐glycerophosphate; ChIP, chromatin immunoprecipitation assay; CON, control; EMSA, electrophoretic mobility shift assay; LUC, luciferase; PCR, polymerase chain reaction; Sp1, specific protein 1; VSMCs, vascular smooth muscle cells.
In addition, ChIP assays were performed to determine whether the BMP2 promoter is the direct target of Sp1 in VSMCs. As shown in the representative ChIP blot results in Figure 8E, the primers effectively amplified their target immunoprecipitation in the β‐GP group, indicating that β‐GP increased Sp1 DNA binding activity with BMP2 promoter. We next analyzed the binding specificity by electrophoretic mobility shift assay competition analyses using 50‐, 100‐, and 200‐fold molar excess of unlabeled BMP2 oligonucleotides. As expected, unlabeled BMP2 oligo competes effectively with biotin‐labeled probes (Figure 8F) and shows that the binding of Sp1 to BMP2 promoter is specific.
Discussion
Overall, the results of this study support the hypothesis that Sp1 plays an important role in vascular calcification. Sp1 gene silencing attenuates the vascular calcification observed in vitamin D3 and nicotine‐induced calcification in vivo and in vitro. In the meantime, mithramycin, a Sp1 inhibitor, prevents calcification observed in the β‐GP‐treated VSMCs. Apoptosis assay and Sp1 binding activity assay were used to further assess the potential mechanism by which Sp1 participates in calcification. Therefore, Sp1 is likely to be a potential target for the prevention or treatment of vascular calcification.
Sp1 is the founding member of the 26 member strong Sp/KLF family of transcription factors8 with a number of crucial roles in many pathophysiological processes, such as cell cycle, and cell migration.21, 22 Additionally, accumulating evidences have showed that Sp1 is important in regulating apoptosis, fibrosis, angiogenesis, and other pathologic disorders.11, 13, 14 Previous studies demonstrated that Sp1 is likely to be involved in tumor progression by regulating its target genes via binding to their GC‐rich promoter elements.23 Our previous findings proved that Sp1 binding activity was involved in the miR‐7a/b‐regulated PARP‐1 and caspase‐3 expression in hypoxia‐treated cardiomyocytes.24 However, the role of Sp1 in vascular calcification remains unclear. In our study, Sp1 was significantly elevated in both human and rat calcified aorta. Inhibition or gene silencing of Sp1 ameliorated calcium deposition, suppressed apoptosis as well as matrix vesicles release, and downregulated the expression of osteogenic‐profile markers both in vivo and in vitro, which was consistent with our hypothesis.
Growing evidence suggested that the potential mechanisms mediating calcification of VSMCs include osteogenic/chondrogenic conversion, apoptosis, MV release, and matrix remodeling.2, 3, 25 Woeckel et al reported that 1,25(OH)2D3 acted in the early phase of osteoblast differentiation to stimulate mineralization by increasing MV production.26 Furthermore, numerous studies confirmed that the tunica media apoptotic degradation product MVs were the initiating link of vascular calcification,6 which demonstrated that MVs played a pivotal role in the pathophysiological process of calcification. In the current experiments, the silencing or inhibition of Sp1 strongly downregulated apoptosis and MVs release, which furthermore protected the aorta from calcification. p53 is widely acknowledged to play a key role in apoptosis, including induction of apoptosis, cell‐cycle regulation, differentiation, gene amplification, DNA recombination, and cellular senescence.27 Meanwhile, in vivo, Sp1 silencing seemed to be effective in terms of reducing vascular apoptosis. Therefore, it could serve as an explanation of the protective role of Sp1 silencing or inhibition in regulating vascular calcification.
In view of the fact that Sp1 is a transcriptional factor, inhibition of Sp1 DNA binding activity by mithramycin treatment or gene silencing significantly reduced calcium deposition both in vivo and in vitro. We furthermore explored the possibility that Sp1 may directly stimulate the transcription of osteogenic‐profile protein to accelerate calcification. BMP2, which has been implicated in many pathological conditions including cancer, osteoarthritis, and birth defects, has been shown to play a key role in bone development, initiation and regulation of bone formation, and vascular calcification.28, 29 BMP2 may accelerate vascular calcification by increased phosphate uptake and inducing VSMCs phenotypes to convert into osteoblast‐like cells, which in turn phosphorylates the regulatory Smad1/5/8 and upregulates downstream key osteogenic transcription factors including Runx2 and Sp7 (osterix). In addition, upregulated Runx2 induces bone‐related matrix proteins, such as osteocalcin, type I collagen α1, and osteopontin.30, 31, 32, 33, 34 There is evidence that BMP2 is the target gene of Sp1 in the BMP2‐expressing F9 cell model system.18 Therefore, we analyzed the BMP2 sequence by using the Neural Network Promoter Prediction software to verify the binding site and found the Sp1 binding site, suggesting that Sp1 acts as a potential transcription factor for BMP2 activation. In our study, we found that the binding ability of Sp1 to BMP2 GC‐rich promoter elements has been enhanced in β‐GP‐treated cells, as demonstrated by luciferase assay and ChIP assay. Therefore, BMP2 is a functional target gene for Sp1 in calcified VSMCs. This result suggests another explanation of the protective role of Sp1 silencing or inhibition in regulating vascular calcification. In addition, it was found that Sp1 can directly bind to the downstream osteogenic gene promoter, such as type I collagen α124 and osteocalcin, with or without Sp7 synergistically promoting transcription.35 Canadillas et al reported that Sp1 interacted with its response element at the vitamin D receptor promoter to modulate vitamin D receptor expression by extracellular calcium.36 Recently, Sp1 DNA‐binding ability has been demonstrated to be regulated heavily by posttranslational modification in tumor and cell differentiation.37, 38 In the present study, we assessed the phosphorylation of Sp1 by means of Western blot, but there was no significant difference in the ratio of phosphorylated Sp1 to total Sp1 between the control group and the calcification group (data not shown). However, whether other posttranslational modifications regulate Sp1 activity during calcification remains to be determined.
Interestingly, it was noted that the anticancer effect of mithramycin was consistent with the results of our study by depleting Sp1 and activating p53 at low dose (20 nmol/L), but inhibiting p53 expression at high doses in tumor progression, which was consistent with our findings and our previous study reporting that the inhibition of Sp1 DNA binding activity by treatment with mithramycin significantly reduced expression of pro‐apoptotic genes.24, 39 It seems that the extent of Sp1 inhibition is crucial for the influence of p53 and apoptosis. With the unsolved problems associated with accurately identifying the precise effect of targeting Sp1 in alleviating vascular calcification, further investigations are necessary. In addition, there is growing evidence that Sp1 is involved in the effects on elastin degradation and collagen accumulation. We previously found that Sp1 mediates the antifibrotic effects of miR‐7a/b in angiotensin II–stimulated cardiac fibroblasts by targeting collagen I.24 Meanwhile, the MMP‐9 expression level was shown to be transcriptionally regulated by Sp1.40 MMP‐9 plays a crucial role in elastin degradation, which is highly pro‐calcific. Therefore, whether elevated Sp1 has other effects on vascular calcification, such as stimulating elastin degradation and collagen accumulation, via the regulation of a currently unknown pathway, remains to be determined.
It should be noted that we used a vitamin D3+ nicotine‐induced rat vascular calcification animal model in vivo to simulate aging, end‐stage renal disease, and patients with diabetes mellitus with vascular calcification. This animal model has long been established, but still has some limitations, in view of the fact that its mechanism may be different from that in human vascular calcification. Therefore, in future studies, these findings should be confirmed in different disease‐specific models. Additionally, the classical hypothesis holds that in response to injury, terminally differentiated VSMCs undergo a phenotypic switch, downregulating contractile proteins. VSMCs, which have been shown to be the origin of osteochondroblastic cells, were used to establish the in vitro calcification model. However, the pathophysiology of vascular calcification is a complex process involving multiple cell types, such as pericytes in microvessels and in tunica externa of large arteries, myocytes in tunica media, and myofibroblasts in adventitia.41 Li et al reported that calcification might arise from both the fibroblasts that were transformed into myofibroblasts and VSMCs.42 Kramann et al observed strong Gli1 expression in media calcification and atherosclerosis, suggesting that adventitial mesenchymal stem cell‐like (MSC‐like) cells are progenitors of VSMCs and drive vascular calcification in chronic kidney disease.43 Based on our findings, it is possible that the other vascular cells are vulnerable to the effect of Sp1 as well. Sp1 expression and effects on other vascular cells should be determined in future studies.
In conclusion, elevated Sp1 plays a pro‐apoptotic role and promotes BMP2 transcription, thereby accelerating vascular calcification. Because the clinical outcome of vascular calcification is determined by numerous mediators and signaling pathways, proper and timely modulation of Sp1 expression may be a novel and effective treatment for patients with vascular calcification.
Sources of Funding
This work was supported by the National Natural Science Foundation of China (81270403), Natural Science Foundation of Shandong Province (ZR201702200344). The funders had no role in the study design, data collection and analysis, decision to publish, or preparation of the article.
Disclosures
None.
Supporting information
Table S1. The Promoter Sequences Used in Luciferase Assays
(J Am Heart Assoc. 2018;7:e007555 DOI: 10.1161/JAHA.117.007555.)29572322
References
- 1. Abedin M, Tintut Y, Demer LL. Vascular calcification: mechanisms and clinical ramifications. Arterioscler Thromb Vasc Biol. 2004;24:1161–1170. [DOI] [PubMed] [Google Scholar]
- 2. Shanahan CM, Crouthamel MH, Kapustin A, Giachelli CM. Arterial calcification in chronic kidney disease: key roles for calcium and phosphate. Circ Res. 2011;109:697–711. [DOI] [PMC free article] [PubMed] [Google Scholar]
- 3. Dai XY, Zhao MM, Cai Y, Guan QC, Zhao Y, Guan Y, Kong W, Zhu WG, Xu MJ, Wang X. Phosphate‐induced autophagy counteracts vascular calcification by reducing matrix vesicle release. Kidney Int. 2013;83:1042–1051. [DOI] [PubMed] [Google Scholar]
- 4. Ciceri P, Volpi E, Brenna I, Arnaboldi L, Neri L, Brancaccio D, Cozzolino M. Combined effects of ascorbic acid and phosphate on rat VSMC osteoblastic differentiation. Nephrol Dial Transplant. 2012;27:122–127. [DOI] [PubMed] [Google Scholar]
- 5. Shao JS, Cai J, Towler DA. Molecular mechanisms of vascular calcification: lessons learned from the aorta. Arterioscler Thromb Vasc Biol. 2006;26:1423–1430. [DOI] [PubMed] [Google Scholar]
- 6. Chen NX, O'Neill KD, Chen X, Moe SM. Annexin‐mediated matrix vesicle calcification in vascular smooth muscle cells. J Bone Miner Res. 2008;23:1798–1805. [DOI] [PMC free article] [PubMed] [Google Scholar]
- 7. Shroff RC, McNair R, Figg N, Skepper JN, Schurgers L, Gupta A, Hiorns M, Donald AE, Deanfield J, Rees L, Shanahan CM. Dialysis accelerates medial vascular calcification in part by triggering smooth muscle cell apoptosis. Circulation. 2008;118:1748–1757. [DOI] [PubMed] [Google Scholar]
- 8. O'Connor L, Gilmour J, Bonifer C. The role of the ubiquitously expressed transcription factor Sp1 in tissue‐specific transcriptional regulation and in disease. Yale J Biol Med. 2016;89:513–525. [PMC free article] [PubMed] [Google Scholar]
- 9. Bajpai R, Nagaraju GP. Specificity protein 1: its role in colorectal cancer progression and metastasis. Crit Rev Oncol Hematol. 2017;113:1–7. [DOI] [PubMed] [Google Scholar]
- 10. Vizcaino C, Mansilla S, Portugal J. Sp1 transcription factor: a long‐standing target in cancer chemotherapy. Pharmacol Ther. 2015;152:111–124. [DOI] [PubMed] [Google Scholar]
- 11. Liu W, Wang G, Yakovlev AG. Identification and functional analysis of the rat caspase‐3 gene promoter. J Biol Chem. 2002;277:8273–8278. [DOI] [PubMed] [Google Scholar]
- 12. Kavurma MM, Santiago FS, Bonfoco E, Khachigian LM. Sp1 phosphorylation regulates apoptosis via extracellular FasL‐Fas engagement. J Biol Chem. 2001;276:4964–4971. [DOI] [PubMed] [Google Scholar]
- 13. Verrecchia F, Rossert J, Mauviel A. Blocking sp1 transcription factor broadly inhibits extracellular matrix gene expression in vitro and in vivo: implications for the treatment of tissue fibrosis. J Invest Dermatol. 2001;116:755–763. [DOI] [PubMed] [Google Scholar]
- 14. Haase M, Geyer P, Appold S, Schuh D, Kasper M, Muller M. Down‐regulation of SP1 DNA binding activity in the process of radiation‐induced pulmonary fibrosis. Int J Radiat Biol. 2000;76:487–492. [DOI] [PubMed] [Google Scholar]
- 15. Wei LH, Huang XR, Zhang Y, Li YQ, Chen HY, Heuchel R, Yan BP, Yu CM, Lan HY. Deficiency of Smad7 enhances cardiac remodeling induced by angiotensin II infusion in a mouse model of hypertension. PLoS One. 2013;8:e70195. [DOI] [PMC free article] [PubMed] [Google Scholar]
- 16. Niu Y, Mo D, Qin L, Wang C, Li A, Zhao X, Wang X, Xiao S, Wang Q, Xie Y, He Z, Cong P, Chen Y. Lipopolysaccharide‐induced miR‐1224 negatively regulates tumour necrosis factor‐alpha gene expression by modulating Sp1. Immunology. 2011;133:8–20. [DOI] [PMC free article] [PubMed] [Google Scholar]
- 17. Xu Q, Ji YS, Schmedtje JF Jr. Sp1 increases expression of cyclooxygenase‐2 in hypoxic vascular endothelium. Implications for the mechanisms of aortic aneurysm and heart failure. J Biol Chem. 2000;275:24583–24589. [DOI] [PubMed] [Google Scholar]
- 18. Xu J, Rogers MB. Modulation of bone morphogenetic protein (BMP) 2 gene expression by Sp1 transcription factors. Gene. 2007;392:221–229. [DOI] [PMC free article] [PubMed] [Google Scholar]
- 19. Zhang X, Xiao J, Li R, Qin X, Wang F, Mao Y, Liang W, Sheng X, Guo M, Song Y, Ji X. Metformin alleviates vascular calcification induced by vitamin D3 plus nicotine in rats via the AMPK pathway. Vascul Pharmacol. 2016;81:83–90. [DOI] [PubMed] [Google Scholar]
- 20. Abrams KL, Xu J, Nativelle‐Serpentini C, Dabirshahsahebi S, Rogers MB. An evolutionary and molecular analysis of Bmp2 expression. J Biol Chem. 2004;279:15916–15928. [DOI] [PubMed] [Google Scholar]
- 21. Beishline K, Azizkhan‐Clifford J. Sp1 and the ‘hallmarks of cancer’. FEBS J. 2015;282:224–258. [DOI] [PubMed] [Google Scholar]
- 22. Wang YT, Yang WB, Chang WC, Hung JJ. Interplay of posttranslational modifications in Sp1 mediates Sp1 stability during cell cycle progression. J Mol Biol. 2011;414:1–14. [DOI] [PubMed] [Google Scholar]
- 23. Chang WC, Hung JJ. Functional role of post‐translational modifications of Sp1 in tumorigenesis. J Biomed Sci. 2012;19:94. [DOI] [PMC free article] [PubMed] [Google Scholar]
- 24. Li R, Geng HH, Xiao J, Qin XT, Wang F, Xing JH, Xia YF, Mao Y, Liang JW, Ji XP. miR‐7a/b attenuates post‐myocardial infarction remodeling and protects H9c2 cardiomyoblast against hypoxia‐induced apoptosis involving Sp1 and PARP‐1. Sci Rep. 2016;6:29082. [DOI] [PMC free article] [PubMed] [Google Scholar]
- 25. Giachelli CM. The emerging role of phosphate in vascular calcification. Kidney Int. 2009;75:890–897. [DOI] [PMC free article] [PubMed] [Google Scholar]
- 26. Woeckel VJ, Alves RD, Swagemakers SM, Eijken M, Chiba H, van der Eerden BC, van Leeuwen JP. 1Alpha,25‐(OH)2D3 acts in the early phase of osteoblast differentiation to enhance mineralization via accelerated production of mature matrix vesicles. J Cell Physiol. 2010;225:593–600. [DOI] [PubMed] [Google Scholar]
- 27. Silva G, Marins M, Fachin AL, Lee SH, Baek SJ. Anti‐cancer activity of trans‐chalcone in osteosarcoma: involvement of Sp1 and p53. Mol Carcinog. 2016;55:1438–1448. [DOI] [PubMed] [Google Scholar]
- 28. Tsuji K, Bandyopadhyay A, Harfe BD, Cox K, Kakar S, Gerstenfeld L, Einhorn T, Tabin CJ, Rosen V. BMP2 activity, although dispensable for bone formation, is required for the initiation of fracture healing. Nat Genet. 2006;38:1424–1429. [DOI] [PubMed] [Google Scholar]
- 29. Sun M, Chang Q, Xin M, Wang Q, Li H, Qian J. Endogenous bone morphogenetic protein 2 plays a role in vascular smooth muscle cell calcification induced by interleukin 6 in vitro. Int J Immunopathol Pharmacol. 2017;30:227–237. [DOI] [PMC free article] [PubMed] [Google Scholar]
- 30. Iyemere VP, Proudfoot D, Weissberg PL, Shanahan CM. Vascular smooth muscle cell phenotypic plasticity and the regulation of vascular calcification. J Intern Med. 2006;260:192–210. [DOI] [PubMed] [Google Scholar]
- 31. Kim JH, Choi YK, Do JY, Choi YK, Ha CM, Lee SJ, Jeon JH, Lee WK, Choi HS, Park KG, Lee IK. Estrogen‐related receptor gamma plays a key role in vascular calcification through the upregulation of BMP2 expression. Arterioscler Thromb Vasc Biol. 2015;35:2384–2390. [DOI] [PubMed] [Google Scholar]
- 32. Tyson KL, Reynolds JL, McNair R, Zhang Q, Weissberg PL, Shanahan CM. Osteo/chondrocytic transcription factors and their target genes exhibit distinct patterns of expression in human arterial calcification. Arterioscler Thromb Vasc Biol. 2003;23:489–494. [DOI] [PubMed] [Google Scholar]
- 33. Zhu D, Mackenzie NC, Millan JL, Farquharson C, MacRae VE. The appearance and modulation of osteocyte marker expression during calcification of vascular smooth muscle cells. PLoS One. 2011;6:e19595. [DOI] [PMC free article] [PubMed] [Google Scholar]
- 34. Kim JY, Cheon YH, Kwak SC, Baek JM, Yoon KH, Lee MS, Oh J. Emodin regulates bone remodeling by inhibiting osteoclastogenesis and stimulating osteoblast formation. J Bone Miner Res. 2014;29:1541–1553. [DOI] [PubMed] [Google Scholar]
- 35. Niger C, Lima F, Yoo DJ, Gupta RR, Buo AM, Hebert C, Stains JP. The transcriptional activity of osterix requires the recruitment of Sp1 to the osteocalcin proximal promoter. Bone. 2011;49:683–692. [DOI] [PMC free article] [PubMed] [Google Scholar]
- 36. Canadillas S, Canalejo R, Rodriguez‐Ortiz ME, Martinez‐Moreno JM, Estepa JC, Zafra R, Perez J, Munoz‐Castaneda JR, Canalejo A, Rodriguez M, Almaden Y. Upregulation of parathyroid VDR expression by extracellular calcium is mediated by ERK1/2‐MAPK signaling pathway. Am J Physiol Renal Physiol. 2010;298:F1197–F1204. [DOI] [PubMed] [Google Scholar]
- 37. Chuang JY, Wang SA, Yang WB, Yang HC, Hung CY, Su TP, Chang WC, Hung JJ. Sp1 phosphorylation by cyclin‐dependent kinase 1/cyclin B1 represses its DNA‐binding activity during mitosis in cancer cells. Oncogene. 2012;31:4946–4959. [DOI] [PMC free article] [PubMed] [Google Scholar]
- 38. Gong L, Ji WK, Hu XH, Hu WF, Tang XC, Huang ZX, Li L, Liu M, Xiang SH, Wu E, Woodward Z, Liu YZ, Nguyen QD, Li DW. Sumoylation differentially regulates Sp1 to control cell differentiation. Proc Natl Acad Sci USA. 2014;111:5574–5579. [DOI] [PMC free article] [PubMed] [Google Scholar]
- 39. Ohgami T, Kato K, Kobayashi H, Sonoda K, Inoue T, Yamaguchi S, Yoneda T, Wake N. Low‐dose mithramycin exerts its anticancer effect via the p53 signaling pathway and synergizes with nutlin‐3 in gynecologic cancers. Cancer Sci. 2010;101:1387–1395. [DOI] [PMC free article] [PubMed] [Google Scholar]
- 40. Li Z, Guo Y, Jiang H, Zhang T, Jin C, Young CY, Yuan H. Differential regulation of MMPs by E2F1, Sp1 and NF‐kappa B controls the small cell lung cancer invasive phenotype. BMC Cancer. 2014;14:276. [DOI] [PMC free article] [PubMed] [Google Scholar]
- 41. Karwowski W, Naumnik B, Szczepanski M, Mysliwiec M. The mechanism of vascular calcification—a systematic review. Med Sci Monit. 2012;18:RA1–RA11. [DOI] [PMC free article] [PubMed] [Google Scholar]
- 42. Li N, Cheng W, Huang T, Yuan J, Wang X, Song M. Vascular adventitia calcification and its underlying mechanism. PLoS One. 2015;10:e0132506. [DOI] [PMC free article] [PubMed] [Google Scholar]
- 43. Kramann R, Goettsch C, Wongboonsin J, Iwata H, Schneider RK, Kuppe C, Kaesler N, Chang‐Panesso M, Machado FG, Gratwohl S, Madhurima K, Hutcheson JD, Jain S, Aikawa E, Humphreys BD. Adventitial MSC‐like cells are progenitors of vascular smooth muscle cells and drive vascular calcification in chronic kidney disease. Cell Stem Cell. 2016;19:628–642. [DOI] [PMC free article] [PubMed] [Google Scholar]
Associated Data
This section collects any data citations, data availability statements, or supplementary materials included in this article.
Supplementary Materials
Table S1. The Promoter Sequences Used in Luciferase Assays