

Abstract
Background
Prenatal hypoxia is suggested to be associated with increased risks of hypertension in offspring. This study tested whether prenatal hypoxia resulted in salt‐sensitive offspring and its related mechanisms of vascular ion channel remodeling.
Methods and Results
Pregnant rats were housed in a normoxic (21% O2) or hypoxic (10.5% O2) chamber from gestation days 5 to 21. A subset of male offspring received a high‐salt diet (8% NaCl) from 4 to 12 weeks after birth. Blood pressure was significantly increased only in the salt‐loading offspring exposed to prenatal hypoxia, not in the offspring that received regular diets and in control offspring provided with high‐salt diets. In mesenteric artery myocytes from the salt‐loading offspring with prenatal hypoxia, depolarized resting membrane potential was associated with decreased density of L‐type voltage‐gated Ca2+ (Cav1.2) and voltage‐gated K+ channel currents and decreased calcium sensitive to the large‐conductance Ca2+‐activated K+ channels. Protein expression of the L‐type voltage‐gated Ca2+ α1C subunit, large‐conductance calcium‐activated K+ channel (β1, not α subunits), and voltage‐gated K+ channel (KV2.1, not KV1.5 subunits) was also decreased in the arteries of salt‐loading offspring with prenatal hypoxia.
Conclusions
The results demonstrated that chronic prenatal hypoxia may program salt‐sensitive hypertension in male offspring, providing new information of ion channel remodeling in hypertensive myocytes. This information paves the way for early prevention and treatments of salt‐induced hypertension related to developmental problems in fetal origins.
Keywords: arterial, high salt, hypertension, ion channels, L‐type calcium channels, mesenteric artery, perinatal hypoxia, prenatal hypoxia, voltage‐gated potassium channels
Subject Categories: Hypertension, Electrophysiology
Clinical Perspective
What Is New?
This study demonstrated, for the first time, that chronic prenatal hypoxia is linked to salt‐sensitive hypertension in young offspring.
Downregulation of functional L‐type voltage‐gated Ca2+, large‐conductance calcium‐activated K+, and voltage‐gated K+ channels in association with resting membrane potential depolarization in mesenteric artery myocytes was critical in salt‐loaded offspring exposed to prenatal hypoxia.
What Are the Clinical Implications?
The data provide new information for early prevention of salt‐sensitive hypertension for those with history of prenatal hypoxia.
Potential targets for early treatments of salt‐sensitive hypertension may be linked to L‐type voltage‐gated Ca2+, large‐conductance calcium‐activated K+, and voltage‐gated K+ channels in artery myocytes.
Hypertension increases the probability of stroke, cardiovascular diseases, and renal failure and is the leading cause of death worldwide. It is well known that high dietary intake of salt plays a critical role in the pathogenesis of hypertension. Ingestion of large quantities of salt increases blood pressure (BP) in some individuals, whereas the BP‐raising effects of “salt loading” has little or no effects in others.1 The interindividual difference in BP responses to salt loading has been called salt sensitive and salt resistant, respectively. It has been estimated that 30% to 50% of hypertensive people and ≈25% of normotensive people are salt sensitive.2, 3 Consequently, it is important to identify potentially salt‐sensitive patients who will benefit from prevention of salt‐sensitive hypertension.
Substantial evidence has demonstrated that fetuses exposed to adverse intrauterine environments may be predisposed to developing cardiovascular diseases, including hypertension, in later life.4, 5 Although several previous studies have shown that male offspring rats exposed to environments such as placental insufficiency,6 maternal protein restriction,7 and maternal diabetes mellitus8 were susceptible to hypertension, the effects and mechanisms of prenatal hypoxia on the development of salt‐sensitive hypertension are largely unknown. Notably, hypoxia in utero is a common clinic complication that can be induced by preeclampsia,9 placental insufficiency,10 gestational diabetes mellitus,11 and maternal obesity.12 Other adverse conditions that induce chronic fetal hypoxia include high altitude,13 maternal smoking,14 and maternal respiratory disease.15
Vascular dysfunction with increased arterial tone is a critical cause of hypertension. Vascular tone in small arteries and arterioles plays an important role in BP and depends on the contractile status of vascular smooth muscle cells (VSMCs). Mesenteric arteries are typical systemic arteries that regulate peripheral resistance.16 Several reports have demonstrated that prenatal hypoxia was associated with long‐term alterations in mesenteric artery functions, characterized by enhanced myogenic tone,17 reduced nitric oxide–mediated vasodilation,18 and increased arterial wall stiffness.19 Furthermore, K+ channels (eg, large‐conductance calcium‐activated K+ [BK] and voltage‐gated K+ [KV] channels) are important in regulating membrane potential (Em), and inhibition of those channels in VSMCs leads to Em depolarization and enhanced Ca2+ influx via L‐type voltage‐gated Ca2+ (Cav1.2) channels and VSMC contractility. Those channels have attracted considerable attention in the study of hypertension.20 Whether and how those channels may be involved in mesenteric artery dysfunctions in offspring exposed to chronic prenatal hypoxia and postnatal high salt is still unknown. This is worthy of investigation that may provide better understanding of the mechanisms of vascular dysfunction caused by prenatal hypoxia and postnatal high salt intake that induce salt‐sensitive hypertension in offspring.
Using a rat model of gestational hypoxia from early pregnancy, this study assessed the effects of chronic prenatal hypoxia on electrophysiological properties of Cav1.2, BK, and KV channels in mesenteric artery smooth muscle cells (MASMCs) from adult male offspring, testing whether postnatal high dietary salt intake could exacerbate dysfunction in ion channels. We hypothesized that the offspring exposed to prenatal hypoxia could be salt sensitive and exhibit impaired Cav1.2, BK, and KV channels of MASMCs, especially following high postnatal salt consumption. The new information gained would provide a novel perspective for early prevention and treatments of salt‐sensitive hypertension.
Methods
The data, analytic methods, and study materials will be made available to other researchers for purposes of reproducing the results. Material will be available from the Institute for Fetology, First Hospital of Soochow University, which is responsible for maintaining availability. All experimental procedures were approved by the Institutional Animal Care and Use Committee of Soochow University and performed in accordance with the National Institutes of Health guidelines (NIH Publication No. 85‐23, revised 1996).
Maternal Hypoxia and Postnatal Diet Treatment
Sprague‐Dawley rats were obtained at 4 to 5 months of age (Su Pusi Biotech., Suzhou, China) and acclimated for 1 week before mating. Throughout pregnancy, rats were provided with standard rat chow and tap water and housed in room with a 12‐hour light/dark cycle and an ambient temperature of 23°C. The presence of a vaginal plug was defined as gestational day (GD) 0 following mating. On GD 5, pregnant rats were randomized to either the normoxia control group (n=12) or the hypoxia group (n=12) and housed, respectively, in control or hypoxic chambers continuously flushed with nitrogen gas to maintain an oxygen concentration of 10.5%. Rats were removed from chambers and allowed to give birth at GD 21. The litter sizes and birth weights of pups were recorded within 8 hours after delivery. Litters were reduced to 8 male pups at birth.18 After weaning (4 weeks), male offspring from each group (control, n=24; hypoxia, n=24) were randomly provided either normal‐salt diets containing 1% NaCl or high‐salt diets (HS diets) containing 8% NaCl. Then, 4 groups were created: control offspring receiving a normal‐salt diet (CNS; n=12 from 12 litters), control offspring receiving an HS diet (CHS; n=12 from 12 litters), hypoxia offspring receiving a normal‐salt diet (HNS; n=12 from 12 litters), and hypoxia offspring receiving an HS diet (HHS; n=12 from 12 litters). The offspring were given the respective diets for 8 weeks before testing at 12 weeks of age.
BP Measurement
Male offspring at 12 weeks of age were used for in vivo measurement of BP, as described.21 Briefly, the offspring were anesthetized with sodium phenobarbital (50 mg/kg IP), and a silicone catheter was implanted into the femoral artery. Following 2 days of recovery from surgery (n=11 per group), BP and heart rate were measured continuously in conscious and unrestrained rats using the Power‐Lab system and software (AD Instruments).
Serum Electrolytes, Hematocrit, and Osmolality
Offspring blood samples were collected from the main abdominal artery at euthanization. Plasma electrolyte and hematocrit concentrations were measured using the GEM Premier 3000. Blood samples were centrifuged at 1240 g for 10 minutes, and plasma osmolality was measured using the Fiske Model 210 Micro‐Osmometer.
Electrophysiology
Arterial myocytes were enzymatically dissociated from third‐order mesenteric arteries, as described previously.20 Only relaxed and spindle‐shaped myocytes were used for patch‐clamp testing. Single and whole‐cell currents were recorded using a Multiclamp 700B patch‐clamp amplifier (Molecular Devices) with Clampex 10.1 software (Axon Instruments) and digitized with a Digidata 1440A interface sampled at 10 kHz and filtered at 2 kHz (−3 dB, 8‐pole Bessel filter). All patch‐clamp recording was performed at 23°C. Borosilicate glass electrodes were pulled with a horizontal pipette puller (P‐97; Sutter Instrument). For conventional whole‐cell patch‐clamp experiments, leak and capacitative transient currents were subtracted using a P/−4 protocol. Cell capacitance was measured using a 5‐mV test pulse and correcting transients with series resistance compensation. Patch‐clamp data were analyzed using Clampfit 10.1 software. Whole‐cell current densities (picoampere per picofarad) were obtained for each cell by normalization of whole‐cell current to cell capacitance.
Whole‐cell CaV1.2 currents were recorded in isolated myocytes using a conventional whole‐cell patch‐clamp configuration. Borosilicate glass electrodes (3–5 MΩ) were filled with internal solution containing (in mmol/L) CsCl 130, HEPES 10, MgCl2 1.5, EGTA 10, Na2ATP 3, Na2GTP 0.1, MgATP 0.5, and glucose 10 (pH 7.2, adjusted using CsOH). The extracellular bath solution contained (in mmol/L) choline chloride 124, BaCl2 20, HEPES 10, MgCl2 1, and glucose 5 (pH 7.4 with TENOH [tetraethylammonium hydroxide]). To record whole‐cell CaV1.2 channel currents, 300‐ms voltage pulses between −60 and +60 mV were elicited in 10‐mV increments (10‐second intervals) from a holding potential of −80 mV. Inward current–voltage relationships were obtained from the peak current during the 300‐ms pulses. Voltage‐dependent activation was obtained as G/Gmax=IBa/[GBa(V−Erev)], where V is the step voltage, GBa is the maximal conductance determined from the linear regression of the positive limb of the inward current–voltage relationships through the apparent reversal potential (Erev), and IBa is the peak inward Ba2+ current at the corresponding command potential. Activation data were fit with the Boltzmann function, 1/{1+exp[(Vh−V)/k]}, where Vh is the voltage producing half‐maximal activation and k is the slope factor. Voltage‐dependent inactivation was measured using 1‐second conditioning pulses between −70 and +60 mV in 10‐mV increments (10‐second intervals) before a 200‐ms stimulating pulse to 0 mV. The rate of current inactivation was calculated from the current decay during each 1‐second conditioning pulse, and steady‐state voltage inactivation was measured from the current generated during the 200‐ms stimuli pulse to 0 mV. Voltage‐dependent inactivation curves were fit with the Boltzmann equation: I/Imax=Rin+(Rmax−Rin)/[1+exp(V−Vh)/k], where I/Imax is the relative peak current, V is the conditioning prepulse voltage, Vh is the voltage for half‐maximal inactivation, k is the slope factor, Rmax is the maximal inward current amplitude, and Rin is the proportion of noninactivating current. Current inactivation kinetics data were fit to a single exponential equation: It=(A×e(−t/τ))+I0, where A is the inward current amplitude, It is the current at time t, and I0 is the residual current.
Conventional whole‐cell mode was used to record whole‐cell KV channel currents (IKv) and resting Em. Myocytes were continuously superfused with a nominally Ca2+‐free Tyrode solution containing (in mmol/L) NaCl 140, KCl 5.4, MgCl2 1.2, glucose 5, and HEPES 10 (adjusted to pH 7.4 with NaOH). The patch pipettes (3–5 MΩ) were filled with a solution of (in mmol/L) KCl 140, MgCl2 1, Na2ATP 2, EGTA 10, and HEPES 10 (adjusted to pH 7.2 with KOH). Cells were held at −80 mV, and whole‐cell IKv were elicited by voltage steps from −70 to +70 mV by stepwise 10‐mV depolarizing pulses (400‐ms duration, 10‐second intervals) followed with a step to −40 mV for 200 ms. Recording was performed in the presence of 100 nmol/L BK channel blocker iberiotoxin. Resting membrane potentials were measured with a current clamp (i=0 picoamperes) in the whole‐cell mode using conventional whole‐cell patches.
Single BK channel current was recorded from inside‐out patches under symmetrical K+ (145 mmol/L) conditions. Borosilicate glass electrodes (13–15 MΩ) were filled with pipette solution containing (in mmol/L) KCl 145, EGTA 1, glucose 5, and HEPES 10 (pH 7.2 adjusted using KOH). Extracellular bath solution contained (in mmol/L) KCl 145, EGTA 1, glucose 5, and HEPES 10 (pH 7.4). CaCl2 was added to achieve the desired free‐Ca2+ concentrations in the bath solution, as determined using WinMAXC software (Chris Patton, Stanford University; http://maxchelator.stanford.edu/webmaxc/webmaxcS.htm). Only recordings with stable open probability (Po) values for a minimum of 2 minutes were analyzed. BK channel number, Po, and conductance were determined from all‐point amplitude histograms. The number of BK channels per patch was determined under conditions of maximal channel Po (at +80 mV and in the presence of 10 μmol/L free intracellular Ca2+).22
Western Blotting
Small mesenteric arteries were homogenized in tissue lysis buffer solution containing (in mmol/L) Tris‐HCI buffer 50, EDTA 0.1, EGTA 0.1 (pH 7.5), 1% wt/vol Na deoxycholic acid, 1% vol/vol NP‐40, and 0.1% vol/vol SDS, with a cocktail of protease inhibitors, followed by sonication (20 minutes at 4°C). Tissue debris and nuclear fragments were removed by centrifugation at 13800 g (30 minutes, 4°C), and whole tissue lysates were obtained as the supernatant. The protein concentration was measured using the Bradford protein assay. An equal amount of protein (40 μg) was loaded for each tissue lysate. Proteins were subjected to gel electrophoresis under reducing conditions on a 7% to 12% polyacrylamide gel (7% for α1C, 10% for BK α and KV1.5/2.1, and 12% for BK β1) and then electrophoretically transferred to a polyvinylidene fluoride membrane (Immobilon‐P; Millipore). Membranes were then blocked with 5% nonfat milk prepared in Tris‐buffered saline containing 0.1% Tween‐20 (1 hour, room temperature) and incubated overnight at 4°C with subunit‐specific primary antibodies reconstituted in 5% milk. Specific polyclonal antibodies raised against α1C (1:200), BK α (1:500), BK β1 (1:500), KV2.1 (1:500), and KV1.5 (1:500) or monoclonal antibody against β‐actin (1:5000) were used. Membranes were then incubated for 1 hour at room temperature with horseradish peroxidase–labeled antirabbit (1:5000), antigoat (1:5000), and goat antimouse (1:5000) in Tris‐buffered saline containing 0.1% Tween‐20 containing 5% nonfat dried milk. Membranes were then washed with Tris‐buffered saline containing 0.1% Tween‐20 (3 times, 10 minutes per rinse), The immunoreactive bands were identified by enhanced chemiluminescence, and signals were recorded with an EC3 Imaging System (UVP). Densitometry for immunoreactive bands was performed with Quantity One software (Bio‐Rad). β‐actin was used as input control for normalization. Density was expressed as a percentage of CNS.
Statistical Analyses
Data are expressed as the mean±SEM. Comparisons between groups were analyzed with an unpaired t test, 1‐way ANOVA followed by a Turkey post hoc test, or 2‐way ANOVA followed by a Bonferroni post hoc test for multiple group comparisons, as appropriate (for some patch‐clamp data analysis). GraphPad Prism 5.0 software or Origin 8.0 software (OriginLab) was used. P<0.05 was considered statistically significant.
Results
Body Weight
The birth weight of hypoxia‐exposed rats (5.72±0.11 g) was significantly reduced (P<0.001) compared with control (6.31±0.08 g) at birth (Figure 1A). At 12 weeks old, the body weight was not significantly different in CNS (379.1±7.94 g), HNS (375.3±8.35 g), CHS (382.0±9.01 g), and HHS (371.4±7.96 g) rats (n=8 per group; Figure 1B).
Figure 1.
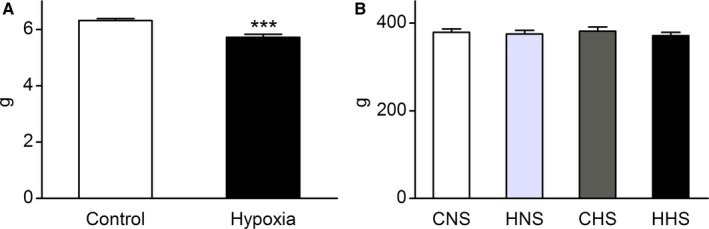
Body weight. A, Birth weight (n=12 per group). B, Body weight of male offspring rats at 12 weeks old. Data are expressed as mean±SEM, ***P<0.001 vs control. CHS indicates control offspring receiving a high‐salt diet; CNS, control offspring receiving a normal‐salt diet; HHS, hypoxia offspring receiving a high‐salt diet; HNS, hypoxia offspring receiving a normal‐salt diet.
Blood Pressure
After 8 weeks of normal‐ or high‐salt feeding, heart rate did not differ between the hypoxia and control groups. Systolic BP, diastolic BP, and pulse pressure were similar among CNS, HNS, and CHS rats (Table 1). However, systolic BP, diastolic BP, and pulse pressure were higher in HHS offspring than that in CNS, HNS, and CHS offspring (Table 1).
Table 1.
Blood Pressure, Heart Rate, Plasma Composition, and Osmolality in of Control and Hypoxia‐Exposed 12‐Week‐Old Male Offspring on Normal‐ and High‐Salt Diets
| Parameter | CNS | HNS | CHS | HHS |
|---|---|---|---|---|
| SBP, mm Hg | 135.1±1.3 (10)b | 131.3±2.6 (10)b | 134.7±2.2 (11)b | 164.1±2.8 (11) |
| DBP, mm Hg | 89.6±1.7 (10)a | 91.3±2.2 (10)a | 89.6±2.1 (11)b | 102.3±2.5 (11) |
| PP, mm Hg | 45.4±2.3 (10)b | 40.1±1.6 (10)b | 45.2±1.0 (11)b | 61.7±2.0 (11) |
| HR, beats/min | 379.0±15.0 (10) | 381.0±19.0 (10) | 392.0±12.0 (11) | 402.0±13.0 (11) |
| Hematocrit (%) | 43.0±1.3 (7) | 42.0±1.1 (7) | 44.0±1.6 (7) | 43.0±1.2 (7) |
| Na+, mmol/L | 135.5±0.7 (7) | 137.2±0.6 (7) | 136.3±0.5 (7) | 135.7±0.8 (7) |
| K+, mmol/L | 4.1±0.2 (7) | 3.9±0.4 (7) | 3.8±0.2 (7) | 3.9±0.3 (7) |
| Osmolality, mOsm/kg | 299.3±2.3 (7) | 300.3±2.1 (7) | 301.4±4.1 (7) | 301.0±2.9 (7) |
The number of experimental animals in each group is shown in parentheses. Values were determined using 1‐way ANOVA followed by Turkey post hoc analysis and are shown as mean±SEM. CHS indicates control offspring receiving a high‐salt diet; CNS, control offspring receiving a normal‐salt diet; DBP, diastolic pressure; HHS, hypoxia offspring receiving a high‐salt diet; HNS, hypoxia offspring receiving a normal‐salt diet; HR, heart rate; PP, pulse pressure; SBP, systolic pressure.
P<0.01 vs HHS.
P<0.001 vs HHS.
Blood Values
Blood values are shown in Table 1. No significant differences were observed in serum electrolytes (Na+, K+), plasma osmolality, and hematocrit among the 4 groups after 8 weeks of feeding with either normal‐salt or HS diets.
Cav1.2 Channel Currents in Mesenteric Arterial Myocytes
Conventional whole‐cell patch‐clamping was used to examine the effect of prenatal hypoxia and HS diets on voltage‐dependent Cav1.2 channel currents in freshly dissociated mesenteric arterial myocytes. Rectangular pulses (300‐ms duration) of various command potentials were applied in the presence of 20 mmol/L Ba2+ as a charge carrier. Mean cell capacitance was the same among the 4 groups (CNS=15.69±0.38 pF, n=44 cells from 10 animals; HNS=15.87±0.29 pF, n=48 cells from 11 animals; CHS=15.78±0.77 pF, n=44 cells from 7 animals; HHS=16.44±0.39 pF, n=39 cells from 7 animals.). Figure 1E illustrates examples of the whole‐cell Ca2+ currents recorded in MA myocytes in the absence and presence of Bay K8644 or nifedipine. In Figure 1B, the density of the peak inward current was plotted against the corresponding command potential (inward current–voltage relationship of Cav1.2). The peak density of the baseline voltage‐dependent inward Ba2+ current was maximal at +20 mV in all 4 groups (Figure 2B). Bay K8644 (5 μmol/L) increased the peak inward Ba2+ current and negatively shifted the inward current–voltage relationship (peak Cav1.2 current densities shifted to 0 mV), whereas nifedipine (1 μmol/L) almost completely inhibited the inward currents. These results suggest that the recorded inward currents were Ba2+ currents through Cav1.2 channels. The Cav1.2 channel current densities at +20 mV were smaller in the HHS group than in other groups, whereas the current densities were similar among the CNS, CHS, and HNS groups at −60 to +60 mV (Figure 2B and Table 1). Although Bay K8644 increased the amplitude of the Cav1.2 currents evoked by depolarization in CNS, HNS, and CHS cells, it did not equalize the current amplitude in HHS cells at 0 mV (CNS=−25.85±1.99 pA/pF, n=11 cells from 8 animals; HNS=−28.36±2.33 pA/pF, n=8 cells from 8 animals; CHS=−28.86±2.93 pA/pF, n=16 cells from 7 animals; HHS=−16.17±2.43 pA/pF, n=8 cells from 7 animals; Figure 2A and 2B). Analysis of steady‐state activation and inactivation curves revealed no statistical differences in half‐maximal voltages and slope factors among the 4 groups (Figure 2C and 2D, Table 2). Cav1.2 current inactivation rates were the same in the 4 groups (Figure 2A and Figure 2E).
Figure 2.
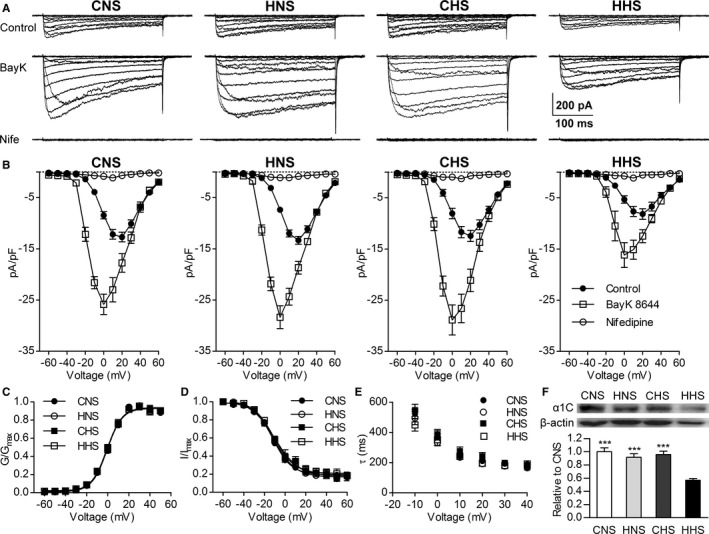
Whole‐cell L‐type voltage‐gated Ca2+ channel (Cav1.2) currents recorded in the myocytes of mesenteric arteries from the CNS, HNS, CHS, and HHS groups. A, Representative traces of Ca2+ channel currents evoked by command potentials (−60 to +60 mV in a 10‐mV step) in the absence (upper, control) or presence of Bay K8644 (center, BayK; 5 μmol/L) or nifedipine (lower, Nife; 1 μmol/L), 20 mmol/L Ba2+ as current carrier. B, Mean current density–voltage relationships of the Cav1.2 currents in the myocytes of the mesenteric arteries from the CNS, HNS, CHS, and HHS groups. Steady‐state voltage‐dependent activation (C) and inactivation (D) curves of the Ba2+ currents in mesenteric myocytes from the CNS, HNS, CHS, and HHS groups. E, The rate of Cav1.2 current inactivation (τ) was similar in CNS (n=24 cells from 10 animals), HNS (n=21 cells from 11 animals), CHS (n=16 cells from 7 animals), and HHS (n=12 cells from 7 animals) cells. F, Western blots of Cav1.2 channel (α1C) subunit (190 kDa) proteins in CNS, HNS, CHS, and HHS mesenteric arteries (n=6 animals per group). The bar plot shows the relative amount of α1C subunit protein in 4 groups. ***P<0.001 vs HHS. CHS indicates control offspring receiving a high‐salt diet; CNS, control offspring receiving a normal‐salt diet; HHS, hypoxia offspring receiving a high‐salt diet; HNS, hypoxia offspring receiving a normal‐salt diet; pA/pF, picoampere per picofarad; G/Gmax, the relative conductance; I/Imax, the normalized peak current.
Table 2.
Properties of Mesenteric Arterial Myocyte CaV1.2 Currents
| Variable | CNS | HNS | CHS | HHS |
|---|---|---|---|---|
| Inward current–voltage relationship | ||||
| Peak current density, pA/pF | −13.3±0.8 (30)a | −12.5±0.9 (31)a | −12.4±1.1 (20)a | −8.2±1.0 (20) |
| Voltage‐dependent activation | ||||
| Vh‐act, mV | −0.6±0.5 (22) | −0.5±0.5 (20) | −0.9±0.6 (22) | −1.0±0.6 (18) |
| Slope | 6.9±0.5 (22) | 7.2±0.4 (20) | 7.2±0.5 (22) | 7.2±0.5 (18) |
| Voltage‐dependent inactivation | ||||
| Vh‐inact, mV | −12.0±0.9 (24) | −11.3±1.1 (21) | −10.3±1.3 (16) | −10.9±1.3 (12) |
| Slope | −9.1±0.8 (24) | −10.5±1.0 (21) | −11.7±1.6 (16) | −9.9±1.2 (12) |
The number of patches from animals in each group are shown in parentheses (CNS, n=10; HNS, n=11; CHS, n=7; HHS, n=7). Using 1‐way ANOVA followed by a Turkey post hoc analysis. Data are mean±SEM. Cav1.2 indicates L‐type voltage‐gated Ca2+; CHS, control offspring receiving a high‐salt diet; CNS, control offspring receiving a normal‐salt diet; HHS, hypoxia offspring receiving a high‐salt diet; HNS, hypoxia offspring receiving a normal‐salt diet; pA/pF, picoampere per picofarad; Vh‐act, the voltage of half‐maximal activation; Vh‐inact, the voltage of half‐maximal inactivation.
P<0.001 vs HHS.
Figure 2F shows the presence of a 190‐kDa band in mesenteric arterial tissue from the 4 groups, corresponding to the pore‐forming α1C subunit of Cav1.2 channels. The bar plot shows that the expression of α1C‐subunit protein in HHS mesenteric arterial tissues was significantly decreased compared with the cells from other groups (Figure 2E).
Resting Em and Kv Channel Functional Expression in VSMCs
Resting Em is a primary determinant of vascular tone via regulation the activity of L‐type Ca2+ channels.23 Current clamp recording showed that resting Em was more depolarized in MASMCs of HHS relative to CNS, HNS, and CHS cells (n=10 in each group; Figure 3A.).
Figure 3.
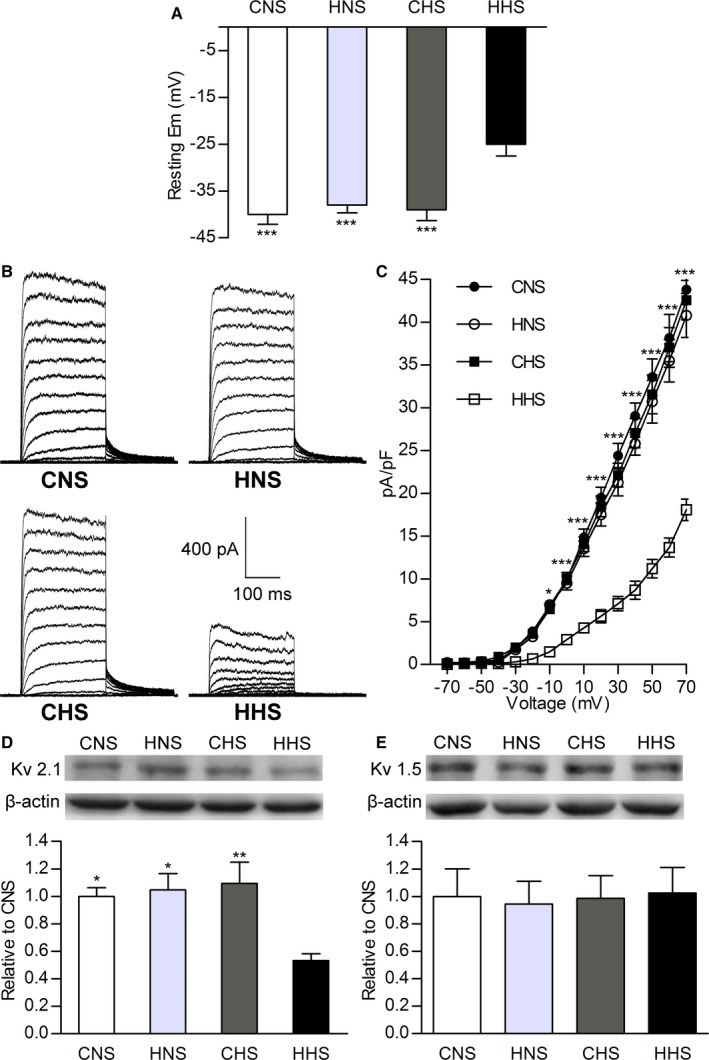
Resting membrane potential (Em) and whole‐cell KV channel current (IK v) recorded using conventional patch methods in mesenteric artery smooth muscle cells. A, Bar plots summarizing mean value of resting Em in CNS, HNS, CHS, and HHS cells. B, Representative IK v from CNS, HNS, CHS, and HHS cells. C, Current–voltage relationships of IK v in CNS, HNS, CHS, and HHS cells. Western blots of (D) KV2.1 (108 kDa) and (E) KV1.5 (76 kDa) channel proteins in CNS, HNS, CHS, and HHS mesenteric arteries. The bar plot shows the relative amount of KV channel protein in 4 groups (6 animals per group). *P<0.05, **P<0.01, and ***P<0.001 vs HHS. CHS indicates control offspring receiving a high‐salt diet; CNS, control offspring receiving a normal‐salt diet; HHS, hypoxia offspring receiving a high‐salt diet; HNS, hypoxia offspring receiving a normal‐salt diet; KV, voltage‐gated K+; pA/pF, picoampere per picofarad.
IKv is the major regulator of the resting Em in rat MASMCs.24, 25 We used conventional whole‐cell patch‐clamp recording to examine whether a reduced IKv contributed to the depolarized resting Em in HHS cells. Figure 3B shows 4 sets of representative IKv traces recorded from the myocytes isolated from CNS, HNS, CHS, and HHS offspring. IKv was smaller in HHS cells than in the other groups (n=10, P<0.05). Figure 3B shows the current–voltage relationship of IKv between those cells, as IKv values were smaller in HHS cells than in the others at the highest voltages tested (−10 to +70 mV; P<0.05). These data suggested that a reduction of IKv contributed to the depolarized resting Em in HHS cells.
Because IKv is thought to be produced by KV1.5 and KV2.1 channels, the predominant KV isoforms expressed in mesenteric artery myocytes in rats.26, 27 We used Western blot to examine KV1.5, or KV2.1 protein in mesenteric arterial tissues. In accordance with the reduction of IKv, analysis revealed downregulation in KV2.1 protein expression in HHS compared with CNS, HNS, and CHS offspring (n=6 per group, P<0.05; Figure 3C). No significant difference in KV1.5 protein expression was observed in mesenteric arterial tissues among the CNS, HNS, CHS, and HHS groups.
Properties of Single BK Channels and Expression in Mesenteric Arterial Myocytes
We compared the properties of single BK channels in MASMCs from the 4 groups using an inside‐out patch‐clamp methodology. Figure 3A shows representative traces of single BK channel currents in excised inside‐out membrane patches from MASMCs of CNS, HNS, CHS, and HHS offspring at −40 mV and in the presence of 2 physiologically relevant concentrations of intracellular free Ca2+ (3 and 10 μmol/L). The Po of BK channels at each Ca2+ concentration was lower in the MASMCs of HHS offspring (n=12 and n=8 patches for 3 and 10 μmol/L Ca2+, respectively) than in those of CNS offspring (n=8 patches for each Ca2+ concentration), HNS offspring (n=8 patches for each Ca2+ concentration), and CHS offspring (n=8 patches for each Ca2+ concentration; 7 animals per group; Figure 4A). Conversely, no differences in Po values in CNS, HNS, and CHS offspring were observed (P>0.05; Figure 4A). The mean open dwell times of BK channels in the cells from HHS offspring were decreased compared with CNS, HNS, and CHS cells (P>0.05, n=7 animals per group; Figure 4B). The number of BK channels per patch, an indication of the density of α subunits in the plasmalemma, was determined under conditions of maximal channel Po (at +80 mV and in the presence of 10 μmol/L free intracellular Ca2+). We found no difference in the average number of BK channels per patch in CNS (2.31±0.35 channels), HNS (2.08±0.31 channels), CHS (2.15±0.27 channels), and HHS (2.39±0.29 channels) myocytes (P>0.05, n=13 patches from 7 animals for each group; Figure 4D). Single‐channel slope conductance was also not altered in the cells from CNS, HNS, CHS, and HHS offspring (P>0.05, n=6 animals per group; Figure 4C).
Figure 4.
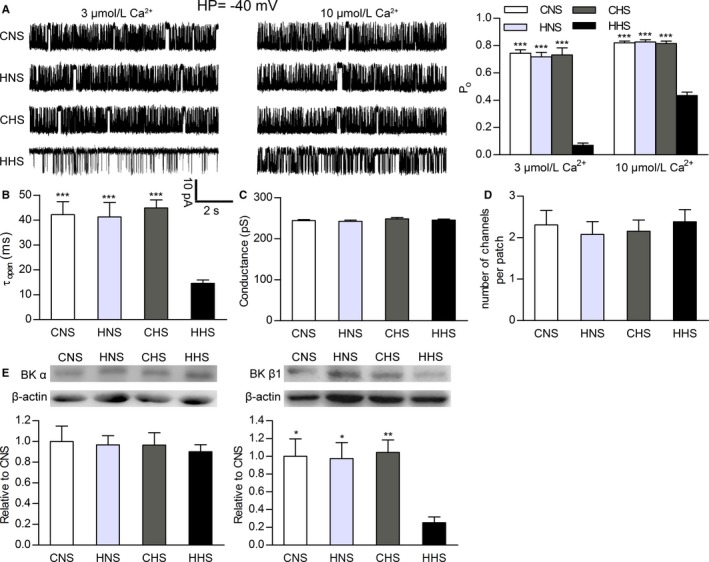
Ca2+ sensitivity of large‐conductance calcium‐activated K+ (BK) channels in mesenteric artery smooth muscle cells (MASMCs) from CNS, HNS, CHS, and HHS rats. Properties of single BK channels and protein expression indicate decreased β1‐subunit function in HHS MASMCs. A, Single‐channel recordings from inside‐out patches monitored at −40 mV in the presence of 3 and 10 μmol/L free Ca2+. The bar plot summarizes open probability (mean±SEM) of BK channels in CNS, HNS, CHS, and HHS cells at holding potential (HP) −40 mV and 2 Ca2+ concentrations (3 and 10 μmol/L). B, Dwell time of open state. Conductance (C) and average number of channels per patch (D) from CNS, HNS, CHS, and HHS cells. E, Western blots of BK channel α (125 kDa) and β1 (22 kDa) subunit proteins in CNS, HNS, CHS, and HHS mesenteric arteries (6 animals per group). The bar plot shows the relative amount of α and β1 subunit proteins in 4 groups. *P<0.05, **P<0.01, and ***P<0.001 vs HHS. CHS indicates control offspring receiving a high‐salt diet; CNS, control offspring receiving a normal‐salt diet; HHS, hypoxia offspring receiving a high‐salt diet; HNS, hypoxia offspring receiving a normal‐salt diet.
To identify whether changed molecular constitution of channels caused the functional alteration of BK channels in MASMCs of HHS offspring, we determined the protein expression of BK channel α and β1 subunits in mesenteric arteries from 4 groups, using Western blot analysis. Representative immunoblots, depicted using bar graphs (Figure 4E), show no significant differences in expression of the BK channel α‐subunit protein in small mesenteric arterial tissue among CNS, HNS, CHS, and HHS cells, whereas the expression of the BK channel β1 subunit was significantly reduced in HHS cells compared with other groups (n=6 animals per group).
Discussion
This study investigated influence of chronic hypoxia in pregnancy on BP and Cav1.2, BK, and KV channel functions in offspring and determined whether cardiovascular risks would be further increased if postnatal diets were unhealthy (eg, high‐salt food). The main findings are as follows: (1) Prenatal hypoxia not only significantly elevated BP in the young adult offspring with normal diets but also induced hypertension if postnatal HS diets were introduced; (2) whole‐cell Cav1.2 channel current density and protein expression were decreased in the MASMCs of HHS offspring, not in the other 3 groups; (3) the resting Em was more depolarized in the MASMCs from HHS offspring, probably because of a decrease in KV channel conductance; (4) the Ca2+ sensitivity of BK channels was attenuated in the MASMCs of HHS offspring with reduced expression of BK channel β1 subunits. Those novel results suggest that prenatal insults plus postnatal unhealthy diet produce higher cardiovascular risks in offspring. The possible underlying mechanisms may include electrophysiological remodeling of Cav1.2, BK, and KV channels in the smooth muscle cells of mesenteric arteries.
This study demonstrated that the resting BP was not significantly changed in prenatal normoxia and hypoxia offspring with postnatal normal diets at 12 weeks of age. The prenatal normoxia offspring fed with HS diets also did not show significantly increased BP, consistent with previous reports.6, 28 In contrast, prenatal hypoxia plus HS diets for 8 weeks from weaning significantly increased BP at 12 weeks old. A previous study reported that postnatal HS diets did not alter BP in the mouse offspring exposed to prenatal hypoxia during late gestation.19 The other studies demonstrated that salt loading (8% NaCl) in the male offspring rats that were exposed to adverse in utero conditions (uteroplacental dysfunction and gestational diabetes mellitus) induced hypertension in the offspring.6, 8, 10, 11 Our results supported the notion that the offspring that suffered from chronic hypoxia in utero had a salt‐sensitive phenotype in the development of hypertension if an HS diet was introduced after birth. This piece of new information may lead to early prevention of hypertension by reducing daily salt consumption for those children and young adults with a history of prenatal hypoxia.
To determine underlying mechanisms, a series of experiments were conducted. Given that abnormalities of salt loading expanded plasma volume, contributing to the pathogenesis of salt‐sensitive hypertension,29, 30 we tested serum concentrations of sodium and potassium, plasma osmolality, and plasma volume reflected by hematocrit. There were no significant differences among the 4 groups, suggesting that the observed cardiovascular changes in the present study were not linked mainly to vascular volume factors. Another possible mechanism to account for why salt‐sensitive hypertension occurred in chronic prenatal hypoxia offspring was anomalous peripheral vascular resistance.31, 32 A hallmark in hypertension is an exaggerated constriction of small arteries and arterioles mediated by Ca2+ influx through Cav1.2 channels. Because Cav1.2 channels play a key role in maintaining vascular myogenic tone and BP,33 Cav1.2 channel dysfunction may result in abnormal myogenic tone and altered BP. In the present study, chronic prenatal hypoxia plus normal postnatal diets did not cause significant changes in Cav1.2 current density and protein expression in MASMCs of the offspring. An interesting finding was that whole‐cell Cav1.2 current density was decreased in the myocytes of HHS offspring only, not other groups. The decreased Cav1.2 currents could arise from poor expression of functional channels as well as reduced Po and/or conductance of single CaV1.2 channels. Although we did not record single CaV1.2 channel currents, the similarities in voltage dependence activation and inactivation and inactivation kinetics indicated that the reduced Cav1.2 current density was most likely related to decreased Cav1.2 channel number density rather than its voltage sensitivity. Consistent with the electrophysiological results, the reduced protein expression of pore‐forming α1C subunits of Cav1.2 channels in the HHS mesenteric arterial tissues supported the view that the decreased expression of functional channels may result in reduced Cav1.2 currents in hypertensive HHS cells. An early study reported increased Cav1.2 channel availability and the same peak current density in the mesenteric arterial myocytes of Dahl genetic rats with salt‐sensitive hypertension after dietary salt loading.34 Thus, downregulation of vascular Cav1.2 channel α1C subunits may be a common characteristic of salt‐sensitive hypertension.
Much evidence demonstrated that increased expression of Cav1.2 α1C subunit protein corresponded to higher density of Cav1.2 channel currents in mesenteric artery myocytes from spontaneously hypertensive rats at young adult age.20, 35, 36 It is important to note, however, that elevated Cav1.2 channel currents and protein expression are not consistently found with high BP in all hypertension stages and animal models of hypertension. Downregulation of Cav1.2 channel current density and expression, for example, was observed in mesenteric arteries from the aged spontaneously hypertensive rats and aged Wistar‐Kyoto rats characterized by mild hypertension.37 A lower level of Cav1.2 expression corresponding with increased Cav1.2 channel functions has been reported in spontaneously hypertensive rats.38 Furthermore, Tajada et al39 recently showed that a decrease in the global number of Cav1.2 currents coexisted with the existence of a subpopulation of highly active channels in myocytes from a mouse model of genetic hypertension. Our data suggest that increased Cav1.2 current density and protein expression is not required for the maintenance of the hypertensive phenotype.
We considered possibilities that chronic salt loading may cause the mesenteric arteries of the prenatal hypoxia offspring to be more sensitive to vascular functional changes associated with decreased Cav1.2 current density and protein expression. In support of this view, increased BP in HHS rats indicated possible vascular stiffing (a characteristic of vascular aging). If vascular stiffening exists in the hypertensive offspring, vascular smooth muscle cells may be changed into a synthetic phenotype characterized by increased migration, proliferation, and synthesis of extracellular matrix proteins.40 Notably, it is known that changes in VSMC phenotype from a contractile to a synthetic phenotype are associated with downregulation of Cav1.2 current and expression,41, 42, 43 as observed in the present study. However, more evidence should be obtained through further investigation.
Membrane potential of arterial myocytes, controlling the magnitude of steady‐state Ca2+ influx across the membrane through Cav1.2 channels, is a major determinant of vascular tone.44 The Em of arterial myocyte depolarization could thus increase activity of Cav1.2 channels. Although our data showed a decrease in densities of Cav1.2 channels, the more depolarized resting Em (the depolarized state) of the MASMCs from HHS rats conferred an increased Po. At the resting Em of −40 mV, −38 mV, and −39 mV in the myocytes of CNS, HNS, and CHS rats, respectively, there was little activation of Cav1.2 channels, with the result that extracellular Ca2+ influx through these channels was minimal. However, at an Em of −25 mV in the myocytes of HHS rats, Cav1.2 channels were more activated and did not show full inactivation (window current). Consequently, the MASMCs from HHS rats could have increased intracellular Ca2+ and thus enhanced vascular tone, resulting in elevated peripheral vascular resistance and BP.
KV current is the dominant regulator of resting Em in rat MASMCs, and Em was very sensitively regulated by the IKv.24, 25 Reduced IKv could lead to depolarized membrane potential. The present study found that the current density of KV channels was decreased in the MASMC of HHS rats. Other studies demonstrated decreased IKv in different models of hypertension, including deoxycorticosterone acetate–salt rats,45 a (Dahl) genetic model of salt‐sensitive hypertension,46 and angiotensin II–induced hypertension.47 Our finding suggested that downregulation of functional KV channels may contribute to the depolarized resting Em in the hypertensive myocytes.
KV1.5 and KV2.1 channel subunits make predominant contributions to density of IKv in rat mesenteric artery myocytes.26, 27 Thus, we tested which of the 2 major KV isoforms contributed to the suppressed IKv in HHS cells. Complementing the electrophysiological studies, Western blotting analysis showed reduced expression of KV2.1 subunits, but not KV1.5 subunits, in HHS offspring. Downregulation of KV2.1 channels has been shown as contributing to arterial dysfunction in angiotensin II–induced hypertension.47 Although this study could not determine whether other KV channel subunits, such as KV7.4, were involved, the new results should warrant further investigation.
BK channels usually do not determine the resting Em in mesenteric artery myocytes but serve as a negative feedback mechanism at considerable membrane depolarization.24, 25 Vascular BK channels are made up of pore‐forming α and accessory β1 subunits.48, 49 β1 subunits modulate BK channel functions by increasing open dwell time and intrinsic Ca2+ sensitivity of the α subunits.50, 51, 52 It is well known that activation of BK channels plays an important role in counteracting vascular cell depolarization and constriction via negative feedback by regulating Cav1.2 channel activity.53 If attenuated BK channel functions in HHS myocytes result in higher activity of Cav1.2 in the depolarization of resting Em state, more influx Ca2+ and increased vascular tone could result. In fact, single‐channel recording in the present study showed significantly decreased effectiveness of Ca2+ in activating BK channels at physiological Em. Moreover, the mean open dwell times of BK channels from hypertensive arteries were shorter than those from normotensive arteries, and the average number of channels per patch was unchanged among the 4 groups. These findings were consistent with those from the Western blot analysis showing that β1, not α, subunits were decreased in hypertensive HHS mesenteric arterial tissues. Taken together, the new data suggested that the downregulated expression of β1 subunits contributed to decreased Ca2+ sensitivity of BK channels in MASMCs of HHS rats. Although the nature of those changes, the decreased expression of the BK β1 subunits, and the unchanged α subunits would augment the disproportionately lower ratio of BK β1/α subunits in the development of hypertension. That lower ratio of BK β1/α subunits could thus decrease the Ca2+ sensitivity of BK channels in the hypertensive myocytes.
Based on these findings, a model for a mechanistic explanation of prenatal insults plus postnatal salt loading leading to salt‐sensitive hypertension was proposed (Figure 5). Briefly, downregulation of KV2.1 channels resulted in resting Em depolarization in the myocytes of salt‐loading offspring exposed to prenatal hypoxia. In addition, because of reduced β1 subunits of BK channels, BK channels became insensitive to high local Ca2+ produced by Ca2+ sparks, lowering activity of spontaneous transient outward currents and leading to a decreases in transient hyperpolarizations at a given membrane potential. Together, resting Em depolarization and decreased transient hyperpolarizations may cause inflow of more Ca2+ into cytosol through the fewer functional Cav1.2 channels in myocytes of salt‐loading offspring with prenatal hypoxia; this may result in increased vascular tone, contributing to the development of hypertension in salt‐loading offspring with prenatal hypoxia.
Figure 5.
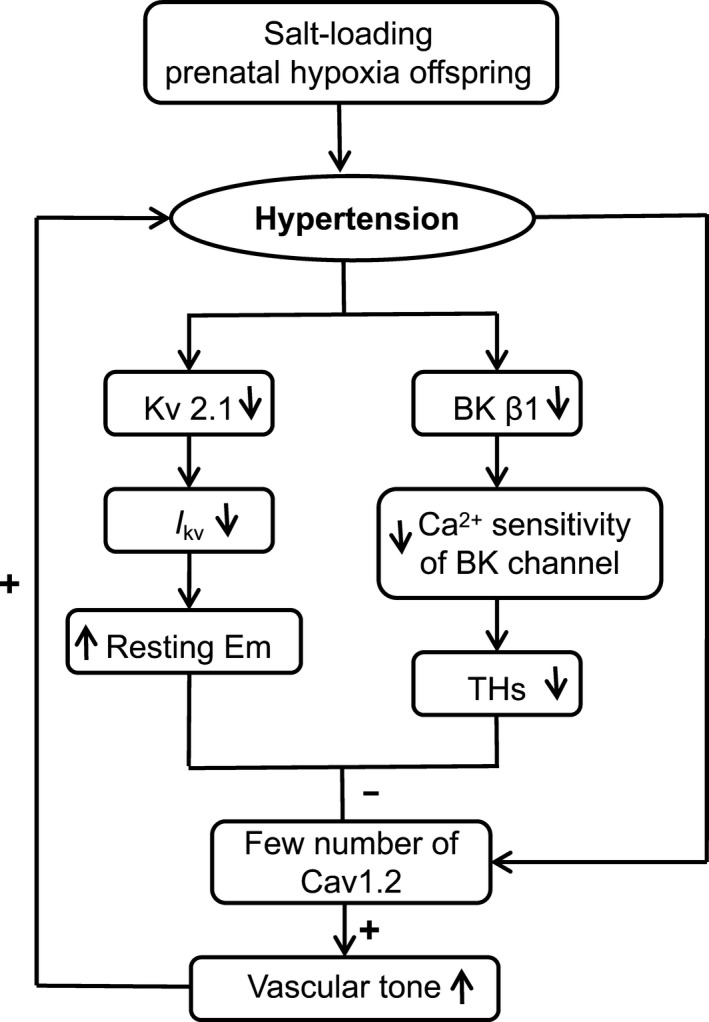
A model for a mechanistic explanation of chronic dietary salt loading increases the blood pressure in prenatal hypoxia rats. Although functional number of Cav1.2 channel expression in mesenteric arterial myocytes from salt‐loading and prenatal hypoxia offspring (HHS) was reduced, the depolarization of resting membrane potential (Em) and decreased of transient hyperpolarizations (THs) in HHS cells led to down‐regulated inhibition of Cav1.2 channels, resulting in increasing of resting vascular tone, leading to hypertension in salt‐loading offspring with prenatal hypoxia. BK, large‐conductance calcium‐activated K+; Cav1.2, L‐type voltage‐gated Ca2+; IKv, voltage‐gated K+ channel current; KV, voltage‐gated K+.
It should be acknowledged that the causal relationship between electrophysiological remodeling of vascular channels and development of salt‐sensitive hypertension cannot be concluded. The electrophysiological remodeling of vascular channels might be secondary to arterial pressure alterations. Further analysis of the time course of the changes in functional vascular channels and the elevated BP during the ingestion of HS diets would help determine whether the relationship between these 2 parameters is associative or causal.
Perspectives
In conclusion, we showed that young adult male offspring exposed to chronic gestational hypoxia acquired salt‐sensitive hypertension by chronic high salt intake. Based on the findings, we suggested that offspring who suffer from prenatal insults, such as preeclampsia, maternal smoking, and high altitudes, may tend toward a salt‐sensitive phenotype. Consequently, precautions should be taken to ensure that dietary sodium in early life periods of such offspring is not excessive, so as to limit the hypertensive phenotype. Furthermore, we demonstrated downregulation of functional expression of Cav1.2, BK, and KV channels in association with resting Em depolarization in chronic salt‐loading offspring with prenatal hypoxia. The results suggested that targeting reduced expression of Cav1.2 channels in VSMCs may not be a better strategy against hypertension.
Author Contributions
B. Liu, Shi, X. Li, Y. Liu, X. Lu and Xu designed research; B. Liu, R. Shi, and X. Li performed patch clamp experiments; Y. Liu, F.X., and Chen performed in vivo BP measurement experiment; B. Liu, X. Fan and Y. Zhang did Western blotting experiment; B. Liu, W. Zhang and Tang performed plasma electrolytes analysis. B. Liu, Shi, X. Li, Y. Liu, X. Lu and Xu wrote the article. All authors have reviewed the article and data.
Sources of Funding
This study was supported by the National Natural Science Foundation of China (81320108006); the Natural Science Foundation of Jiangsu Province (BK20140292); and the Jiangsu Provincial Key Discipline (Fetal medicine).
Disclosures
None.
(J Am Heart Assoc. 2018;7:e008148 DOI: 10.1161/JAHA.117.008148.)29545262
Contributor Information
Xiyuan Lu, Email: luxiyuan2017@suda.edu.cn.
Zhice Xu, Email: xuzhice@suda.edu.cn.
References
- 1. Ambard L, Beaujard E. Causes de l'hypertension arterielle. Arch Gen de Med. 1904;1:520–533. [Google Scholar]
- 2. Weinberger MH. Salt sensitivity of blood pressure in humans. Hypertension. 1996;27(pt 2):481–490. [DOI] [PubMed] [Google Scholar]
- 3. Kotchen TA, Cowley AW Jr, Frohlich ED. Salt in health and disease: a delicate balance. N Engl J Med. 2013;368:1229–1237. [DOI] [PubMed] [Google Scholar]
- 4. Barker DJ. In utero programming of cardiovascular disease. Theriogenology. 2000;53:555–574. [DOI] [PubMed] [Google Scholar]
- 5. Gluckman PD, Hanson MA, Cooper C, Thornburg KL. Effect of in utero and early‐life conditions on adult health and disease. N Engl J Med. 2008;359:61–73. [DOI] [PMC free article] [PubMed] [Google Scholar]
- 6. Payne JA, Alexander BT, Khalil RA. Decreased endothelium‐dependent NO‐cGMP vascular relaxation and hypertension in growth‐restricted rats on a high‐salt diet. Hypertension. 2004;43:420–427. [DOI] [PubMed] [Google Scholar]
- 7. Woods LL, Weeks DA, Rasch R. Programming of adult blood pressure by maternal protein restriction: role of nephrogenesis. Kidney Int. 2004;65:1339–1348. [DOI] [PubMed] [Google Scholar]
- 8. Nehiri T, Duong Van Huyen JP, Viltard M, Fassot C, Heudes D, Freund N, Deschênes G, Houillier P, Bruneval P, Lelièvre‐Pégorier M. Exposure to maternal diabetes induces salt‐sensitive hypertension and impairs renal function in adult rat offspring. Diabetes. 2008;57:2167–2175. [DOI] [PMC free article] [PubMed] [Google Scholar]
- 9. Kingdom JC, Kaufmann P. Oxygen and placental villous development: origins of fetal hypoxia. Placenta. 1997;18:613–621. [DOI] [PubMed] [Google Scholar]
- 10. Pardi G, Cetin I, Marconi AM, Lanfranchi A, Bozzetti P, Ferrazzi E, Buscaglia M, Battaglia FC. Diagnostic value of blood sampling in fetuses with growth retardation. N Engl J Med. 1993;328:692–696. [DOI] [PubMed] [Google Scholar]
- 11. Escobar J, Teramo K, Stefanovic V, Andersson S, Asensi MA, Arduini A, Cubells E, Sastre J, Vento M. Amniotic fluid oxidative and nitrosative stress biomarkers correlate with fetal chronic hypoxia in diabetic pregnancies. Neonatology. 2013;103:193–198. [DOI] [PubMed] [Google Scholar]
- 12. Hayes EK, Lechowicz A, Petrik JJ, Storozhuk Y, Paez‐Parent S, Dai Q, Samjoo IA, Mansell M, Gruslin A, Holloway AC, Raha S. Adverse fetal and neonatal outcomes associated with a life‐long high fat diet: role of altered development of the placental vasculature. PLoS One. 2012;7:e33370. [DOI] [PMC free article] [PubMed] [Google Scholar]
- 13. Makowski EL, Battaglia FC, Meschia G, Behrman RE, Schruefer J, Seeds AE, Bruns PD. Effect of maternal exposure to high altitude upon fetal oxygenation. Am J Obstet Gynecol. 1968;100:852–856. [DOI] [PubMed] [Google Scholar]
- 14. Longo LD. Carbon monoxide: effects on oxygenation of the fetus in utero. Science. 1976;194:523–525. [DOI] [PubMed] [Google Scholar]
- 15. Katz O, Sheiner E. Asthma and pregnancy: a review of two decades. Expert Rev Respir Med. 2008;2:97–107. [DOI] [PubMed] [Google Scholar]
- 16. Christensen KL, Mulvany MJ. Mesenteric arcade arteries contribute substantially to vascular resistance in conscious rats. J Vasc Res. 1993;30:73–79. [DOI] [PubMed] [Google Scholar]
- 17. Hemmings DG, Williams SJ, Davidge ST. Increased myogenic tone in 7‐month‐old adult male but not female offspring from rat dams exposed to hypoxia during pregnancy. Am J Physiol Heart Circ Physiol. 2005;289:674–682. [DOI] [PubMed] [Google Scholar]
- 18. Williams SJ, Hemmings DG, Mitchell JM, McMillen IC, Davidge ST. Effects of maternal hypoxia or nutrient restriction during pregnancy on endothelial function in adult male rat offspring. J Physiol. 2005;565:125–135. [DOI] [PMC free article] [PubMed] [Google Scholar]
- 19. Walton SL, Singh RR, Tan T, Paravicini TM, Moritz KM. Late gestational hypoxia and a postnatal high salt diet programs endothelial dysfunction and arterial stiffness in adult mouse offspring. J Physiol. 2016;594:1451–1463. [DOI] [PMC free article] [PubMed] [Google Scholar]
- 20. Shi L, Zhang H, Chen Y, Liu Y, Lu N, Zhao T, Zhang L. Chronic exercise normalizes changes in Cav1.2 and KCa1.1 channels in mesenteric arteries from spontaneously hypertensive rats. Br J Pharmacol. 2015;172:1846–1858. [DOI] [PMC free article] [PubMed] [Google Scholar]
- 21. Shi L, Liu B, Li N, Xue Z, Liu X. Aerobic exercise increases BKCa channel contribution to regulation of mesenteric arterial tone by up regulating β1‐subunit. Exp Physiol. 2013;98:326–336. [DOI] [PubMed] [Google Scholar]
- 22. Meera P, Wallner M, Jiang Z, Toro L. A calcium switch for the functional coupling between α (hslo) and β subunits (Kv, Caβ) of maxi K channels. FEBS Lett. 1996;385:127–128. [DOI] [PubMed] [Google Scholar]
- 23. Jackson WF. Ion channels and vascular tone. Hypertension. 2000;35:173. [DOI] [PMC free article] [PubMed] [Google Scholar]
- 24. Harhun MI, Belevich AE, Povstyan OV, Shuba MF. The role of voltage gated K(+) channels in the modulation of resting membrane potential of myocytes isolated from rat resistance arteries. Fiziol Zh. 2000;46:91–97. [PubMed] [Google Scholar]
- 25. Bae YM, Kim A, Kim J, Park SW, Kim TK, Lee YR, Kim B, Cho SI. Serotonin depolarizes the membrane potential in rat mesenteric artery myocytes by decreasing voltage‐gated Kv currents. Biochem Biophys Res Commun. 2006;347:468–476. [DOI] [PubMed] [Google Scholar]
- 26. Lu Y, Hanna ST, Tang G, Wang R. Contributions of Kv1.2, Kv1.5 and Kv2.1 subunits to the native delayed rectifier K(+) current in rat mesenteric artery smooth muscle cells. Life Sci. 2002;71:1465–1473. [DOI] [PubMed] [Google Scholar]
- 27. Kidd MW, Leo MD, Bannister JP, Jaggar JH. Intravascular pressure enhances the abundance of functional Kv1.5 channels at the surface of arterial smooth muscle cells. Sci Signal. 2015;8:ra83. [DOI] [PMC free article] [PubMed] [Google Scholar]
- 28. Cordaillat M, Rugale C, Casellas D, Mimran A, Jover B. Cardiorenal abnormalities associated with high sodium intake: correction by spironolactone in rats. Am J Physiol Regul Integr Comp Physiol. 2005;289:1137–1143. [DOI] [PubMed] [Google Scholar]
- 29. Lifton RP, Gharavi AG, Geller DS. Molecular mechanisms of human hypertension. Cell. 2001;104:545–556. [DOI] [PubMed] [Google Scholar]
- 30. Hall JE. Guyton and Hall Textbook of Medical Physiology. 13th ed Philadelphia, PA: Elsevier; 2015. [Google Scholar]
- 31. Kurtz TW, Dominiczak AF, DiCarlo SE, Pravenec M, Morris RC. Molecular‐based mechanisms of Mendelian forms of salt‐dependent hypertension: questioning the prevailing theory. Hypertension. 2015;65:932–941. [DOI] [PubMed] [Google Scholar]
- 32. Morris RC, Schmidlin O, Sebastian A, Tanaka M, Kurtz TW. Vasodysfunction that involves renal vasodysfunction, not abnormally increased renal retention of sodium, accounts for the initiation of salt‐induced hypertension. Circulation. 2016;137:881–893. [DOI] [PMC free article] [PubMed] [Google Scholar]
- 33. Moosmang S, Schulla V, Welling A, Feil R, Feil S, Wegener JW, Hofmann F, Klugbauer N. Dominant role of smooth muscle L‐type calcium channel Cav1.2 for blood pressure regulation. EMBO J. 2003;22:6027–6034. [DOI] [PMC free article] [PubMed] [Google Scholar]
- 34. Ohya Y, Fujii K, Eto K, Abe I, Fujishima M. Voltage‐dependent Ca2+ channels in resistance arteries from Dahl salt‐sensitive rats. Hypertens Res. 2000;23:701–707. [DOI] [PubMed] [Google Scholar]
- 35. Cox RH, Lozinskaya IM. Augmented calcium currents in mesenteric artery branches of the spontaneously hypertensive rat. Hypertension. 1995;26:1060–1064. [DOI] [PubMed] [Google Scholar]
- 36. Pratt PF, Bonnet S, Ludwig LM, Bonnet P, Rusch NJ. Upregulation of L‐type Ca2+ channels in mesenteric and skeletal arteries of SHR. Hypertension. 2002;40:214–219. [DOI] [PubMed] [Google Scholar]
- 37. Liao J, Zhang Y, Ye F, Zhang L, Chen Y, Zeng F, Shi L. Epigenetic regulation of L‐type voltage‐gated Ca2+ channels in mesenteric arteries of aging hypertensive rats. Hypertens Res. 2017;40:441–449. [DOI] [PubMed] [Google Scholar]
- 38. Hermsmeyer K, White AC, Triggle DJ. Decreased dihydropyridine receptor number in hypertensive rat vascular muscle cells. Hypertension. 1995;25:731–734. [DOI] [PubMed] [Google Scholar]
- 39. Tajada S, Cidad P, Colinas O, Santana LF, López‐López JR, Pérez‐García MT. Down‐regulation of Cav1.2 channels during hypertension: how fewer Cav1.2 channels allow more Ca2+ into hypertensive arterial smooth muscle. J Physiol. 2013;591:6175–6191. [DOI] [PMC free article] [PubMed] [Google Scholar]
- 40. Owens GK, Kumar MS, Wamhoff BR. Molecular regulation of vascular smooth muscle cell differentiation in development and disease. Physiol Rev. 2004;84:767–801. [DOI] [PubMed] [Google Scholar]
- 41. Gollasch M, Haase H, Ried C, Lindschau C, Morano I, Luft FC, Haller H. L‐type calcium channel expression depends on the differentiated state of vascular smooth muscle cells. FASEB J. 1998;12:593–601. [DOI] [PubMed] [Google Scholar]
- 42. Quignard JF, Harricane MC, Menard C, Lory P, Nargeot J, Capron L, Mornet D, Richard S. Transient down‐regulation of L‐type Ca2+ channel and dystrophin expression after balloon injury in rat aortic cells. Cardiovasc Res. 2001;49:177–188. [DOI] [PubMed] [Google Scholar]
- 43. Ihara E, Hirano K, Hirano M, Nishimura J, Nawata H, Kanaide H. Mechanism of down‐regulation of L‐type Ca2+ channel in the proliferating smooth muscle cells of rat aorta. J Cell Biochem. 2002;87:242–251. [DOI] [PubMed] [Google Scholar]
- 44. Nelson MT, Patlak JB, Worley JF, Standen NB. Calcium channels, potassium channels, and voltage dependence of arterial smooth muscle tone. Am J Physiol Cell Physiol. 1990;259:3–18. [DOI] [PubMed] [Google Scholar]
- 45. Martens JR, Gelband CH. Alterations in rat interlobar artery membrane potential and K+ channels in genetic and nongenetic hypertension. Circ Res. 1996;79:295–301. [DOI] [PubMed] [Google Scholar]
- 46. Wellman GC, Cartin L, Eckman DM, Stevenson AS, Saundry CM, Lederer WJ, Nelson MT. Membrane depolarization, elevated Ca2+ entry, and gene expression in cerebral arteries of hypertensive rats. Am J Physiol Heart Circ Physiol. 2001;281:2559–2567. [DOI] [PubMed] [Google Scholar]
- 47. Amberg GC, Santana LF. Kv2 channels oppose myogenic constriction of rat cerebral arteries. Am J Physiol Cell Physiol. 2006;291:348–356. [DOI] [PubMed] [Google Scholar]
- 48. Knaus HG, Garcia‐Calvo M, Kaczorowski GJ, Garcia ML. Subunit composition of the high conductance calcium‐activated potassium channel from smooth muscle, a representative of the mSlo and slowpoke family of potassium channels. J Biol Chem. 1994;269:3921–3924. [PubMed] [Google Scholar]
- 49. Tanaka Y, Meera P, Song M, Knaus HG, Toro L. Molecular constituents of maxi KCa channels in human coronary smooth muscle: predominant subunit complexes. J Physiol. 1997;502:545–575. [DOI] [PMC free article] [PubMed] [Google Scholar]
- 50. Nimigean CM, Magleby KL. The β1 subunit increases the Ca2+ sensitivity of large conductance Ca2+‐activated potassium channels by retaining the gating in the bursting states. J Gen Physiol. 1999;113:425–440. [DOI] [PMC free article] [PubMed] [Google Scholar]
- 51. McManus OB, Helms LM, Pallanck L, Ganetzky B, Swanson R, Leonard RJ. Functional role of the β1 subunit of high conductance calcium‐activated potassium channels. Neuron. 1995;14:645–650. [DOI] [PubMed] [Google Scholar]
- 52. Cox DH, Aldrich RW. Role of the β1 subunit in large‐conductance Ca2+‐activated K+ channel gating energetics: mechanisms of enhanced Ca2+ sensitivity. J Gen Physiol. 2000;116:411–432. [DOI] [PMC free article] [PubMed] [Google Scholar]
- 53. Jaggar JH, Porter VA, Lederer WJ, Nelson MT. Calcium sparks in smooth muscle. Am J Physiol Cell Physiol. 2000;278:235–256. [DOI] [PubMed] [Google Scholar]