

Abstract
Background
The cardiovascular effects of low‐level environmental radiation exposures are poorly understood. Although particulate matter (PM) has been linked to cardiovascular morbidity and mortality, and elevated blood pressure (BP), the properties promoting its toxicity remain uncertain. Addressing a knowledge gap, we evaluated whether BP increased with higher exposures to radioactive components of ambient PM, herein referred to as particle radioactivity (PR).
Methods and Results
We performed a repeated‐measures analysis of 852 men to examine associations between PR exposure and BP using mixed‐effects regression models. As a surrogate for PR, we used gross β activity, measured by the US Environmental Protection Agency's radiation monitoring network. Higher PR exposure was associated with increases in both diastolic BP and systolic BP, for exposures from 1 to 28 days. An interquartile range increase in 28‐day PR exposure was associated with a 2.95–mm Hg increase in diastolic BP (95% confidence interval, 2.25–3.66; P<0.001) and a 3.94–mm Hg increase in systolic BP (95% confidence interval, 2.62–5.27; P<0.001). For models including both PR and PM ≤2.5 µm, the PR‐BP associations remained stable and significant. For models including PR and black carbon or PR and particle number, the PR‐BP associations were attenuated; however, they remained significant for many exposure durations.
Conclusions
This is the first study to demonstrate the potential adverse effects of PR on both systolic and diastolic BPs. These were independent and similar in magnitude to those of PM ≤2.5 µm, black carbon, and particle number. Understanding the effects of particle‐bound radionuclide exposures on BP may have important implications for environmental and public health policy.
Keywords: blood pressure, epidemiology, particle radioactivity, particle toxicity, particulate matter
Subject Categories: High Blood Pressure, Epidemiology, Hypertension
Clinical Perspective
What Is New?
Although particulate matter has been linked to cardiovascular morbidity and mortality, and elevated blood pressure, the properties promoting its toxicity remain uncertain.
In addressing a knowledge gap, this is the first study to demonstrate associations between higher exposures to the particle radioactivity and increased blood pressure.
Because of widespread exposure to low levels of ionizing radiation across the United States and beyond, our findings may have important implications for environmental and public health policy.
What Are the Clinical Implications?
Our study demonstrates a relation between particle radioactivity and blood pressure, which is independent and similar in magnitude to that of particulate matter air pollution.
Our findings suggest that particle‐bound radionuclides, on inhalation, deposition, and translocation, can subsequently lead to systemic inflammation and oxidation stress.
Studies published in the past 2 decades have suggested increased long‐term risk of atherosclerosis and cardiac events after short‐term exposures to ionizing radiation from the atomic bomb1, 2, 3, 4 or longer‐term radiation exposures related to nuclear power plant spills, work at nuclear power plants, or uranium mining.2, 3, 4, 5, 6, 7, 8, 9 Therapeutic radiation treatment for Hodgkin disease, breast cancer, and other malignancies has also been linked to later cardiovascular complications,10, 11 although the mechanisms by which radiation affects cardiac outcomes are not completely understood.12 Evidence for cardiovascular and cancer effects of short‐ and long‐term exposure to relatively high‐level radiation has been used by the International Commission on Radiological Protection and by governments globally for regulation of exposure.13, 14 However, the potential short‐term cardiovascular effects of low‐level radiation associated with air pollution particles have not previously been considered.
There is a knowledge gap about the properties of particulate matter (PM) air pollution responsible for its well‐documented short‐ and long‐term effects on cardiovascular outcomes that include myocardial infarction, cardiac failure, stroke, and deep vein thrombosis.15, 16, 17, 18, 19 Studies investigating short‐term associations between air pollution and blood pressure (BP) have reported increases in systolic BP (SBP) and diastolic BP (DBP),17, 20, 21, 22, 23 although other studies have shown an inverse or no association.24, 25 Although the radiometric composition of PM has been quantified,26, 27 the impacts of particle radioactivity (PR) on BP have not been examined. We, therefore, begin investigation of a new paradigm on the radioactive properties of particulate air pollution and their effect on cardiovascular health. We hypothesize that inhaled particulates act as vectors for radionuclides, which may continue to emit radiation after inhalation and deposition in the human respiratory tract. These may promote oxidative stress and inflammation, which, in turn, lead to changes in vascular structure or function.
Natural and anthropogenic sources of radiation are produced through the radioactive decay of unstable atoms, called radionuclides.28 When radionuclides decay, they transform into different atoms (namely, decay products or progenies) until they reach a stable state and are no longer radioactive. Internal exposure to radiation arises when radionuclides are inhaled or ingested, as they continue to emit radiation.13, 29 This may occur when dust particles in air contain radionuclides of, for example, the 238uranium and 232thorium decay chains. Radon (222Rn) is a ubiquitous radioactive gas, which arises from the disintegration of uranium radionuclides that are naturally present in granitic and metamorphic rocks. According to the United Nations Scientific Committee on the Effects of Atomic Radiation,28 the dominant component of radiation exposure in humans is inhalation of the short‐lived decay products of radon. Inhaled radon decay products deposit in the respiratory tract, where they further decay and irradiate lung tissues.30 As such, radon is a leading cause of lung cancer, responsible for 3% to 14% of cases.31, 32 Radionuclides in the environment may also arise because of fallout from nuclear power plants, nuclear accidents, and nuclear weapons testing.
A radionuclide may decay by one of several processes: emission of α and β particles and isomeric transitions, such as γ and X‐ray emission. β Particles include negatively charged electrons and positively charged positrons. β Particles can penetrate 10 mm into skin tissue; therefore, they can pose both an external hazard and an internal hazard when emissions occur within the body.29 The biological effects observed after internal deposition of these radionuclides are a result of the interactions with cells and tissues of the various types of radiation emitted during each step of the decay chain.13, 28, 29
The radiometric composition of airborne particulate samples has been quantified in previous studies.26, 27 This includes analyzing PM samples for gross α and gross β activities, and γ rays. For example, Hernández et al27 analyzed the radiometric compositions of airborne particulate samples, collected weekly during a 4‐year period, in Tenerife, Spain. For this, gross α and β activities, and 7Be, 210Pb, 228Ac, 226Ra, 212Pb, 214Pb, 208Tl, 214Bi, 235U, 40K, 131I, and 137Cs concentrations, were measured in 376 samples. The gross β activity showed correlations with the gross α activity (R=0.72).
In the United States, environmental radioactivity is measured by the US Environmental Protection Agency's (EPA's) RadNet monitoring network.33 The primary aim of the RadNet network is to record ambient radioactivity after radiological incidents and, to a lesser extent, detect naturally occurring radionuclides. The US EPA measures PR by detecting β activities in PM samples.33 As such, we use gross β activity as a surrogate for PR in this study.
The impact of exposure to PR, specifically α and β activity and γ rays, on cardiovascular health risk factors has not been studied previously. As a first step in addressing a critical gap in the literature, we examine the associations of short‐ to medium‐term average PR exposures with increases in BP. We use repeated BP measurements (every 4 years) from a longitudinal study of a closed cohort of elderly men. This study testing for independent PR‐BP associations complements previous research demonstrating increases of BP with increased particle mass <2.5 μm (PM2.5), black carbon (BC), and particle number (PN) per cm3. To our knowledge, this is the first study to use measurements collected from an environmental radioactivity monitoring network for a health effects study.
Methods
Study Population
Participants included in this analysis were part of the NAS (Normative Aging Study), a longitudinal investigation established in Boston, MA, in 1963 by the US Veterans Administration and limited to men who were healthy at intake.34 At the time of initial enrollment, participants were free of heart disease, hypertension, diabetes mellitus, cancer, recurrent asthma, and bronchitis. We measured BP in 852 individuals 1 to 7 times with intervals of 3 to 5 years (a total of 2492 observations) during the period from 1998 to 2013. Medical visits included on‐site physical examinations and questionnaires after smoking abstinence and an overnight fast. Details of the methods and surveys are described elsewhere.35 At each medical visit, we measured SBP and DBP once in each arm while the subject was seated, using a standard cuff. Subjects provided written informed consent to participate in this study. This study was approved by the Harvard T.H. Chan School of Public Health and the Veterans Administration Central Institutional Review Boards. The NAS health data and air pollution will not be made publicly available. The PR data are publicly available on the US EPA web site.33 The analytic methods will be made available to other researchers for purposes of reproducing the results or replicating the procedure, on reasonable request.
Exposures
Particle radioactivity and gross β activity
Gross β activity was used as a surrogate for PR in this study. Gross β activity is a measurement of all particle‐bound ambient β activity, regardless of the specific radionuclide source.33 Gross β activity data were acquired from the US EPA's RadNet monitoring network.33 RadNet was established in 1973 to identify fluctuations in background levels of environmental radiation and detect abnormally high radiation levels after radiological events. The network comprises 135 stationary sampling stations providing airborne particulate samples. Each air monitoring station is equipped with a total suspended particle high‐volume air sampler collecting particles on filters (10‐cm‐diameter synthetic fiber). Gross β activity on the filters is measured in the field after a 5‐hour period to permit decay of some short‐lived radon progenies (eg, 214Pb and 214Bi) that may be attached to the particles. Despite the decay of most of the short‐lived radionuclides, there is still residual radioactivity, especially from the last 1 to 2 days of the sampled particles, which can be related to the relatively long‐lived thoron progenies (eg, 212Pb and 212Bi). In the absence of real‐time β activity, we use these data as a qualitative indicator of radiation activity of particles collected on the filter. This assumption has been proved previously,27 where a significant linear correlation (R=0.72) between gross β and gross α activity was observed. To calculate the quantity of β activity on filters, a background subtraction procedure is applied. Samples are collected over several days (typically from 5 to 7 days). Because of this multiday sampling protocol, we assigned all days within the sampling period with the same β activity levels and subsequently calculated moving averages on the basis of these daily measures.
Gross β activity measurements were attained from monitoring sites in Boston, MA; Worcester, MA; Providence, RI; and Albany, NY. The locations correspond to the geographical distribution of the residential locations of the NAS participants. A regional mean gross β activity was calculated on the basis of the data collected and used as the PR exposure for the study. The data collected from each site did not cover the entire study period, and different sites covered different periods. We, therefore, used measurements from the Albany, NY, site, which covered the entire study period from 1998 to 2013, to predict levels in each of the other 3 sites. Specifically, for each site, we performed a regression analysis of the available daily measurements on the corresponding data collected at Albany to estimate a slope and an intercept that we used to model the missing gross β activity levels at that site. The R 2 values for the 3 calibration regressions ranged from 62% to 71%. To estimate average β activity exposures, we averaged the predicted daily gross β activity value from the 3 sites of Boston, Worcester, and Providence, to obtain 1 daily PR exposure for our study population, residing in the eastern Massachusetts area.
Air pollution
Previous studies suggest that the relevant exposure window for the association between air pollution and cardiovascular‐related outcome ranges from hours to years.16, 36 We explored short‐ and medium‐term exposures. We a priori focused on air pollution concentrations measured on the same day of the visit and on the mean exposures computed up to 28 days before medical visits. We measured ambient particle concentrations at the Harvard supersite located near downtown Boston and approximately 1 km from the study medical center. We measured the following particle parameters: (1) hourly PN per cm3, which captures fine and ultrafine particles with a 0.007 to 3 μm range in diameter, using a condensation particle counter (model 3022A; TSI Inc, Shoreview, MN); (2) hourly PM2.5 mass concentrations using a tapered element oscillation microbalance (model 1400A; Rupprecht and Pastachnick, East Greenbush, NY); and; (3) hourly PM2.5 BC with an aethalometer (model AE‐16; Magee Scientific Co, Berkeley, CA).
Statistical Analysis
We examined whether same day and moving average PR and air pollution exposures (PM2.5, BC, and PN) were associated with BP outcomes. We analyzed associations using linear mixed effects models with a random intercept for each subject. We evaluated SBP and DBP as dependent variables. The models took the general form:
where Yit is the level of SBP or DBP in subject i at visit t; covariates for subject i at visit t are denoted by X1it to Xkit. Eit is the mean exposure concentration for the subject i in the day of and days before the visit t. Here, ui represents a subject‐specific intercept, reflecting unexplained heterogeneity in subjects’ overall level of outcome and accounting for longitudinal correlation among measurements taken on the same subject. We assume that ui values are generated from a normal distribution with common variance, yielding the compound‐symmetry variance structure. The model accommodates unbalanced data (ie, varying numbers of repeated measurements on each subject) under the assumption that any missing data are missing at random. We reported the effect estimates as the mean difference in the SBP and DBP outcomes per interquartile range (IQR) increase in exposure, adjusted for the other covariates in the model. Exposure IQRs were calculated separately for each exposure window studied (from same day to 28 days before the medical visit). The IQR reflects the distribution (25th–75th percentile) in the observed data, while also enabling a comparison of the effects of different exposure types measured with different units.
We adjusted for the following potential confounders: temperature (24‐hour mean of the day of the study visit) and sine and cosine terms as a function of the day of the year. We also controlled for time‐varying factors likely to influence the outcome but not exposure, such as age (continuously modeled), pulse (continuously modeled), physician‐diagnosed diabetes mellitus (yes versus no), body mass index (continuously modeled), smoking status (never versus former versus current), cumulative cigarette pack‐years calculated for current and former smokers (continuously modeled), alcohol intake (<2 drinks per day versus 2+ drinks per day), and fasting glucose (continuously modeled). We adjusted for use of antihypertensive medications (separate indicators for angiotensin‐converting enzyme inhibitors, β blockers, calcium channel blockers, angiotensin receptor blockers, and diuretics), α blockers, and creatine clearance. These were chosen a priori on the basis of established relationships with BP and were included in models regardless of statistical significance. In addition, to control for socioeconomic status, we included years of education for each subject. We considered additional potential confounders (median income level, as measured by the 1999 census; and height of the planetary boundary layer, as this is related to local pollution dynamics) and included them if effect estimates changed by >5%.
We performed sensitivity analyses. We included each of the air pollutants (PM2.5, BC, and PN) in regression models with PR. In doing so, we estimated how the independent PR‐BP association changed on inclusion of each of the air pollutant parameters. Furthermore, we examined potential interactions between PR and each of these air pollutant exposures (PM2.5, BC, and PN). As with all longitudinal studies, healthier study participants may be more likely to participate in subsequent clinical examinations over time. To evaluate the validity of the missing at random assumption and assess the impact of potential selection bias caused by nonrandom unavailability for follow‐up, we used inverse probability weighting. Specifically, we modeled the probability of returning for a visit on the basis of variables available at previous visits, including BP measures. All analyses were performed using R software, version 3.3.2 (Comprehensive R Archive Network: http://cran-r-project.org).
Results
Table 1 shows the longitudinal characteristics of the population. All participants were men, with a mean age of 70 years and a body mass index of 28 kg/m3 across initial study visits. At this baseline, <10% of subjects were current smokers, but most were former smokers. The participants were healthier at baseline than subsequent visits in terms of being less likely to have diabetes mellitus and to take medications. For example, 48% of participants were initially antihypertensive medication users at the onset of the study, whereas that use increased during the follow‐up. The mean SBP and DBP at the first visit were 136 and 82 mm Hg, respectively.
Table 1.
Descriptive Statistics for the NAS Cohort, Including Cardiovascular‐Related Outcomes and Demographic Characteristics Reported on the First Clinical Examination (Baseline) (n=852 Subjects) and Over All Clinical Examinations (N=2492)
| Study Variable (Unit) | Baseline | All Visits |
|---|---|---|
| Age, y | 70.1±7.0 | 75.1±7.0 |
| Pulse, bpm | 71.5±9.1 | 70.3±9.2 |
| Body mass index, kg/m2 | 27.9±3.9 | 28.0±4.1 |
| Cumulative smoking (pack‐years*) | 31.8±29.4 | 20.2±24.5 |
| Systolic blood pressure, mm Hg | 136±17.9 | 129.2±17.6 |
| Diastolic blood pressure, mm Hg | 82±9.1 | 72.4±10.7 |
| Fasting plasma glucose, mg/dL | 109.6±32.8 | 106.6±24.6 |
| Years of education (individual) | 14.4±2.7 | 14.7±2.9 |
| Smoking status | ||
| Never | 235 (28) | 750 (30) |
| Former | 572 (67) | 1659 (67) |
| Current | 46 (5) | 83 (3) |
| Alcohol intake (2+ drinks per day) | 178 (21) | 467 (19) |
| Diabetes mellitus† | 94 (11) | 390 (16) |
| Antihypertensive medication‡ | ||
| Any | 407 (48) | 1646 (66) |
| Calcium channel blockers | 153 (18) | 440 (18) |
| ACE inhibitors | 141 (17) | 831 (33) |
| Angiotensin receptor agonists | 14 (2) | 202 (8) |
| β Blockers | 204 (24) | 978 (39) |
| Diuretics | 116 (14) | 610 (24) |
| α Blockers | 72 (8) | 396 (16) |
Values for the continuous variables are reported as mean±SD, whereas values for the categorical variables are number (percentage). ACE indicates angiotensin‐converting enzyme; bpm, beats per minute; and NAS, Normative Aging Study.
*Pack‐year is defined as the number of packs of cigarettes smoked per day times the number of years the person has smoked.
†Diabetic status was diagnosed by a physician.
‡Current use of antihypertensive medications (ACE inhibitors, β blockers, calcium channel blockers, angiotensin receptor blockers, and diuretics).
Characteristics of the ambient PR and air pollution exposures during the study period are presented in Table 2. The mean daily PR exposure was 2.7×10⁻⁴ Bq/m3, with an IQR of 1.0×10⁻⁴ Bq/m3. Mean daily PM2.5 exposure was 9.3 μg/m3, with an IQR of 6.7 μg/m3. Mean daily BC exposure was 0.8 μg/m3, with an IQR of 0.5 μg/m3. Finally, the mean daily PN count was 2.2×10⁴ per cm3, with an IQR of 1.7×10⁴ per cm3. Table 3 describes the correlation of daily PR and air pollution measurements for clinical measurement days.
Table 2.
Distributions of Ambient Measured PR (Gross β Activity) and Particulate Air Pollution Variables (PM2.5 Mass, BC, and PN), Starting in 1998 and Ending in 2013
| Exposure (Unit) | PR, Bq/m3 | PM2.5, μg/m3 | BC, μg/m3 | PN, Number/cm3 | |||||
|---|---|---|---|---|---|---|---|---|---|
| Mean±SD×10−4 | IQR×10−4 | Mean±SD | IQR | Mean±SD×10−1 | IQR×10−1 | Mean±SD×104 | IQR×104 | ||
| Exposure window, d | 1 | 2.70±0.83 | 1.04 | 9.33±6.39 | 6.70 | 7.99±4.04 | 5.37 | 2.22±1.25 | 1.72 |
| 7 | 2.69±0.73 | 0.90 | 9.61±3.98 | 4.67 | 7.16±2.23 | 3.13 | 2.11±1.07 | 1.54 | |
| 14 | 2.67±0.62 | 0.82 | 9.61±3.35 | 4.16 | 7.15±1.88 | 2.60 | 2.11±1.05 | 1.52 | |
| 21 | 2.68±0.56 | 0.56 | 9.63±3.12 | 3.90 | 7.13±1.76 | 2.43 | 2.10±1.03 | 1.49 | |
| 28 | 2.68±0.53 | 0.69 | 9.66±3.01 | 3.78 | 7.14±1.70 | 2.49 | 2.10±1.02 | 1.48 | |
The units of measure for radioactivity are the Ci and the Bq, the latter being the SI unit. The Bq is defined as the number of radioactive transformations in a second and is equivalent to 2.7×10⁻¹¹ Ci. BC indicates black carbon; IQR, interquartile range; PM2.5, particulate matter ≤2.5 µm; PN, particle number; and PR, particle radioactivity.
Table 3.
Correlation Matrix of Daily Measured PR (Gross β Activity) and Particulate Air Pollution Variables (PM2.5 Mass, BC, and PN), for Clinical Examination Days (N=2492)
| Exposure | Spearman Correlation Coefficient* | |||
|---|---|---|---|---|
| PR | PM2.5 | BC | PN | |
| PR | 1 | … | … | … |
| PM2.5 | 0.32 | 1 | … | … |
| BC | 0.28 | 0.64 | 1 | … |
| PN | 0.20 | −0.01 | 0.16 | 1 |
BC indicates black carbon; PM2.5, particulate matter ≤2.5 µm; PN, particle number; and PR, particle radioactivity.
*All P<0.05.
In examining the spatial variability of PR across our study domain, correlations of daily measured PR were determined between the 4 monitoring sites located in Albany, Boston, Providence, and Worcester. Correlations computed for days when we had overlapping data for all 4 sites ranged from 0.51 to 0.72. In investigating the mean ratios of measured PR between pairs of monitoring sites, the ratio between Albany and Boston was 1.65±0.73; the ratio between Albany and Providence was 1.55±0.70; and the ratio between Albany and Worcester was 1.20±0.47. The mean PR ratio between Boston and Providence was 1.02±0.48; the mean PR ratio between Boston and Worcester was 0.78±0.27; and the mean PR ratio between Providence and Worcester was 0.86±0.40.
We observed statistically significant (P<0.001) associations between PR, PM2.5, BC, and PN with both SBP and DBP. We examined exposure windows ranging from 1 to 28 days. Models first included a single exposure variable (PR, PM2.5, BC, and PN), whereas a second set of models was evaluated with 2 exposure variables (PR and PM2.5 mass, PR and BC, and PR and PN).
Associations between PR exposure and both SBP and DBP were strong, even when adjusting for confounders (P<0.001 for almost all exposures) (Figure 1 and Table 4). The magnitude of the estimated associations increased as the exposure window increased. An IQR increase in PR exposures in the previous 28 days was significantly (P<0.001) associated with a 2.95–mm Hg (95% confidence interval [CI], 2.25–3.66 mm Hg) increase in DBP and a 3.94–mm Hg (95% CI, 2.62–5.27 mm Hg) increase in SBP. An IQR difference in same‐day PR exposure was significantly (P<0.05) associated with differences of 0.95 mm Hg (95% CI, 0.36–1.53 mm Hg) and 1.24 mm Hg (95% CI, 0.16–2.32 mm Hg) in DBP and SBP, respectively.
Figure 1.
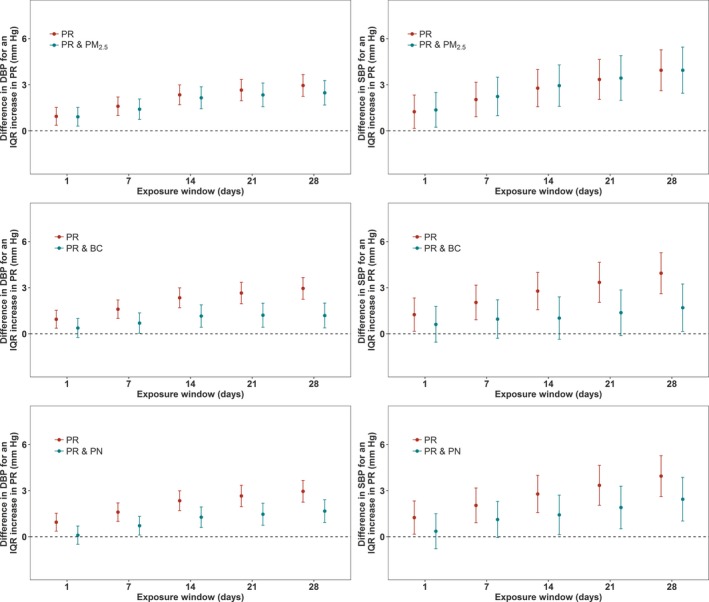
Associations of particle radioactivity (PR) exposure with diastolic blood pressure (DBP) and systolic blood pressure (SBP), and associations of PR with SBP and DBP where the models have also included particulate air pollution (particulate matter ≤2.5 µm [PM 2.5], black carbon [BC], and particle number [PN]) exposures, in a cohort of elderly men (n=852 subjects) for 2492 clinical visits. All models are adjusted for temperature, relative humidity, sine and cosine terms of the days of the season, age, body mass index, physician‐diagnosed diabetes mellitus, smoking status, cumulative cigarette pack‐years, alcohol intake, fasting glucose, creatine clearance, current use of antihypertensive medications, current use of α blockers, and years of education. The y axis represents the difference in DBP or SBP (mm Hg) per interquartile range (IQR) increase in PR exposure. The IQRs for PR are shown in Table 2. Error bars represent the 95% confidence intervals.
Table 4.
Difference in BP (DBP and SBP) Associated With an IQR Increase in Exposure to PR, as Observed in the Cohort of Elderly Men, for 2492 Clinical Visits (n=852 Subjects)
| Exposures in Model | PR | PR and PM2.5 | PR and BC | PR and PN | |
|---|---|---|---|---|---|
| Difference in DBP per IQR increase in exposure to PR (95% CI) | |||||
| Exposure window, d | 1 | 0.95 (0.36 to 1.53)* | 0.92 (0.31 to 1.52)* | 0.38 (−0.24 to 0.99) | 0.10 (−0.49 to 0.69) |
| 7 | 1.60 (1.00 to 2.20)† | 1.41 (0.74 to 2.08)† | 0.70 (0.04 to 1.36)* | 0.72 (0.11 to 1.33)* | |
| 14 | 2.35 (1.70 to 2.99)† | 2.32 (1.55 to 3.10)† | 1.25 (0.46 to 2.03)* | 1.37 (0.65 to 2.09)† | |
| 21 | 2.65 (1.96 to 3.35)† | 2.46 (1.65 to 3.28)† | 1.27 (0.45 to 2.10)* | 1.54 (0.78 to 2.30)† | |
| 28 | 2.95 (2.25 to 3.66)† | 2.60 (1.75 to 3.42)† | 1.24 (0.40 to 2.09)† | 1.74 (0.97 to 2.51)† | |
| Difference in SBP per IQR increase in exposure to PR (95% CI) | |||||
| Exposure window, d | 1 | 1.24 (0.16 to 2.32)* | 1.37 (0.23 to 2.50)* | 0.61 (−0.54 to 1.78) | 0.36 (−0.77 to 1.49) |
| 7 | 2.04 (0.92 to 3.17)† | 2.24 (0.99 to 3.45)† | 0.96 (−0.29 to 2.21) | 1.12 (−0.05 to 2.30) | |
| 14 | 2.78 (1.57 to 3.99)† | 2.94 (1.60 to 4.29)† | 1.11 (−0.38 to 2.59) | 1.54 (0.15 to 2.93)* | |
| 21 | 3.34 (2.04 to 4.65)† | 3.44 (1.99 to 4.89)† | 1.44 (0.12 to 3.00)‡ | 2.00 (0.55 to 3.46)* | |
| 28 | 3.94 (2.62 to 5.27)† | 3.95 (2.44 to 5.45)† | 1.77 (0.16 to 3.38)* | 2.55 (1.07 to 4.03)† | |
Outcomes are expressed as the difference in DBP or SBP per IQR increase in PR. IQRs for PR are shown in Table 2. All models are adjusted for temperature, relative humidity, sine and cosine terms of the days of the season, age, body mass index, physician‐diagnosed diabetes mellitus, smoking status, cumulative cigarette pack‐years, alcohol intake, fasting glucose, creatine clearance, current use of antihypertensive medications, current use of α blockers, and years of education. BC indicates black carbon; BP, blood pressure; CI, confidence interval; DBP, diastolic BP; IQR, interquartile range; PM2.5, particulate matter ≤2.5 µm; PN, particle number; PR, particle radioactivity; and SBP, systolic BP.
*P<0.05, † P<0.001, ‡ P<0.1.
We evaluated the impact of including PM2.5, BC, and PN in the PR‐BP models. Results of models with 2 exposure parameters are shown in Figures 1 and 2, along with Tables 4 and 5. When models included both PR and PM2.5, significant (P<0.05) associations were retained across all exposure windows for both DBP and SBP in response to PR exposure. The associations between PR exposure with both DBP and SBP were only negligibly affected. When PR or BC was included in the same models, the association of PR with DBP and SBP per IQR increase was attenuated. This attenuation increased as the exposure window increased. Although the PR effect estimates were reduced, they remained statistically significant for exposure windows from 7 to 28 days in the case of DBP. For SBP, marginally (P<0.01) and statistically significant (P<0.05) associations were retained for 28‐day PR exposures. When models simultaneously included PR and PN, the estimated association between BP and exposure to PR was reduced for both SBP and DBP. The PR‐BP association retained statistical significance (P<0.05) for 7‐ to 28‐day exposure windows in the case of DBP and was significant for 14‐, 21‐, and 28‐day exposure in the case of SBP.
Figure 2.
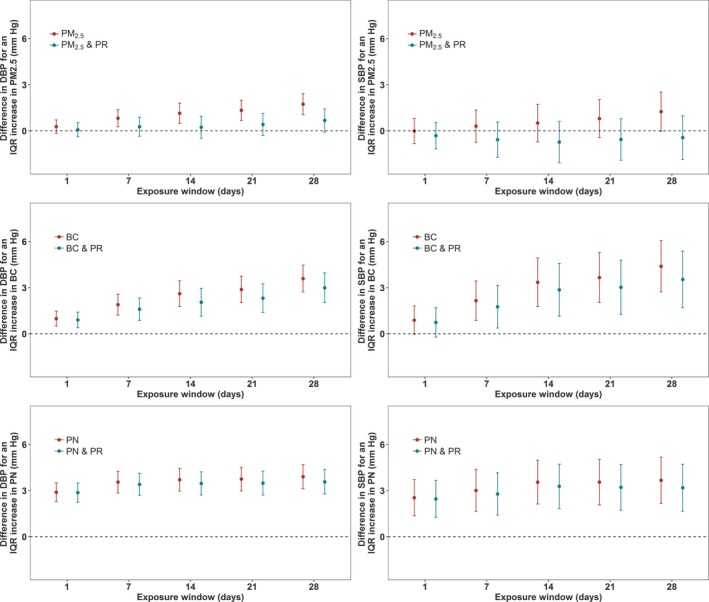
Associations of particulate air pollution exposures (particulate matter ≤2.5 µm [PM 2.5], black carbon [BC], and particle number [PN]) with diastolic blood pressure (DBP) and systolic blood pressure (SBP), and associations of particulate air pollution exposure with SBP and DBP where the models have also included particle radioactivity (PR) exposures, in a cohort of elderly men (n=852 subjects) for 2492 clinical visits. All models are adjusted for temperature, relative humidity, sine and cosine terms of the days of the season, age, body mass index, physician‐diagnosed diabetes mellitus, smoking status, cumulative cigarette pack‐years, alcohol intake, fasting glucose, creatine clearance, current use of antihypertensive medications, current use of α blockers, and years of education. The y axis represents the difference in DBP or SBP (mm Hg) per interquartile range (IQR) increase in the relevant air pollution exposure metric. The IQRs for PM 2.5 mass, BC, and PN are shown in Table 2. Error bars represent the 95% confidence intervals.
Table 5.
Difference in BP (DBP and SBP) Associated With an IQR Increase in Exposure to Particulate Air Pollution, as Observed in the Cohort of Elderly Men, for 2492 Clinical Visits (n=852 Subjects)
| Exposures in Model | Difference in DBP per IQR Increase in PM2.5 (95% CI) | Difference in SBP per IQR Increase in PM2.5 (95% CI) | |||
|---|---|---|---|---|---|
| PM2.5 | PM2.5 and PR | PM2.5 | PM2.5 and PR | ||
| Exposure window, d | 1 | 0.27 (−0.17 to 0.72) | 0.07 (−0.39 to 0.53) | −0.01 (−0.83 to 0.81) | −0.31 (−1.17 to 0.55) |
| 7 | 0.82 (0.26 to 1.38)* | 0.27 (−0.35 to 0.88) | 0.31 (−0.74 to 1.35) | −0.57 (−1.73 to 0.58) | |
| 14 | 1.14 (0.49 to 1.80)† | 0.24 (−0.48 to 0.95) | 0.51 (−0.72 to 1.74) | −0.73 (−2.08 to 0.62) | |
| 21 | 1.34 (0.68 to 2.00)† | 0.41 (−0.31 to 1.13) | 0.80 (−0.44 to 2.03) | −0.56 (−1.91 to 0.80) | |
| 28 | 1.74 (1.06to 2.42)† | 0.68 (−0.08 to 1.43)‡ | 1.25 (−0.03 to 2.53)‡ | −0.44 (−1.86 to 0.98) | |
| Exposures in Model | Difference in DBP per IQR Increase in BC (95% CI) | Difference in SBP per IQR Increase in BC (95% CI) | |||
|---|---|---|---|---|---|
| BC | BC and PR | BC | BC and PR | ||
| Exposure window, d | 1 | 0.99 (0.50 to 1.48)† | 0.90 (0.39 to 1.41)† | 0.89 (−0.04 to 1.80)‡ | 0.74 (−0.22 to 1.71) |
| 7 | 1.90 (1.22 to 2.57)† | 1.60 (0.87 to 2.33)† | 2.16 (0.87 to 3.43)† | 1.76 (0.37 to 3.14)‡ | |
| 14 | 2.61 (1.77 to 3.44)† | 2.05 (1.15 to 2.96)† | 3.35 (1.77 to 4.94)† | 2.86 (1.14 to 4.58)‡ | |
| 21 | 2.88 (2.02 to 3.74)† | 2.32 (1.39 to 3.25)† | 3.66 (2.03 to 5.29)† | 3.02 (1.26 to 4.79)† | |
| 28 | 3.60 (2.72 to 4.47)† | 2.99 (2.03 to 3.96)† | 4.39 (2.72 to 6.06)† | 3.54 (1.71 to 5.38)† | |
| Exposures in Model | Difference in DBP per IQR Increase in PN (95% CI) | Difference in SBP per IQR Increase in PN (95% CI) | |||
|---|---|---|---|---|---|
| PN | PN and PR | PN | PN and PR | ||
| Exposure window, d | 1 | 2.89 (2.28 to 3.51)† | 2.87 (2.24 to 3.50)† | 2.54 (1.36 to 3.72)† | 2.46 (1.25 to 3.67)† |
| 7 | 3.55 (2.84 to 4.26)† | 3.41 (2.69 to 4.13)† | 3.01 (1.65 to 4.37)† | 2.78 (1.40 to 4.16)† | |
| 14 | 3.71 (2.97 to 4.45)† | 3.47 (2.72 to 4.22)† | 3.55 (2.12 to 4.97)† | 3.28 (1.84 to 4.72)† | |
| 21 | 3.75 (3.12 to 4.52)† | 3.49 (2.71 to 4.26)† | 3.56 (2.08 to 5.03)† | 3.21 (1.72 to 4.70)† | |
| 28 | 3.91 (3.42 to 4.70)† | 3.57 (2.78 to 4.37)† | 3.67 (2.58 to 5.18)† | 3.18 (1.66 to 4.71)† | |
Outcomes are expressed as the difference in DBP or SBP per IQR increase in particulate air pollution (PM2.5 mass, BC, and PN). IQRs for PM2.5 mass, BC, and PN are shown in Table 2. All models are adjusted for temperature, relative humidity, sine and cosine terms of the days of the season, age, body mass index, physician‐diagnosed diabetes mellitus, smoking status, cumulative cigarette pack‐years, alcohol intake, fasting glucose, creatine clearance, current use of antihypertensive medications, current use of α blockers, and years of education. BC indicates black carbon; BP, blood pressure; CI, confidence interval; DBP, diastolic BP; IQR, interquartile range; PM2.5, particulate matter ≤2.5 µm; PN, particle number; PR, particle radioactivity; and SBP, systolic BP.
*P<0.05, † P<0.001, ‡ P<0.1.
Our findings add further evidence to the previously reported associations between particulate air pollution and BP in the NAS cohort (Figure 2 and Table 5). BC was significantly (P<0.05 or P<0.001) associated with DBP for all exposures, and SBP for exposures >7 days. An IQR increase in same‐day BC exposure was associated with a difference in mean DBP of 0.99 mm Hg (95% CI, 0.50–1.48 mm Hg). An IQR increase in 28‐day BC exposure was associated with a difference of 3.60 mm Hg (95% CI, 2.72–4.47 mm Hg) in DBP and 4.39 mm Hg (95% CI, 2.72–6.06 mm Hg) in SBP. The BC‐BP associations were slightly reduced when PR exposure was simultaneously included in the models, although still strongly significant (mostly P<0.001) for DBP, and significant (P<0.05) in the case of SBP for exposures >7 days. PN exposure had a strong and significant (P<0.001) association with both DBP and SBP. For example, an IQR increase in same‐day PN exposure was associated with an increase of 2.89 mm Hg (95% CI, 2.28–3.51 mm Hg) in DBP, whereas 28‐day PN exposure (IQR) was associated with an increase of 3.91 mm Hg (95% CI, 3.42–4.70 mm Hg) in DBP. When the models were adjusted for PR exposure also, this did not noticeably affect the results of PN. PM2.5 was significantly associated (P<0.05) with increases in DBP for all exposures >7 days, but no significant association with DBP was observed when the model was adjusted for PR exposure. PM2.5 had no observable association with SBP.
The size of PR‐induced cardiovascular effects was comparable to those produced by PM2.5, BC, and PN exposures. For example, PR exposure in the previous 28 days (IQR) was associated with a 2.95–mm Hg (95% CI, 2.25–3.66 mm Hg; P<0.001) increase in DBP and a 3.94–mm Hg (95% CI, 2.62–5.27 mm Hg; P<0.001) increase in SBP. Mean 28‐day BC exposure (IQR) was associated with an increase of 3.60 mm Hg (95% CI, 2.72–4.47 mm Hg; P<0.05) in DBP and 4.39 mm Hg (95% CI, 2.72–6.06 mm Hg; P<0.05) in SBP. The 28‐day PN exposure (IQR) was associated with a 3.91–mm Hg (95% CI, 3.42–4.70 mm Hg; P<0.001) increase in DBP and a 3.67–mm Hg (95% CI, 2.58–5.18 mm Hg; P<0.001) increase in SBP. For PM2.5, the DBP effect estimates were smaller than for PR (1.27 mm Hg; 95% CI, 1.06–2.42 mm Hg; P<0.001).
We observe an upward trend of effect estimates across each time window of mean exposure to PR and air pollution (Figures 1 and 2). This provides evidence that the effects of PR and air pollution (especially BC) on BP are not limited only to short‐ to medium‐term effects, and medium‐ to long‐term effects warrant further investigation.
We assessed the linearity of the association of PR and air pollution exposures on BP by fitting penalized splines for all exposure durations studied. The effects of same‐day, 21‐day, and 28‐day PR exposures on SBP and DBP were linear (df of 1). For the other exposure windows, Akaike Information Criterion (AIC) was minimized with a curve of >1 df; however, the overall trends were also approximately linear, with no evidence of a threshold (data not shown). Furthermore, in the models that included 2 exposure variables (PR and PM2.5 mass, PR and BC, and PR and PN), we tested interactions but did not find any statistically significant (P<0.05) results. Inverse probability weighting for the follow‐up observations caused no appreciable changes, similar to other studies on the same NAS cohort.37
Discussion
To the best of our knowledge, this is the first study to investigate the effect of PR exposure on the known cardiovascular risk factor of BP in a cohort. We investigate the effect of PR exposure (using gross β activity as a surrogate) on DBP and SBP, using longitudinal data with repeated measurements for each subject. Furthermore, we investigate the independent PR‐induced health effects while controlling for PM2.5, BC, and PN, and vice versa. To our knowledge, this is the first study to apply PR exposure for an environmental health study using data collected from a radiation monitoring network, such as RadNet, which had initially been purposed to detect radioactivity after radiological incidents.
In quantifying the impact of PR exposure on SBP and DBP in a cohort of elderly men, strong and statistically significant positive associations were observed. More important, the size of PR‐induced cardiovascular effects was comparable to those produced by PM2.5, BC, and PN exposures in this study. These BP‐PR associations remained significant when simultaneously adjusting for particulate air pollution exposures. When PR models also included PM2.5 exposures, the BP‐PR associations did not noticeably change. When PR models also included BC, the BP‐PR associations were attenuated, but retained significance for many exposure windows. When models included both PR and PN exposures, the BP‐PR associations were reduced; however, they retained significance (P<0.05) for most exposure durations.
The associations between particulate air pollution, especially BC and PN exposures, and increasing DBP and SBP were strong and significant in the study. When models controlled for PR exposure, the adverse BP effects of BC and PN exposure were only marginally attenuated. However, the differences in BP predicted in response to PM2.5 exposures were significantly attenuated, suggesting PR could potentially explain a significant portion of previously reported associations between BP and short‐ to medium‐term PM2.5 exposures.
This is the first study to examine how PR exposure affects BP; therefore, we are unable to directly compare our PR results with other studies. However, the cardiovascular effects of PR exposure are comparable to the effects produced by air pollution exposures determined in previous epidemiological studies. Our results were consistent with studies in the same cohort.21, 37, 38 For instance, in the same NAS cohort, Mordukhovich et al37 estimated changes in BP associated with increases in 7‐day BC and PM2.5 exposures. When these associations were transformed to reflect the exposures measured in our study, an increase in BC exposure (IQR) was associated with a 1.06–mm Hg (95% CI, 0.07–2.05 mm Hg; P<0.05) increase in SBP and a 0.63–mm Hg (95% CI, 0.11–1.16 mm Hg; P<0.05) increase in DBP. For PM2.5, an increase in exposure (IQR) was associated with a 0.42–mm Hg (95% CI, −0.67 to 1.51 mm Hg) increase in SBP, which is a slightly smaller estimate than in our study. PM2.5 was associated with a 0.01–mm Hg (95% CI, −0.56 to 0.57 mm Hg) increase in DBP, a slightly larger effect estimate than our study estimate. Neither of these PM2.5‐BP effect estimates were statistically significant in the study by Mordukhovich et al.37 Bind et al21 found increased BP levels in the NAS cohort in response to 28‐day exposures of PM2.5, BC, and PN. Bind et al21 reported smaller effect than ours for PM2.5 and larger effects relative to ours for both BC and PN. Among participants with DBP >77 mm Hg, an IQR increase in PM2.5 was associated with a 2.74–mm Hg increase in DBP. An IQR increase in BC led to an approximate 2.2–mm Hg increase in DBP, whereas an IQR increase in PN increased DBP by 3.6 mm Hg. Among participants with SBP >130 mm Hg, an IQR increase in PM2.5 led to a 1.89–mm Hg increase in SBP, an IQR increase in BC elevated SBP by 2.43 mm Hg, and PN exposure elevated SBP by 4.06 mm Hg. All effects represent the exposures used in our study. Although the effect estimates are indicative of similarities in the 2 studies, the NAS cohort subjects were stratified according to percentiles of BP21; therefore, the statistical results are not entirely comparable.
We compared our results with a similar study in another cohort.23 Hoffmann et al23 reported larger effects than in our study; an IQR increase in PM2.5 and in BC in the previous 5 days was associated with increases of 2.05 mm Hg (95% CI, 0.0–4.24 mm Hg) and 3.0 mm Hg (95% CI, 0.55–5.46 mm Hg), respectively, in SBP. These predictions reflect exposure data used in our study.
Biological Mechanisms
Research on mechanisms mediating PR's hypertensive effects is limited. However, the biological mechanisms for the circulatory disease effects of radiation have been reviewed in the literature.3, 12 At high radiotherapeutic doses (the amount of energy deposited by radiation in matter), the adverse effect on capillaries and endothelial cells may explain effects on the heart and the circulatory system.12 At lower doses, many inflammatory markers are upregulated after exposure to radiation. For low doses, anti‐inflammatory effects have been observed.3, 39 This indicates that the adverse effects of ionizing radiation in the low‐dose range would not directly result from inflammation. Adams et al40 suggest that radiation‐induced renal dysfunction may be a factor in increased circulatory disease after whole‐body irradiation.
The mechanisms mediating particulate air pollution have been investigated but are not entirely understood. Plasma markers of systemic oxidative stress and inflammation have been associated with BC exposure in epidemiologic studies.41, 42 Other pathways by which BC may elevate BP include activation of the sympathetic nervous system, alterations in blood coagulability, and direct vasoconstriction.38 However, much of our understanding of the potential mechanisms of BC cardiotoxicity is informed by studies on PM. PM2.5 (and BC) effects include development of pulmonary and systemic inflammation and oxidative damage attributable to pulmonary and systemic effects.43, 44, 45, 46 Particles translocated into the lymphatics and the circulation may contribute to a systemic inflammatory response.47 These mechanisms may interact. For example, oxidative stress may promote inflammatory activity, and systemic oxidative stress and inflammation may promote or induce endothelial dysfunction by reducing levels of NO, a vasodilator important in maintaining vascular tone.48
Limitations
There is potential for confounding by factors unaccounted for in our study. These may include exposure to environmental tobacco smoke, because we only measured personal smoking. Another possible unmeasured confounder is road noise, which has been associated with cardiovascular outcomes in previous studies.49 Having considered most key confounders, we do not expect unmeasured confounding to have a considerable impact on our results. Our study population was homogeneous, consisting entirely of elderly men, 97% of whom were white. Thus, these results cannot be generalized to other populations without further research on how effects vary by age, sex, and race.
In our study, a single monitoring site was used for the air pollution measurements, as has been used in previous studies on the same NAS cohort.21, 37 We assumed the measurement error of the air pollutant concentrations to be primarily Berkson error. Previous epidemiological research supports this assumption for air pollution exposures determined at a central monitoring site.50 However, reducing measurement error may lead to less biased predictions for spatially heterogeneous air pollutants, such as BC and PN.
The PR exposures used in this study were acquired from the US EPA's RadNet monitoring network. As per the US EPA's protocol, integrated filter samples are collected over several days (typically from 5 to 7 days).33 In contrast, the air pollution concentrations used in the study were measured daily. Because PM bound gross β activity is measured 5 hours after the end of the multiday sampling period, a considerable fraction of short‐lived radionuclides have decayed and their contribution to PR exposures may not be reflected by the measurements.
In our study, we use PM bound gross β activity as a surrogate for PR, whereas particles also emit α and γ radiation also. Previous research has shown that gross α activity is correlated with β activity,27 whereas γ rays may or may not be correlated with the β activity. The air pollutants considered in the study (namely, PM2.5, BC, and PN) are determined on the basis of PM2.5 samples (including fine and ultrafine particles). However, β activity is measured from total suspended particles (up to 30 μm in diameter, including ultrafine, fine, and coarse particles). Therefore, the radioactivity that the β activity represents may be associated with both fine and coarse particles. Despite this, we find that PR is a strong predictor of DBP and SBP in our NAS cohort, with effects of a similar magnitude to those observed for the air pollutants studied.
In our study, we did not evaluate total radiation doses for several reasons. First, we used β activity as a surrogate for total PR, whereas PR may also include α and γ radiation. Second, we do not know the radionuclide source of the β activity.
Conclusion
For the past 30 years, numerous studies have reported a large spectrum of health effects associated with particulate air pollution. To date, little is known about the chemical, physical, and biological properties that might be responsible for their toxicity. In this study, we demonstrate that PR (using β activity as a surrogate) can induce similar BP effects to particles. Specifically, we suggest that radionuclides, on inhalation, deposition, and translocation, can subsequently lead to systemic inflammation and oxidative stress. Our findings of a relation between PR and BP, if confirmed, may have important implications because of widespread exposure to low levels of ionizing radiation across the United States and beyond. Understanding these fundamental mechanisms of injury will inform future public health and environmental policy worldwide.
It is well known that PM2.5, BC, and PN are robust predictors of air pollution–related effects, and PM is classified as one of the leading causes of cardiovascular‐related mortality. Therefore, identifying other environmental exposures, including PR, and biological mechanisms leading to similar cardiovascular effects will be a clinically relevant research topic of great public health importance.
Sources of Funding
This publication was made possible by a US Environmental Protection Agency (EPA) grant (RD‐835872‐01) through the Harvard University US EPA sponsored Air, Climate, and Environment Centre. The contents of the study are solely the responsibility of the grantee and do not necessarily represent the official views of the US EPA. Furthermore, the US EPA does not endorse the purchase of any commercial products or services mentioned in the publication. This publication was also funded by National Institutes of Health grants (P01‐ES009825 and R01‐ES019853) and the National Institute of Environmental Health Sciences (P30‐ES000002). The Veterans Administration (VA) Normative Aging Study is supported by the Cooperative Studies Program/Epidemiology Research and Information Center of the Department of Veteran Affairs and is a component of the Massachusetts Veterans Epidemiology Research and Information Center. This study was also supported by resources and the use of facilities at the VA Boston Healthcare System.
Disclosures
None.
(J Am Heart Assoc. 2018;7:e008245. DOI: 10.1161/JAHA.117.008245.)
References
- 1. Kamiya K, Ozasa K, Akiba S, Niwa O, Kodama K, Takamura N, Zaharieva EK, Kimura Y, Wakeford R. From Hiroshima and Nagasaki to Fukushima 1: long‐term effects of radiation exposure on health. Lancet. 2015;386:469–478. [DOI] [PubMed] [Google Scholar]
- 2. Little M, Azivova TV, Bazyka D, Bouffler SD, Cardis E, Chekin S, Chumak VV, Cucinotta FA, de Vathaire F, Hall P, Harrison JD, Hildebrandt G, Ivanov V, Kashcheev VV, Klymenko SV, Kreuz M, Laurent O, Ozasa K, Schneider T, Tapio S, Taylor AM, Tzoulaki I, Vandooleaghe WL, Wakeford R, Zablotska LB, Zhang W, Lipshultz SE. Systematic review and meta‐analysis of circulatory disease from exposure to low‐level ionizing radiation and estimates of potential population mortality risks. Environ Health Perspect. 2012;120:1503–1511. [DOI] [PMC free article] [PubMed] [Google Scholar]
- 3. Little M. A review of non‐cancer effects, especially circulatory and ocular diseases. Radiat Environ Biophys. 2013;52:435–449. [DOI] [PMC free article] [PubMed] [Google Scholar]
- 4. Ozasa K, Shimizu Y, Suyama A, Kasagi F, Soda M, Grant EJ, Sakata R, Sugiyama H, Kodama K. Studies of the mortality of atomic bomb survivors, report 14, 1950‐2003: an overview of cancer and noncancer diseases. Radiat Res. 2012;177:229–243. [DOI] [PubMed] [Google Scholar]
- 5. Azizova TV, Muirhead CR, Druzhinina MB, Grigoryeva ES, Vlasenko EV, Sumina MV, O'Hagan JA, Zhang W, Haylock RG, Hunter N. Cardiovascular diseases in the cohort of workers first employed at Mayak PA in 1948‐1958. Radiat Res. 2010a;174:155–168. [DOI] [PubMed] [Google Scholar]
- 6. Drubay D, Caёr‐Lorho S, Laroche P, Laurier D, Rage E. Mortality from circulatory system diseases among French uranium miners: a nested case‐control study. Radiat Res. 2015;183:550–562. [DOI] [PubMed] [Google Scholar]
- 7. Krestinina LY, Epifanova S, Silkin S, Mikryukova L, Degteva M, Shagina N, Akluyev A. Chronic low‐dose exposure in the Techa River Cohort: risk of mortality from circulatory diseases. Radiat Environ Biophys. 2013;52:47–57. [DOI] [PubMed] [Google Scholar]
- 8. Kreuzer M, Auvinen A, Cardis E, Hall J, Jourdain JR, Laurier D, Little MP, Peters A, Raj K, Russell NC, Tapio S, Zhang W, Gomolka M. Low‐dose ionizing radiation and cardiovascular disease: strategies for molecular epidemiological studies in Europe. Mutat Res Rev Mutat Res. 2015;764:90–100. [DOI] [PubMed] [Google Scholar]
- 9. Vrijkeid M, Cardis E, Asmore P, Auvinen A, Bae JM, Engels H, Gilbert E, Gulis G, Habib R, Howe G, Kurtinaitis J, Malker H, Muirhead C, Richardson D, Rodriguez‐Artalejo F, Rogel A, Schubauer‐Berigan M, Tardy H, Telle‐Lamberton M, Usel M, Veress K. Mortality from diseases other than cancer following low doses of ionizing radiation: results from the 15‐Country Study of nuclear industry workers. Int J Epidemiol. 2007;36:1126–1135. [DOI] [PubMed] [Google Scholar]
- 10. Adams MJ, Hardenbergh PH, Constine LS, Lupshultz SE. Radiation‐associated cardiovascular disease. Crit Rev Oncol Hematol. 2003;45:55–75. [DOI] [PubMed] [Google Scholar]
- 11. Rygiel K. Cardiotoxic effects of radiotherapy and strategies to reduce them in patients with breast cancer: an overview. J Cancer Res Ther. 2017;13:186–192. [DOI] [PubMed] [Google Scholar]
- 12. Schultz‐Hector S, Trott KR. Radiation‐induced cardiovascular diseases: is the epidemiologic evidence compatible with the radiobiological data? Int J Radiat Oncol Biol Phys. 2007;67:10–18. [DOI] [PubMed] [Google Scholar]
- 13. ICRP . The 2007 recommendations of the international commission on radiological protection: ICRP publication 103. Ann ICRP. 2007;37:1–332. [DOI] [PubMed] [Google Scholar]
- 14. US National Academy of Sciences . National Research Council Committee to Assess Health Risks From Exposure to Low Levels of Ionizing Radiation. Health risks from exposure to low levels of ionizing radiation. BEIR VII Phase 2. Washington, DC: National Academies Press; 2006; 13. [Google Scholar]
- 15. Brook RD, Bard RL, Burnett RT, Shin HH, Vette A, Croghan C, Philips M, Rodes C, Thornburg J, Williams R. Differences in blood pressure and vascular responses associated with ambient fine particulate matter exposures measured at the personal versus community level. Occup Environ Med. 2011;68:224–230. [DOI] [PubMed] [Google Scholar]
- 16. Brook RD, Rajagopalan S, Pope CA III, Brook JR, Bhatnagar A, Diez‐Roux AV, Holguin F, Hong Y, Luepker RV, Mittleman MA, Peters A, Siscovich D, Smith SC, Whitsel L. Particulate matter air pollution and cardiovascular disease: an update to the scientific statement from the American Heart Association. Circulation. 2010;121:2331–2378. [DOI] [PubMed] [Google Scholar]
- 17. Brook RD, Urch B, Dvonch JT, Bard RL, Speck M, Keeler G, Morishita M, Marsik FJ, Kamal AS, Karciroti N, Harkema J, Corey P, Silverman F, Gold DR, Wellenius G, Mittleman MA, Rajagopalan S, Brook JR. Insights into the mechanisms and mediators of the effects of air pollution exposure on blood pressure and vascular function in healthy humans. Hypertension. 2009;54:659–667. [DOI] [PMC free article] [PubMed] [Google Scholar]
- 18. Tonne C, Melly S, Mittleman M, Coull B, Goldberg R, Schwartz J. A case‐control analysis of exposure to traffic and acute myocardial infarction. Environ Health Perspect. 2007;115:53–57. [DOI] [PMC free article] [PubMed] [Google Scholar]
- 19. Wellenius GA, Schwartz J, Mittleman MA. Particulate air pollution and hospital admissions for congestive heart failure in seven United States cities. Am J Cardiol. 2006;97:404–408. [DOI] [PubMed] [Google Scholar]
- 20. Auchincloss AH, Diez Roux AV, Dvonch JT, Brown PL, Barr G, Daviglus ML. Associations between recent exposure to ambient fine particulate matter and blood pressure in the multi‐ethic study of atherosclerosis (MESA). Environ Health Pespect. 2008;116:486–491. [DOI] [PMC free article] [PubMed] [Google Scholar]
- 21. Bind MA, Peters A, Koutrakis P, Coull B, Vokonas P, Schwartz J. Quantile regression analysis of the distributional effects of air pollution on blood pressure, heart rate variability, blood lipids, and biomarkers of inflammation in elderly American men: the Normative Aging Study. Environ Health Perspect. 2016;124:1189–1198. [DOI] [PMC free article] [PubMed] [Google Scholar]
- 22. Dvonch JT, Kannan S, Schulz AJ, Keeler GJ, Mentz G, House J, Benjamin A, Max P, Bard RL, Brook RD. Acute effects of ambient particulate matter on blood pressure: differential effects across urban communities. Hypertension. 2009;53:853–859. [DOI] [PMC free article] [PubMed] [Google Scholar]
- 23. Hoffmann B, Luttmann‐Gibson H, Cohen A, Zanobetti A, de Souza C, Foley C, Suh HH, Coull BA, Schwartz J, Mittleman M, Stone P, Horton E, Gold DR. Opposing effects of particle pollution, ozone, and ambient temperature on arterial blood pressure. Environ Health Perspect. 2012;120:241–246. [DOI] [PMC free article] [PubMed] [Google Scholar]
- 24. Harrabi I, Rondeau V, Dartigues JF, Tessier JF, Fileul L. Effects of particulate air pollution on systolic blood pressure: a population‐based approach. Environ Res. 2006;101:89–93. [DOI] [PubMed] [Google Scholar]
- 25. Ibald‐Mulli A, Timonen KL, Peters A, Heinrich J, Wölke G, Lanki T. Effects of particulate air pollution on blood pressure and heart rate in subjects with cardiovascular disease: a multicenter approach. Environ Health Perspect. 2004;112:369–377. [DOI] [PMC free article] [PubMed] [Google Scholar]
- 26. Dueñas C, Fernández MC, Liger E, Carretero J. Gross alpha, gross beta activities and 7Be concentrations in surface air: analysis of their variations and prediction model. Atmos Environ. 1999;33:3705–3715. [Google Scholar]
- 27. Hernández F, Hernández‐Armas J, Catalán A, Fernández‐Aldecoa JC, Karlsson L. Gross alpha, gross beta activities and gamma emitting radionuclides composition of airborne particulate samples in an oceanic island. Atmos Environ. 2004;39:4057–4066. [Google Scholar]
- 28. UNSCEAR . Volume I: Effects of Ionizing Radiation Exposure. UNSCEAR Report 2006. New York, NY: United Nations Scientific Committee on the Effects of Atomic Radiation; 2008. [Google Scholar]
- 29. IARC (International Agency for Research on Cancer) . IARC Monographs on the Evaluation of Carcinogenic Risks to Humans: Volume 78: Ionizing Radiation, Part 2: Some Internally Deposited Radionuclides. Lyon, France: IARC Working Group on the Evaluation of Carcinogen Risks to Humans, World Health Organization, IARC Press; 2001. [PMC free article] [PubMed]
- 30. Kendall GM, Smith TJ . Doses to organs and tissues from radon and its decay products. J Radiol Prot. 2002;22:389–406. [DOI] [PubMed] [Google Scholar]
- 31. Turner MC, Krewski D, Chen Y, Pope CA, Gapstur SM, Thun MJ. Radon and lung cancer in the American Cancer Society cohort. Cancer Epidemiol Biomarkers Prev. 2011;20:438–448. [DOI] [PubMed] [Google Scholar]
- 32. WHO . WHO Handbook on Indoor Radon: A Public Health Perspective. Geneva, Switzerland: World Health Organization; 2009. [PubMed] [Google Scholar]
- 33. USEPA (US Environmental Protection Agency) . RadNet Monitoring Network. 2017. https://www.epa.gov/radnet. Accessed January 1, 2017.
- 34. Bell B, Rose CL, Damon A. The normative aging study: an interdisciplinary and longitudinal study of health and aging. Agin Hum Dev. 1972;3:4–17. [Google Scholar]
- 35. Hu H, Aro A, Payton M, Korrick S, Sparrow D, Weiss ST, Rotnitzky A. The relationship of bone and blood lead to hypertension: the Normative Aging Study. JAMA. 1996;275:1171–1176. [PubMed] [Google Scholar]
- 36. Foraster M, Basagaña X, Aguilera I, Rivera M, Agis D, Bouso L, Deltell A, Marrugat J, Ramos R, Sunyer J, Vila J, Elosua R, Kunzli N. Association of long‐term exposure to traffic‐related air pollution with blood pressure and hypertension in an adult population‐based cohort in Spain (the REGICOR study). Environ Health Perspect. 2014;122:404–411. [DOI] [PMC free article] [PubMed] [Google Scholar]
- 37. Mordukhovich I, Wilker E, Suh H, Wright R, Sparrow D, Vokonas PS, Schwartz J. Black carbon exposure oxidative stress genes, and blood pressure in a repeated‐measures study. Environ Health Perspect. 2009;117:1767–1772. [DOI] [PMC free article] [PubMed] [Google Scholar]
- 38. Schwartz J, Alexeeff SE, Mordukhovich I, Gryparis A, Vokonas P, Suh H, Coull BA. Association between long‐term exposure to traffic particles and blood pressure in the Veterans Administration Normative Aging Study. Occup Environ Med. 2012;69:422–427. [DOI] [PMC free article] [PubMed] [Google Scholar]
- 39. Mitchel RE, Hasu M, Bugden M, Wyatt H, Little MP, Gola A, Hildebrandt G, Priest ND, Whitman SC. Low‐dose radiation exposure and atherosclerosis in ApoE −/− mice. Radiat Res. 2011;175:665–676. [DOI] [PMC free article] [PubMed] [Google Scholar]
- 40. Adams MJ, Grant EJ, Kodama K, Shimizu Y, Kasagi F, Suyama A, Sakata R, Akahoshi M. Radiation dose associated with renal failure mortality: a potential pathway to partially explain increased cardiovascular disease mortality observed after whole‐body irradiation. Radiat Res. 2012;177:220–228. [DOI] [PMC free article] [PubMed] [Google Scholar]
- 41. Delfino RJ, Staimer N, Tjoa T, Polidori A, Arhami M, Gillen DL. Circulating biomarkers of inflammation, antioxidant activity, and platelet activation are associated with primary combustion aerosols in subjects with coronary heart disease. Environ Health Perspect. 2008;116:898–906. [DOI] [PMC free article] [PubMed] [Google Scholar]
- 42. Sørensen M, Daneshvar B, Dragsted LO, Hertel O, Knudsen L, Loft S. Personal PM2.5 exposure and markers of oxidative stress in blood. Environ Health Perspect. 2003;111:161–166. [DOI] [PMC free article] [PubMed] [Google Scholar]
- 43. De Kok TM, Driece HA, Hogervorst JG, Briede JJ. Toxicological assessment of ambient and traffic‐related particulate matter: a review of recent studies. Mutat Res. 2006;613:103–122. [DOI] [PubMed] [Google Scholar]
- 44. Dubowsky SD, Suh H, Schwartz J, Coull BA, Gold DR. Diabetes, obesity, and hypertension may enhance associations between air pollution and markers of systemic inflammation. Environ Health Perspect. 2006;114:992–998. [DOI] [PMC free article] [PubMed] [Google Scholar]
- 45. Scapellato ML, Lotti M. Short‐term effects of particulate matter: an inflammatory mechanism? Crit Rev Toxicol. 2007;37:461–487. [DOI] [PubMed] [Google Scholar]
- 46. Vogel CF, Sciullo E, Wong P, Kuzmicky P, Kado N, Matsumura F. Induction of proinflammatory cytokines and C‐reactive protein in human macrophage cell line U937 exposed to air pollution particulates. Environ Health Perspect. 2005;113:1536–1541. [DOI] [PMC free article] [PubMed] [Google Scholar]
- 47. Schmid O, Moller W, Semmler‐Behnke M, Ferron GA, Karg E, Lipka J, Schulz H, Kreyling WG, Stoeger T. Dosimetry and toxicology of inhaled ultrafine particles. Biomarkers. 2009;14(suppl 1):67–73. [DOI] [PubMed] [Google Scholar]
- 48. Rajendran P, Rengarajan T, Thangavel J, Nishigaki Y, Sakthisekaran D, Sethi G, Nishigaki I. The vascular endothelium and human diseases. Int J Biol Sci. 2013;9:1057–1069. [DOI] [PMC free article] [PubMed] [Google Scholar]
- 49. Sørensen M, Hvidberg M, Hoffmann B, Andersen ZJ, Nordsborg RB, Lillelund KG, Jakobsen J, Tjonneland A, Overvad K, Raaschou‐Nielson O. Exposure to road traffic and railway noise and associations with blood pressure and self‐reported hypertension: a cohort study. Environ Health. 2011;10:92. [DOI] [PMC free article] [PubMed] [Google Scholar]
- 50. Alexeeff SE, Schwartz J, Kloog I, Chudnovsky A, Koutrakis P, Coull BA. Consequences of kriging and land use regression for PM2.5 predictions in epidemiologic analyses: insights into spatial variability using high‐resolution satellite data. J Exp Sci Environ Epidemiol. 2015;25:138–144. [DOI] [PMC free article] [PubMed] [Google Scholar]