

Abstract
Background
Intestinal microbiota have been found to be linked to cardiovascular disease via conversion of the dietary compounds choline and carnitine to the atherogenic metabolite TMAO (trimethylamine‐N‐oxide). Specifically, a vegan diet was associated with decreased plasma TMAO levels and nearly absent TMAO production on carnitine challenge.
Methods and Results
We performed a double‐blind randomized controlled pilot study in which 20 male metabolic syndrome patients were randomized to single lean vegan‐donor or autologous fecal microbiota transplantation. At baseline and 2 weeks thereafter, we determined the ability to produce TMAO from d6‐choline and d3‐carnitine (eg, labeled and unlabeled TMAO in plasma and 24‐hour urine after oral ingestion of 250 mg of both isotope‐labeled precursor nutrients), and fecal samples were collected for analysis of microbiota composition. 18F‐fluorodeoxyglucose positron emission tomography/computed tomography scans of the abdominal aorta, as well as ex vivo peripheral blood mononuclear cell cytokine production assays, were performed. At baseline, fecal microbiota composition differed significantly between vegans and metabolic syndrome patients. With vegan‐donor fecal microbiota transplantation, intestinal microbiota composition in metabolic syndrome patients, as monitored by global fecal microbial community structure, changed toward a vegan profile in some of the patients; however, no functional effects from vegan‐donor fecal microbiota transplantation were seen on TMAO production, abdominal aortic 18F‐fluorodeoxyglucose uptake, or ex vivo cytokine production from peripheral blood mononuclear cells.
Conclusions
Single lean vegan‐donor fecal microbiota transplantation in metabolic syndrome patients resulted in detectable changes in intestinal microbiota composition but failed to elicit changes in TMAO production capacity or parameters related to vascular inflammation.
Clinical Trial Registration
URL: http://www.trialregister.nl. Unique identifier: NTR 4338.
Keywords: atherosclerosis, cardiovascular disease, cardiovascular imaging, inflammation, metabolism
Subject Categories: Clinical Studies, Cardiovascular Disease, Atherosclerosis, Inflammation, Metabolism
Clinical Perspective
What Is New?
Lean vegans have different microbiota composition and lower capacity to produce TMAO (trimethylamine‐N‐oxide) compared with obese omnivores.
Single lean vegan‐donor fecal microbiota transplantation in obese male patients with metabolic syndrome resulted in changes in intestinal microbiota composition, but this did not translate into altered carnitine‐ or choline‐to‐TMAO conversion, nor did it affect markers of arterial wall inflammation.
This lack of effect might be explained by the residual capacity to convert carnitine to TMAO in vegans and by limited baseline differences in intestinal microbiota composition between vegans and omnivores in conjunction with a relatively short follow‐up period of 2 weeks.
What Are the Clinical Implications?
Our data oppose the previously stated hypothesis that the intestinal microbiota in vegans is incapable of carnitine‐to‐TMAO conversion.
Nevertheless, this small pilot study was the first to directly assess the potential causal link among intestinal microbiota, TMAO metabolism, and arterial wall inflammation in humans.
Larger and better powered intervention studies with longer follow‐up periods are necessary to further unravel the link between vegan microbiota and atherosclerotic burden via TMAO metabolism.
Establishing the presence of such a link would encourage new interventions to alleviate cardiovascular risk by directly targeting the intestinal microbiota.
Intestinal microbiota are increasingly recognized as a factor underlying the pathobiology of several disease states, including cardiovascular disease (CVD). The intestinal microbiota composition in patients with symptomatic CVD differs significantly from that in healthy controls.1, 2 Moreover, DNA from intestinal microbiota has been recovered from human atherosclerotic plaques, suggesting a potentially contributory role of gut microbiota to atherosclerosis.1 Several potential mechanisms have linked altered intestinal microbiota composition and function to CVD. First, traditional cardiovascular risk factors, such as insulin resistance3 and, more recently, dyslipidemia,4 have been associated with altered intestinal microbiota composition. Because fecal microbiota transplantation (FMT) from lean to obese insulin‐resistant individuals improved the metabolic profile in the latter group,5 these findings suggest a causal role for intestinal microbiota in CVD. Second, intestinal microbiota composition affects peripheral blood mononuclear cell (PBMC) production capacity,6 which was linked to increased vascular inflammation and atherosclerosis.7
The recent discovery of TMAO (trimethylamine‐N‐oxide), a novel intestinal microbiota–related metabolite involved in atherosclerosis, provides a more direct link between intestinal microbiota and CVD. Intestinal bacteria are capable of producing TMA (trimethylamine) from endogenous and dietary phosphatidylcholine, as well as from carnitine, a nutrient mainly present in animal‐derived food products. TMA is subsequently oxidized in the liver to TMAO in a reaction catalyzed by host hepatic flavin monooxygenases, particularly flavin monooxygenase 3.8 Plasma TMAO levels were found to be related to incident CVD in large prospective observational studies, and animal‐model studies suggest a potentially causal role for TMAO in atherogenesis.9, 10, 11 In support, TMAO increased atherosclerotic lesion size in mice.9 Interestingly, individuals on a vegan diet are known to have an altered intestinal microbiota composition,12, 13 which might partly explain the diminished capacity to produce TMAO11 and the tendency toward decreased cardiovascular risk in vegans compared with omnivores.14 In contrast, omnivorous metabolic syndrome patients are known to have a 2‐fold increased cardiovascular risk15 as well as increased TMAO production.16 Plasma TMAO level in metabolic syndrome patients has been found to be an independent risk factor for CVD‐associated mortality,17 and TMAO production and associated atherosclerotic risk were transmittable by FMT in mice.18 In conjunction with the fact that inhibition of TMA lyase, a bacterial enzyme responsible for conversion of choline and carnitine to TMA, reduced TMAO levels and thus atherosclerosis in mice,19 this underscores the need for assessing a potentially causal role of intestinal microbiota in human TMAO production and, eventually, cardiovascular risk.
In the present double‐blind randomized controlled pilot study, we investigated whether single lean vegan‐donor FMT in omnivorous metabolic syndrome patients affects the intestinal microbiota composition and, subsequently, the conversion of both choline and carnitine to TMA and TMAO, compared with autologous (own feces) FMT. Moreover, we assessed the effect of vegan‐donor FMT on vascular inflammatory tone by measuring aortic wall vascular inflammation, as assessed using 18F‐fluorodeoxyglucose (18F‐FDG) uptake positron emission tomography/computed tomography (PET/CT) scanning, which is reported to be increased in metabolic syndrome patients.20 We also examined ex vivo cytokine production by PBMCs.21
Methods
The data, analytic methods, and study materials are available to other researchers for purposes of reproducing the results or replicating the procedure. The data are available from the corresponding author on reasonable request.
Study Design
In this double‐blinded, randomized, controlled, pilot study, we compared the effect of FMT in 20 obese metabolic syndrome patients using either lean, vegan‐donor feces (vegan‐donor FMT, n=10) or feces from the patients themselves (autologous FMT, n=10). Participants were randomized using a 1:1 allocation ratio. At baseline and 2 weeks after FMT, an oral stable isotope–labeled choline and carnitine challenge test (CCCT) was performed, combined with 18F‐FDG PET/CT scanning of the abdominal aorta. We also collected fasting blood samples for ex vivo cytokine production assays, as well as plasma, 24‐hour urine, and fecal samples. Vegan donors (n=9) underwent all baseline experiments including the oral stable isotope–labeled carnitine challenge test.
All study procedures were performed at the Academic Medical Center (Amsterdam, the Netherlands). The research protocol was approved by the investigational review board of the Academic Medical Center and executed according to current Good Clinical Practice guidelines (Declaration of Helsinki) and applicable national law. Written informed consent was obtained from all participants before any study procedure was performed. The study was registered in the Dutch Trial Registry (registration number NTR 4338).
Study Population
Male obese participants of West European genetic background were recruited by newspaper advertisements and screened for characteristics of the metabolic syndrome. We included male adults (aged 21–69 years) who were obese (body mass index ≥30) but otherwise healthy and who fulfilled the criteria of the metabolic syndrome (fasting glucose ≥5.6 mmol/L and ≥2 of the following criteria: triglyceride levels ≥1.7 mmol/L; high‐density lipoprotein cholesterol <1.0 mmol/L; blood pressure ≥130/85 mm Hg; waist circumference ≥102 cm), without a history of CVD, cholecystectomy, or immunodeficiency and without the use of any medication (including antibiotics and proton pump inhibitors within the preceding 3 months). Participants had to adhere to an omnivorous diet without using any type of (food) supplements, specifically choline‐ and/or carnitine‐enriched products.
Healthy, lean (body mass index 20–25), adult (aged 21–69 years) men of West European genetic backgrounds who adhered to a vegan diet were also recruited via newspaper advertisements to serve as feces donors. The detailed screening procedure for feces donors in our hospital has been published previously.22 In short, donors were initially screened using an extensive questionnaire addressing risk factors for potentially transmittable diseases. Subsequently, plasma and feces were screened for potential pathogenic parasites, bacteria, and viruses. In line with our recent publication,23 donors were screened for the presence of (antibodies to) human immunodeficiency virus; human T‐lymphotropic virus; hepatitis A, B, and C; cytomegalovirus; Epstein–Barr virus; strongyloides; amoebiasis, and lues. Presence of infection resulted in exclusion, although previous, nonactive infections with Epstein–Barr virus and cytomegalovirus were allowed. Donors were also excluded if screening of their feces revealed the presence of pathogenic parasites (eg, blastocystis hominis, dientamoeba fragilis, giardia lamblia), bacteria (Shigella, Campylobacter, Yersinia, Salmonella, enteropathogenic Escherichia coli, and Clostridium difficile) or viruses (noro‐, rota‐, astro‐, adeno (40/41/52)‐, entero‐, parecho‐, and sapovirus). As an extra safety procedure, donors were again screened for contraindications directly before every feces donation by using a second questionnaire focusing on newly developed contraindications to donorship. In addition, both metabolic syndrome patients and vegan donors had to adhere to their own diet during their participation in the study. To this end, participants recorded their diet in the 7 days preceding the CCCT via an online nutritional diary (http://mijn.voedingscentrum.nl/nl/).
Study Procedures
Choline and carnitine challenge test
After an overnight fast and plasma collection at time point 0 (t=0), participants orally ingested a capsule containing 250 mg of stable isotope–labeled d6‐choline10 together with a capsule containing 250 mg of stable isotope–labeled d3‐carnitine.11 Two hours thereafter, a standardized vegan meal, consisting of 2 slices of vegan bread with vegan jam, was given to all participants. Urine was collected in the 24 hours following stable isotope ingestion, and plasma was collected 2, 4, 6, and 24 hours after stable isotope ingestion. There were no dietary restrictions from 6 hours after start of the CCCT. In plasma (venous EDTA) and urine samples, 4 volumes of methanol containing 10 μmol/L d9‐TMA and d9‐TMAO were added to precipitate the protein. The supernatant was collected after centrifugation at 20 000g, 4°C, during 10 minutes and used for liquid chromatography/tandem mass spectrometry quantitation, as described previously.24 The distinct isotopologue (d3‐/d6‐) TMA and (d3‐/d6‐) TMAO and their respective internal standards were analyzed using high‐performance liquid chromatography with online electrospray ionization tandem mass spectrometry utilizing positive MRM mode with characteristic parent‐to‐daughter ion transitions as follows: m/z 63→47, 66→47, 69→49, 79→62, 82→65, and 85→68 for d3‐TMA, d6‐TMA, d9‐TMA, d3‐TMAO, d6‐TMAO, and d9‐TMAO, respectively. This method has a high degree of precision with total coefficient of variance <7.0% for TMAO and TMA and their respective isotopologues.24
PBMC cytokine production capacity
PBMCs were isolated from venous EDTA blood, as obtained at the CCCT (t=0), using Ficoll‐Paque density gradient centrifugation. The cells were subsequently cultured for 24 hours in the presence of 10 ng/mL E coli lipopolysaccharide (E coli serotype 055:B5), 1×10⁶ colony‐forming units (CFU)/mL heat killed E. coli, 1×10⁶ CFU/mL Bacteroides fragilis (cultured in house), or 10 μg/mL oxidized low‐density lipoprotein (isolated and oxidized, as described previously).25 IL‐1β (interleukin 1β) and TNF‐α (tumor necrosis factor α) concentrations in the supernatant were determined with commercially available ELISA kits from R&D Systems, and the ELISA kits for IL‐6 and IL‐10 were purchased from Sanquin, as published previously.6
Measurement of aortic wall inflammation by 18F‐FDG PET/CT scan
On the day following the CCCT, a PET/CT scan (Philips Gemini; Philips) of the abdominal aortic wall was performed 90 minutes after the infusion of 18F‐FDG. The FDG uptake was assessed by drawing a region of interest of ≈5 subsequent slices of the abdominal aorta, starting at the most cranial part of the liver and moving caudally. The mean of the maximized standardized FDG uptake value (maximal pixel activity per region of interest) of the 5 slices was assessed by a blinded reader. To correct for blood pool activity, a target‐to‐background value was used by dividing the mean maximized standardized FDG uptake value by the mean background activity in 5 regions of interest in the lumen of the adjacent inferior vena cava.26 Reproducibility studies from our institution have been published recently and show high interscan, interreader, and intrareader agreement with an intraclass correlation coefficient of >0.95.27
Fecal microbiota transplantation
On the day of treatment, both the metabolic syndrome patients and the vegan donors provided the investigators with a fresh morning fecal sample, stored at 4°C. Patients thereafter received bowel lavage with 2 L of a macrogol solution (Klean‐Prep; Norgine Pharmaceuticals) via a nasoduodenal tube. After bowel lavage and based on randomization, feces from either the donor (vegan‐donor FMT) or the patient (autologous FMT) was used to prepare the infusate. The complete stool production was diluted with 500 mL of sterile saline (0.9%) and subsequently stirred and filtered, resulting in a 500‐mL homogenized solution. Within 6 hours of collection of the fecal material, the solution was infused through the nasoduodenal tube. In contrast to other clinics,23 we prefer to use duodenal infusion for FMT administration rather than infusion via colonoscopy because of the potential role of the small intestine in metabolism, as well as logistical reasons and the low complication rate at our institution.
Analysis of fecal microbiota composition
DNA from fecal samples was isolated using repeated bead beating, described in detail elsewhere.28 Concentration and purity were assessed with a Nanodrop 1000 spectrophotometer (Thermo Fisher Scientific). The microbial composition was determined using a previously described and benchmarked custom‐made phylogenetic microarray, the Human Intestinal Tract Chip (HITChip).29 This is a custom‐made Agilent microarray containing ≈5500 specific oligonucleotide probes. In short, the full‐length 16S rRNA gene was amplified, transcribed into RNA, labeled with the fluorescent dyes Cy3 and Cy5, and hybridized to the array. Each sample was hybridized twice with a Pearson correlation of >0.98 between replicates to ensure that reproducibility and raw signal intensities were normalized, as described previously.30
The HITChip microarray can detect 1033 species‐like bacterial phylotypes (level 3, >98% 16S rRNA gene sequence similarity) that represent the majority of the microbial diversity in the human intestine. These were summarized to 130 genuslike phylogenetic groups (level 2, >90% 16S rRNA gene sequence similarity), referred to as species and relatives. Diversity of the microbiota was quantified based on nonlogarithmized HITChip oligo‐level signals by the Shannon index using the “vegan” package (R version 2013, Community ecology package). Probes were counted in each sample to measure richness by using an 80% quantile threshold for detection.
Sample size calculation and end points
In line with our previous proof‐of‐concept study on the effects of lean omnivorous donor FMT on insulin sensitivity in men with the metabolic syndrome5 and based on a murine study on FMT and TMAO,18 we aimed to detect a 20% reduction in postprandial incremental area under the curve (AUC) of plasma TMAO levels (from d6‐labeled choline and d3‐labeled carnitine) with vegan donor FMT with an SD of 15%, whereas a 5% difference was expected with autologous FMT. Using an unpaired 2‐sided t test (with α=0.025 and 80% power), the estimated sample size needed was 18 metabolic syndrome patients for each treatment arm. Estimating dropout of 10%, we aimed to include 20 metabolic syndrome patients per arm. Moreover, we aimed to include 10 vegan FMT donors. Between October 2013 and November 2015, a total of 2×10 men with metabolic syndrome and 9 male vegan donors were included (1 donor was used for 2 vegan‐donor FMTs). A futility analysis was performed based on postprandial TMAO changes and showed a conditional power of 11%, suggesting that even with 20 participants per treatment arm, we would not achieve significant differences after treatment. We therefore decided to prematurely terminate the study. The primary end point of the study was the change in incremental AUC of postprandial TMAO from d6‐labeled choline and d3‐labeled carnitine as well as changes in intestinal microbiota composition 2 weeks after vegan‐donor FMT. The secondary end points were effects of vegan‐donor FMT on vessel wall inflammation, as assessed by 18F‐FDG PET/CT scan, as well as ex vivo PBMC‐derived cytokine production.
Randomization and blinding
An independent physician used computerized block randomization, using blocks of 4 patients, to ensure balanced inclusion rates in case inclusion targets were not reached. This did not incorporate stratification to ensure equal demographic and metabolic parameters between both treatment groups. Treatment days were planned after ascertaining availability of a recipient and donor on the same day. Allocation of treatment was determined by chronologically following the randomization file. At the day of FMT, the independent physician revealed the intended treatment to the research assistant, who provided the trial physician with the fecal material from either the assigned donor or metabolic syndrome patient. The study participants (eg, vegan donors and metabolic syndrome patients) and all trial physicians (including all authors) were blinded for the treatment until completion of the trial.
Statistical Analyses
All data are presented as mean (SD) or median (interquartile range [IQR]), depending on the distribution of the data. Differences between vegan donors and metabolic syndrome patients were tested using a Student t test for normally distributed data and a Mann–Whitney U test for nonnormal distributed data. The effect of FMT on d3‐ and d6‐TMA and ‐TMAO plasma and urine markers as well as 18F‐FDG uptake was tested using a paired t test or Wilcoxon signed rank test, depending on the data distribution. A P value <0.05 was considered significant. The microbiota data were corrected for multiple testing, as described below.
Fecal microbiota that allowed accurate discrimination among groups of patients (vegan‐donor versus autologous FMT) were selected by means of the elastic net algorithm.31 The elastic net method is applicable to structured and high‐dimensional data. It is a regularized method that combines the advantages of 2 techniques: LASSO and ridge regression as previously published by our group.32 This combination allows for the selection of the most important microbiota while taking the correlation (“grouping effect”) among them into account. We used an adapted version of the elastic net algorithm (with Hinge loss function). Although the microbiota identified by the elastic net algorithm frequently lead to statistically significant results, they can also be unstable. In our approach, we addressed this problem via a stability‐selection procedure33 coupled with model selection. Bacterial stability is reflected in the frequency that a particular bacterium was identified in multiple simulations on a rerandomized data set. This measure is especially relevant for small‐ to medium‐sized data collections, as in this study, for which the number of patients was limited. To avoid overfitting, we used a 10‐fold stratified cross‐validation procedure over the training partition of the data (80%), and the remaining 20% were used as the testing data set. Stability selection was performed by randomly subsampling 80% of the data 100 times. During the stability‐selection procedure, all features having a nonzero weight coefficient were counted. These counts were normalized and converted to stability coefficients having a value between 1.0 (for the feature that was always selected) and 0.0 for the feature that was never selected. We used Python (version 2.7.8, packages Numpy and Scipy) for implementing the elastic net model and R version 3.1.2 for visualization.
A randomization test was conducted to evaluate the statistical validity of the results obtained via the elastic net algorithm. We followed the procedure in which the outcome variable (vegan‐donor versus autologous FMT) was randomly reshuffled while the corresponding microbiota profiles were kept intact. This was repeated up to 100 times and receiver operating characteristic area under the curve scores were computed each time. To study the dynamics of the microbiota, we computed the relative change for each individual patient over time. To assess the amount of change in intestinal microbiota composition per patient per consecutive interval, we computed the magnitude of change using L2 norm. To visualize and study correlations among the patients at different time points, we used redundancy analysis.34 Redundancy analysis can be considered a constrained version of principal components analysis, in which the canonical axes are built from linear combinations of the response variables. Redundancy analysis extends multiple linear regression by allowing regression of multiple response variables on multiple explanatory variables.
Results
In total, we included 20 metabolic syndrome patients and 9 vegan feces donors. None of the included participants was prematurely lost to follow‐up after randomization. However, technical failure prevented analyses of PET/CT scans for 3 metabolic syndrome patients (1 baseline scan before vegan‐donor FMT, 1 baseline scan before autologous FMT, and 1 posttreatment scan after vegan‐donor FMT) and 1 vegan donor. In addition, no incremental AUC for plasma d3‐TMAO was available for 2 metabolic syndrome patients because of missing samples at time point 24 hours (t=24) (1 before vegan‐donor FMT, 1 before autologous FMT). Unlabeled plasma TMAO and 24‐hour urine TMA, TMAO, d3‐TMA, and d3‐TMAO excretion was available for all patients for baseline and after FMT.
Metabolic syndrome patients were older (55.0 versus 33.4 years, P=0.002), had higher body mass index (33.9 versus 22.9, P<0.001) and had increased cardiovascular risk profiles compared with vegan donors, as a result of the study design (Table). Cardiovascular risk factors were similar at baseline between metabolic syndrome patients randomized to treatment with autologous or vegan‐donor FMT. No serious adverse events were reported in either study group. We also observed no changes in safety laboratory parameters (eg, hematology, renal function, liver chemistry) on vegan‐donor FMT (Table S1), and vegan‐donor FMT did not affect vital signs (eg, pulse rate, blood pressure; data not shown). In line, dietary intake was not affected by either vegan or autologous FMT (Tables S2 and S3). In the autologous FMT group, some baseline parameters significantly decreased with treatment (eg, hemoglobin, alanine aminotransferase, cholesterol, triglycerides) but remained within the normal range throughout follow‐up.
Table 1.
Baseline Characteristics
| Metabolic Syndrome Patients, All (n=20) | Vegan Donors (n=9) | P Value | Metabolic Syndrome Patients, Autologous FMT (n=10) | Metabolic Syndrome Patients, Vegan‐Donor FMT (n=10) | P Value | |
|---|---|---|---|---|---|---|
| Age, y | 55.0±8.2 | 33.4±14.8 | 0.002 | 57.7±8.5 | 52.3±7.4 | 0.15 |
| BMI, kg/m2 | 33.9±3.8 | 22.9±1.7 | <0.001 | 33.8±4.0 | 33.9±3.9 | 0.94 |
| Pulse, bpm | 65.9±12.5 | 70.7±9.9 | 0.32 | 67.8±13.2 | 63.9±12.2 | 0.50 |
| SBP, mm Hg | 150.2±12.3 | 130.6±6.2 | <0.001 | 152.2±12.5 | 148.2±12.4 | 0.48 |
| DBP, mm Hg | 93.1±9.0 | 78.9±6.6 | 0.001 | 93.3±8.3 | 92.8±10.1 | 0.91 |
| Glucose, mmol/L | 6.0±0.8 | 5.1±0.3 | <0.001 | 6.18±0.9 | 5.8±0.5 | 0.25 |
| Insulin, miU/L | 126.1±55.3 | 50.9±31.2 | 0.001 | 107.7±45.5 | 144.5±60.3 | 0.14 |
| HbA1C, mmol/mol | 37.8±4.4 | 34.0±3.4 | 0.03 | 38.7±3.6 | 36.9±5.1 | 0.37 |
| Cholesterol, mmol/L | 5.3±0.8 | 4.1±1.2 | 0.02 | 5.3±0.8 | 5.3±0.9 | 0.90 |
| HDL‐C, mmol/L | 1.1±0.2 | 1.3±0.3 | 0.28 | 1.2±0.2 | 1.1±0.2 | 0.74 |
| LDL‐C, mmol/L | 3.3±1.0 | 2.5±1.0 | 0.1 | 3.1±1.3 | 3.5±0.7 | 0.37 |
| Triglycerides, mmol/L | 1.30 (1.05–1.53) | 0.82 (0.53–0.90) | 0.006 | 1.30 (1.06–1.57) | 1.27 (1.01–1.56) | 0.82 |
| CRP, mg/mL | 1.50 (0.88–4.38) | 0.50 (0.40–0.80) | 0.005 | 1.90 (1.15–4.50) | 1.45 (0.80–4.25) | 0.65 |
Data are depicted as mean±SD or median (interquartile range), depending on their distribution. P<0.05 was considered significant. BMI indicates body mass index; CRP, C‐reactive protein; DBP, diastolic blood pressure; FMT, fecal microbiota transplantation; HbA1c, glycated hemoglobin; HDL‐C, high‐density lipoprotein cholesterol; LDL‐C, low‐density lipoprotein cholesterol; SBP, systolic blood pressure.
Baseline Fecal Microbiota Composition and TMAO Metabolism in Metabolic Syndrome and Vegan Participants
We observed a nonsignificant trend toward decreased fecal microbial diversity in vegans versus metabolic syndrome patients (Shannon index: 5.9 [IQR: 5.8–6.0] versus 6.0 [IQR: 5.9–6.1], P=0.08; Figure 1A), although the variation within the metabolic syndrome group was rather large and the absolute difference small. Redundancy analysis showed a distinction in fecal microbiota composition between the vegan donors and the metabolic syndrome patients (Figure 1B). Among others, bacteria related to Anaerostipes caccae and Lachnobacterium were associated with a vegan diet, whereas several groups belonging to the Clostridium genus were related to metabolic syndrome patients (Figure 1C).
Figure 1.
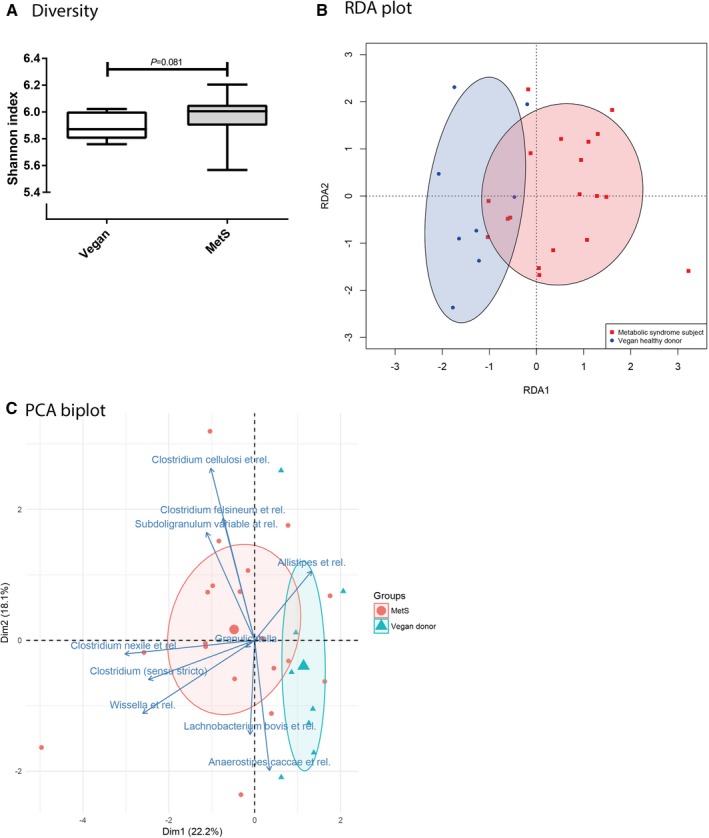
Fecal microbiota diversity and composition in metabolic syndrome patients vs lean vegan FMT donors. A, Baseline fecal microbiota diversity of lean vegan FMT donors (Vegan) and obese omnivorous metabolic syndrome patients (MetS), expressed as Shannon index. Data are depicted as box‐and‐whisker plots. P<0.05 was considered significant. B, RDA plot showing baseline fecal microbiota composition of lean vegan FMT donors and obese omnivorous metabolic syndrome patients. Ellipse curves represent the spread and distribution of the participants for both groups in 2‐dimensional RDA subspace. C, PCA biplot depicting 10 individual fecal microbiota genera that differentiated between lean vegan FMT donors and obese omnivorous metabolic syndrome patients at baseline. Both individual microbiota data and grouped microbiota data are shown (small or large symbols). Ellipse curves represent the spread and distribution of the participants for both groups in 2‐dimensional PCA subspace. Dim indicates dimension; FMT, fecal microbiota transplantation; PCA, principal components analysis; RDA, redundancy analysis.
With respect to TMAO production, fasting plasma concentrations of TMAO (3.7 μmol/L [IQR: 2.7–4.9 μmol/L] versus 2.8 μmol/L [IQR: 1.9–3.4 μmol/L], P=0.13; Figure 2A) did not differ significantly between metabolic syndrome patients and vegan donors. However, 24‐hour urinary excretion of TMAO was significantly higher in metabolic syndrome patients versus vegan donors (529 μmol [IQR: 239–1407 μmol] versus 178 μmol [IQR: 98–338 μmol], P=0.03), whereas 24‐hour urinary TMA excretion was not significantly different between both groups at baseline (10.3 μmol [IQR: 3.9–23.9 μmol] versus 7.6 μmol [IQR: 3.1–13.6 μmol], P=0.35).
Figure 2.
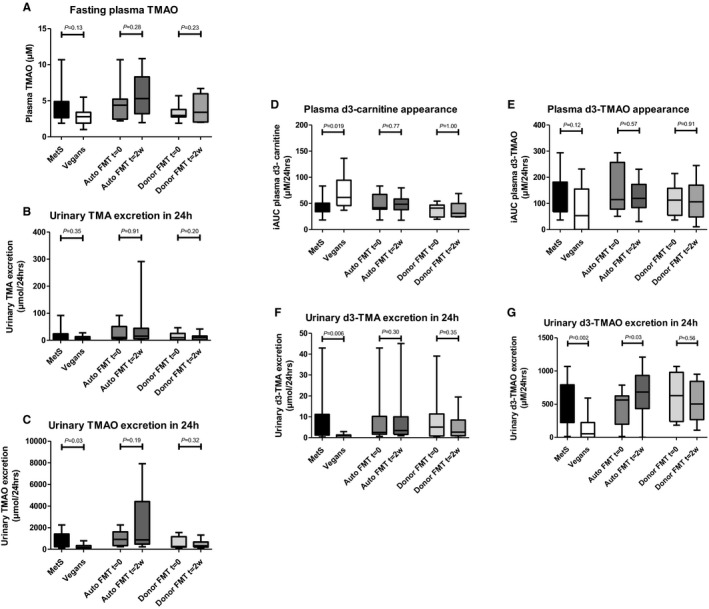
Unlabeled plasma and urine TMA/TMAO‐ and d3‐carnitine‐derived plasma and urine metabolites: metabolic syndrome patients vs lean vegan FMT donors, and the effect of lean vegan donor FMT. A through C, Unlabeled plasma and urine TMA/TMAO data comparing lean vegan FMT donors and obese metabolic syndrome subjects and depicting changes after either autologous or lean vegan‐donor FMT. Graph (A) shows fasting plasma TMAO data, whereas Graphs (B and C) show urinary excretion of TMA/TMAO during 24 hours after carnitine and choline challenge. The d3‐labeled carnitine data are shown in Graphs (D through G), including metabolites TMA/TMAO in plasma and urine. Again, lean vegan FMT donors are compared with obese metabolic syndrome subjects, and changes after either autologous or lean vegan‐donor FMT are shown. Plasma data represent iAUCs at 24 hours after carnitine ingestion (Graphs D and E), whereas urinary data comprise total urinary excretion during 24 hours after carnitine ingestion (Graphs F and G). Data are presented as box‐and‐whisker plots. P<0.05 was considered significant. Auto FMT indicates autologous FMT; Donor FMT, lean vegan‐donor FMT; FMT, fecal microbiota transplantation; iAUC, incremental area under the curve; MetS, obese omnivorous metabolic syndrome patients; t=0/2w, time point 0/2 weeks; TMA, trimethylamine; TMAO, trimethylamine‐N‐oxide; Vegans, lean vegan fecal microbiota transplantation donors.
To further study the capacity to convert choline and carnitine to TMA and TMAO, a d3‐carnitine/d‐choline challenge test was performed. After oral administration of d3‐carnitine, a similar pattern was observed compared with unlabeled TMAO. Although not significant, postprandial plasma appearance of d3‐TMAO was higher in metabolic syndrome patients than vegans (AUC [in μmol/L per 24 hours]: 114 [IQR: 68–182] versus 53 [IQR: 0–155], P=0.12), and urinary excretion of both d3‐TMA (AUC [in μmol/L per 24 hours]: 3.7 [IQR: 1.2–11.1] versus 0.9 [IQR: 0–1.4], P=0.006) and d3‐TMAO (AUC [in μmol/L per 24 hours]: 562 [IQR: 225–793] versus 54 [IQR: 0–224], P=0.002) was significantly increased in metabolic syndrome patients versus vegan donors (Figure 2B). In line, plasma appearance of d3‐carnitine was significantly higher in vegans compared with metabolic syndrome patients. Remarkably, d6‐labeled choline—and, consequently, d6‐TMA and d6‐TMAO in plasma and in urine—was almost absent after oral d6‐choline administration (Figure S1) in both metabolic syndrome patients and vegans, with no baseline difference between groups.
Fecal Microbiota Composition and TMAO Metabolism With FMT
We found no changes in fecal microbiota diversity (Shannon index) 2 weeks after either vegan donor FMT (from 6.0 [IQR: 5.9–6.1] to 6.1 [IQR: 5.9–6.2], P=0.260) or autologous FMT (from 6.0 [IQR: 5.9–6.0] to 6.0 [IQR: 5.7–6.1], P=0.721; Figure 3A), However, vegan‐donor FMT did affect intestinal microbiota composition in metabolic syndrome patients, with changes toward a more veganlike profile in some, but not all, patients (Figure 3B). Compared with autologous FMT, changes in fecal microbiota abundance with vegan FMT were seen in, among others, several groups belonging to the Lachnospiraceae, including bacteria related to Bryantella formatexigens and Megamonas hypermegale as well as L bovis. In contrast, autologous FMT resulted in minor shifts in microbiota composition and was primarily associated with changes in the abundance of bacteria related to Alcaligenes faecalis and Akkermansia (Figure 3C). With respect to TMAO, vegan‐donor FMT did not affect fasting plasma TMAO levels or 24‐hour urinary excretion of labeled and unlabeled TMA or TMAO (Figure 2 and 2B, Figure S1). Although autologous FMT did not influence plasma TMAO levels, and despite the large variation, it did result in a significant increase in urinary excretion of d3‐TMAO (from 562 [IQR: 200–625] to 683 [IQR: 434–933] μmol/24 hours, P=0.03).
Figure 3.
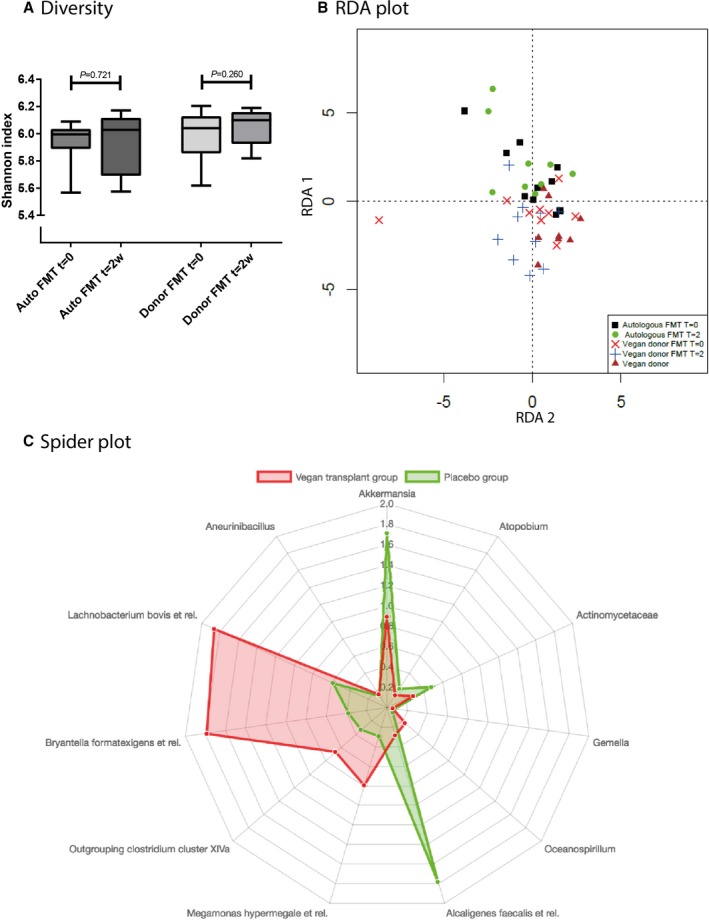
The effect of lean vegan‐donor FMT in fecal microbiota diversity and composition. A, Changes in fecal microbiota diversity 2 weeks after lean vegan‐donor or autologous FMT in obese metabolic syndrome patients, expressed as Shannon index. Data are depicted as box‐and‐whisker plots. P<0.05 was considered significant. B, RDA plot showing the changes in fecal microbiota composition in obese metabolic syndrome patients 2 weeks after either lean vegan‐donor or autologous FMT. C, Spider plot depicting individual fecal microbiota genera that showed different changes in abundance in metabolic syndrome patients after either lean vegan‐donor or autologous FMT. The axis of the spider plot reflects the amount of change (L2 norm) of the bacterial species on autologous (green) or lean vegan‐donor (red) FMT. Auto FMT indicates autologous fecal microbiota transplantation; Donor FMT, lean vegan donor fecal microbiota transplantation; FMT, fecal microbiota transplantation; Placebo, autologous fecal microbiota transplantation; RDA, redundancy analysis; t=0/2w, time point 0/2 weeks.
18F‐FDG PET/CT Scan on FMT
To study the effect of vegan‐donor FMT on vascular inflammation, 18F‐FDG PET/CT scans of the abdominal aortic wall were performed at baseline and 2 weeks after FMT. FDG uptake in the aortic wall at baseline was not significantly different between metabolic syndrome patients and vegan donors (maximized target to background: 3.25±0.8 versus 2.83±0.9, P=0.27; Figure 4). Neither vegan‐donor FMT nor autologous FMT altered aortic wall FDG uptake (Figure 4). Baseline and posttreatment maximized target‐to‐background values were, respectively, 3.49±1.1 and 3.43±0.9 (P=0.90) in the vegan donor FMT group and 3.15±0.5 and 3.59±1.1 (P=0.28) for the autologous FMT group.
Figure 4.
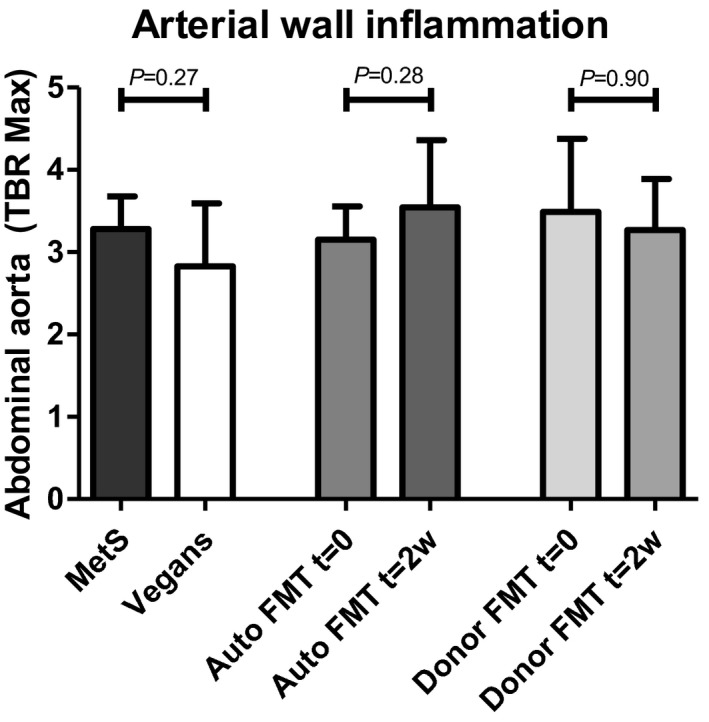
18F‐FDG PET/CT results of lean vegan donors vs obese metabolic syndrome patients and posttreatment changes. Shown are PET/CT results comparing obese metabolic syndrome patients with lean vegan FMT donors at baseline and treatment‐induced change after either autologous or lean vegan‐donor FMT. Data are depicted as means with SDs. P<0.05 was considered significant. Auto FMT indicates autologous fecal microbiota transplantation; Donor FMT, lean vegan donor fecal microbiota transplantation; FDG, fluorodeoxyglucose; MetS, obese omnivorous metabolic syndrome subjects; PET/CT, positron emission tomography/computed tomography; t=0/2w, time point 0/2 weeks; TBR Max, maximum target‐to‐background ratio; Vegans, lean vegan fecal microbiota transplantation donors.
FMT Effects on Cytokine Production Capacity
Before and 2 weeks after FMT, PBMCs were isolated from whole blood and ex vivo stimulated with different stimuli to measure cytokine production (IL‐1β, IL‐6, IL‐10, TNF‐α). Oxidized low‐density lipoprotein production differed between vegans and metabolic syndrome patients on 3 of 4 stimuli, but other cytokines were similar at baseline (Figure S2). Moreover, autologous FMT resulted in increased IL‐10 and IL‐1β production after Bacteroides stimulation, whereas we did not observe any treatment‐induced changes within the vegan‐donor FMT group.
Discussion
In the present double‐blind, randomized, controlled, pilot study, we show that lean vegan donor FMT in obese metabolic syndrome patients results in altered fecal microbiota composition. Unexpectedly, these alterations do not translate into significant effects on choline‐ or carnitine‐to‐TMA or ‐TMAO conversion. In line, no effect of vegan donor FMT was seen on surrogate markers of cardiovascular risk including vascular inflammation (aortic 18F‐FDG uptake assessed by PET/CT) and cytokine production capacity by PBMCs. These data showed that in the time window of 2 weeks, the therapeutic effect of a single vegan‐donor FMT was not sufficient to alter systemic TMAO levels in obese patients with increased cardiovascular risk due to metabolic syndrome.
Underscoring previous observations, our data confirmed that only limited baseline differences exist in fecal microbiota diversity between omnivores and vegans.12, 13 In vegans, we found increased relative abundance of fecal Lachnospiraceae, including butyrate‐producing bacteria related to L bovis and Anaerostipes, 9, 13, 35, 36 whereas metabolic syndrome patients were enriched in Clostridiales, which have been associated with TMA production.11 In support of a previous publication, metabolic syndrome patients are characterized by an increased capacity to convert carnitine to TMA and, subsequently, TMAO.11 Although it remains to be proven in larger cohorts, a recent meta‐analysis by Heianza et al37 suggests that higher conversion of carnitine to TMA and TMAO may result in a 1.4‐fold higher risk of CVD. Meanwhile, the similarity in unlabeled TMA excretion suggests a difference in hepatic flavin monooxygenase activity between metabolic syndrome patients and vegan donors. Indeed, altered hepatic flavin monooxygenase has been linked to insulin resistance in animal models.38 In contrast to the near absence of d3‐TMAO production in the study by Koeth et al,11 the vegans in our study were capable of some capacity to convert d3‐carnitine to TMAO, as demonstrated by the appearance of d3‐TMAO in plasma and urine after d3‐carnitine challenge. This difference might reflect the stricter definition of a vegan diet used in the studies by Koeth et al, which required >1 preceding year of using no animal products in the diet. The near absence of both d6‐choline and d6‐TMA and ‐TMAO in plasma and urine is remarkable compared with the d3‐TMAO concentrations within this study and previous reports on labeled choline metabolism in humans.10 It should be noted that in the study by Tang et al,10 heavy isotope–labeled phosphatidylcholine and not choline was used. The in vitro stability of the d6‐choline compound was tested and shown to be very stable (data not shown); it thus appears likely that the free d6‐choline, despite being provided at a greater molar level than isotope–labeled phosphatidylcholine previously, was almost not absorbed by the (small) intestine, limiting TMA and subsequent (hepatic) TMAO production. Unfortunately, we did not obtain post‐CCCT fecal samples to determine fecal excretion of d6‐labeled choline to support this hypothesis.
Two weeks after vegan donor FMT, fecal samples of metabolic syndrome patients were significantly enriched in short‐chain fatty acid producers B formatexigens and relatives39 and M hypermegale and relatives,40 the latter of which is known as a non–TMA‐producing genus.41 In contrast, autologous FMT affected the relative abundance of bacterial genera related to A faecalis and Akkermansia, with the latter related to beneficial metabolic health.42 Although the mechanism is unclear, it might be that the aerobic treatment of autologous feces has selected the oxygen‐tolerant Akkermansia 43 and A faecalis.44 These bacterial strains may subsequently occupy the niche in the fecal microbiota that was created by eradication of other anaerobic species. Despite these changes in intestinal microbiota composition, and in contrast to animal work18, 45 and human antibiotic intervention studies,10 vegan‐donor FMT was not able to reduce (both native and d3‐labeled) TMAO production in metabolic syndrome patients, whereas autologous FMT was associated with increased excretion of d3‐TMAO. With regard to the latter, the concomitant increase in A faecalis, which is known to generate TMA,46 may provide some explanation for this intriguing finding. Vegan‐donor FMT led to a shift toward vegan‐like microbiota composition in some, but not all, recipients. This could be related to the limited baseline fecal microbiota differences and continuation of an omnivorous diet after vegan‐donor FMT, which together may have resulted in a limited effect size of the FMT on TMAO conversion. We did not choose to put metabolic syndrome patients on a vegan diet after vegan‐donor FMT because we have previously reported metabolic changes after a single donor FMT32 without a dietary intervention, and the introduction of a standardized diet is known to affect intestinal microbiota composition; this would include bias.47 The heterogeneity in vegan‐donor fecal microbiota composition, as a consequence of using multiple vegan FMT donors, might also have added to the variation in microbiota changes seen following vegan‐donor FMT. However, we recently showed that the donor FMT effect on metabolism is largely driven by the receiving patient rather than the donor.32 Albeit modest and lower compared with metabolic syndrome patients, our vegan donors still had a residual capacity to convert carnitine to TMAO, which may explain that d6‐TMA and d6‐TMAO derived from d6‐choline remained almost absent in plasma and urine after vegan‐donor FMT. Moreover, we did not observe differences in FDG uptake at baseline between vegans and metabolic syndrome patients. This was surprising because previous trials have reported on increased FDG uptake in metabolic syndrome patients versus controls,48 and a vegan diet has been associated with decreased inflammation and protection from metabolic syndrome.49 Vegan‐donor FMT did not affect aortic wall 18F‐FDG uptake or ex vivo cytokine production, both surrogate parameters for an atherogenic proinflammatory state. The nonsignificant changes in TMAO production on vegan FMT align with the observations of Seldin et al showing a linear relation between amount of TMAO on aortic vascular endothelial cell inflammation in an animal model of CVD.50 In combination with this limited TMAO‐lowering potential of vegan‐donor FMT, the timing of the posttreatment measurements (2 weeks after FMT) might have been too fast after intervention to observe a maximal effect on TMAO production and PET/CT imaging. Nevertheless, FMT is capable of (permanently) changing the gut microbiota from 2 weeks after intervention,22 and we previously showed significant reductions in PET/CT signal of the aortic wall in a similarly short‐term time window (between 3 days and 8 weeks) after intervention.51, 52
Our study has certain limitations. First, we assessed short‐term outcome of vegan‐donor FMT in male obese west European participants, possibly precluding generalization of our findings to other patient groups and not studying long‐term outcome. Second, as a consequence of our randomized controlled trial design and in combination with the intensive study program for the participants, the sample size of our study is small. We tried to minimize the risk for important type II errors imposed by this small sample size by the use of sensitive (stable isotope–based) outcome parameters that, in previous studies, rendered significant effect10, 11; however, the large variation in TMAO metabolism limits strong conclusions regarding part of our hypotheses. Third, participants adhered to their own omnivorous diet after intervention, which, in hindsight, could have attenuated treatment‐induced changes. Finally, dietary records are notoriously inaccurate.53 Nevertheless, the main strength of the present study is that we investigated the relationship among intestinal microbiota, TMAO production, and surrogate markers of vascular inflammation using feces from participants with a longstanding vegan diet.
In conclusion, in this pilot study, single vegan‐donor FMT altered intestinal microbiota composition but was not able to affect TMAO production or an atherogenic proinflammatory state in patients with metabolic syndrome. The small (underpowered) sample size and short‐term follow‐up period might have contributed to the lack of noticed effect. Because lean‐donor FMT can alter both fecal microbiota composition and glucose metabolism in similarly size groups of metabolic syndrome patients,5 our data underscore the need for time‐interval–dependent metabolic flux studies in humans to study reproducibility and validation of this mode of intervention in cardiometabolic disease. Furthermore, the selection of donors and recipients based on high versus low TMAO levels and baseline fecal microbiota composition,32 and not simply metabolic syndrome status, would have potentially larger capability of monitoring for change in TMAO production potential in recipients of FMT in future studies. Consequently, further studies disentangling the role of intestinal microbiota composition in TMAO production and CVD are recommended.19
Sources of Funding
This project was supported by a CVON grant (CVON‐IN CONTROL) by the Dutch Heart Foundation and in part by a grant from a Transatlantic Networks of Excellence Award from the Leducq Foundation. Cleophas is supported by a grant of the Dutch Arthritis Foundation (nr. 12‐2‐303). Joosten is supported by a Competitiveness Operational Programme grant of the Romanian Ministry of European Funds (P_37_762). Netea was supported by an ERC Consolidator Grant (310372) and de Vos in part by an Advanced ERC Grant (250172) from the European Research Council. Netea and de Vos received a Spinoza Award of the Netherlands Organization for Scientific Research (NWO). de Vos was further supported by a SIAM Gravitation Grant of NWO (024.002.002). Wang and Hazen were supported in part by grants from the National Heart, Lung, and Blood Institute of the National Institutes of Health and the Office of Dietary Supplements (R01DK106000, R01HL135920, HL126827, R01HL103866, R01HL130819). Nieuwdorp is supported by a ZONMW‐VIDI grant 2013 (016.146.327) and a Dutch Heart Foundation CVON Young Talent Grant 2013 (on which Prodan is appointed). The funders had no role in study design, data collection and analysis, decision to publish, or preparation of the article.
Disclosures
Nieuwdorp and de Vos are founders and in the Scientific Advisory Board of Caelus Pharmaceuticals. Levin is founder of Horaizon B.V. de Vos is in the Scientific Advisory Board of Chr. Hansen, Hoersholm, Denmark, and the Nestle Institute for Health Science, Lausanne, Switzerland. Wang and Hazen are named as co‐inventors on pending patents held by the Cleveland Clinic relating to cardiovascular diagnostics and therapeutics. Wang and Hazen report that they have the right to receive royalty payment for inventions or discoveries related to cardiovascular diagnostics or therapeutics from Cleveland Heart Lab and Proctor & Gamble. Hazen reports having been paid as a consultant for the following companies: Proctor & Gamble. Hazen reports receiving research funds from Pfizer Inc, Proctor & Gamble and Takeda. None of these possible conflicts of interest bear direct relation to the outcomes of this specific study with regard to patents or royalties. The remaining authors have no disclosures to report.
Supporting information
Table S1. Safety Parameters in Obese Metabolic Syndrome Patients Before and After Fecal Microbiota Transplantation
Table S2. Daily Nutritional Intake in Lean Vegan Donors and Obese Metabolic Syndrome Patients
Table S3. Daily Nutritional Intake of Obese Metabolic Syndrome Patients Before and After Fecal Microbiota Transplantation
Figure S1. D6‐choline plasma and urine metabolites. Graphs showing the 24‐hour appearance of d6‐choline in plasma (A), the 24‐hour appearance of d6‐TMAO (from d6‐choline) in plasma (B), and the total urinary excretion of d6‐TMAO and d6‐TMA in the 24 hours following oral ingestion of 250 mg d6‐labeled choline (C and D). Data are depicted as box‐and‐whisker plots. No significant differences were found. Auto FMT indicates autologous fecal microbiota transplantation; Donor FMT, lean vegan‐donor fecal microbiota transplantation; iAUC, incremental area under the curve; MetS, obese omnivorous metabolic syndrome patients; TMA, trimethylamine; TMAO, trimethylamine‐N‐oxide; Vegans, lean vegan FMT donors.
Figure S2. A through D, Monocyte cytokine production after lean vegan‐donor or autologous fecal microbiota transplantation. Depicted is the ex vivo monocyte production of 4 different cytokines after a total of 6 stimuli, of which RPMI served as the control stimulus: (A) IL‐1β; (B) IL‐6; (C) IL‐10; (D) TNF‐α. Data are depicted as box‐and‐whisker plots. P<0.05 was considered significant and is marked with an asterisk. Allo indicates lean vegan‐donor fecal microbiota transplantation; Auto, autologous fecal microbiota transplantation; E coli, Escherichia coli; IL, interleukin; LPS, lipopolysaccharide; oxLDL, oxidized low‐density lipoprotein; RPMI, Roswell Park Memorial Institute medium; TNF‐α, tumor necrosis factor α.
(J Am Heart Assoc. 2018;7:e008342 DOI: 10.1161/JAHA.117.008342.)
References
- 1. Koren O, Spor A, Felin J, Fåk F, Stombaugh J, Tremaroli V, Behre CJ, Knight R, Fagerberg B, Ley RE, Bäckhed F. Human oral, gut, and plaque microbiota in patients with atherosclerosis. Proc Natl Acad Sci USA. 2011;108(suppl):4592–4598. [DOI] [PMC free article] [PubMed] [Google Scholar]
- 2. Karlsson FH, Fåk F, Nookaew I, Tremaroli V, Fagerberg B, Petranovic D, Bäckhed F, Nielsen J. Symptomatic atherosclerosis is associated with an altered gut metagenome. Nat Commun. 2012;3:1245. [DOI] [PMC free article] [PubMed] [Google Scholar]
- 3. Bäckhed F, Ding H, Wang T, Hooper LV, Koh GY, Nagy A, Semenkovich CF, Gordon JI. The gut microbiota as an environmental factor that regulates fat storage. Proc Natl Acad Sci USA. 2004;101:15718–15723. [DOI] [PMC free article] [PubMed] [Google Scholar]
- 4. Wang Z, Koonen D, Hofker M, Fu J. Gut microbiome and lipid metabolism: from associations to mechanisms. Curr Opin Lipidol. 2016;27:216–224. [DOI] [PubMed] [Google Scholar]
- 5. Vrieze A, Van Nood E, Holleman F, Salojärvi J, Kootte RS, Bartelsman JFWM, Dallinga‐Thie GM, Ackermans MT, Serlie MJ, Oozeer R, Derrien M, Druesne A, Van Hylckama Vlieg JE, Bloks VW, Groen AK, Heilig HG, Zoetendal EG, Stroes ES, de Vos WM, Hoekstra JB, Nieuwdorp M. Transfer of intestinal microbiota from lean donors increases insulin sensitivity in individuals with metabolic syndrome. Gastroenterology. 2013;144:250. [DOI] [PubMed] [Google Scholar]
- 6. Schirmer M, Smeekens SP, Vlamakis H, Jaeger M, Oosting M, Franzosa EA, Franzosa EA, Horst RT, Jansen T, Jacobs L, Bonder MJ, Kurilshikov A, Fu J, Joosten LAB, Zhernakova A, Huttenhower C, Wijmenga C, Netea MG, Xavier RJ. Linking the human gut microbiome to inflammatory cytokine production capacity. Cell. 2016;167:1125–1136.e8. [DOI] [PMC free article] [PubMed] [Google Scholar]
- 7. Bernelot Moens SJ, Verweij SL, Schnitzler JG, Stiekema LCA, Bos M, Langsted A, Kuijk C, Bekkering S, Voermans C, Verberne HJ, Nordestgaard BG, Stroes ESG, Kroon J. Remnant cholesterol elicits arterial wall inflammation and a multilevel cellular immune response in humans. Arterioscler Thromb Vasc Biol. 2017;37:969–975. [DOI] [PubMed] [Google Scholar]
- 8. Bennett BJ, de Aguiar Vallim TQ, Wang Z, Shih DM, Meng Y, Gregory J, Allayee H, Lee R, Graham M, Crooke R, Edwards PA, Hazen SL, Lusis AJ. Trimethylamine‐N‐oxide, a metabolite associated with atherosclerosis, exhibits complex genetic and dietary regulation. Cell Metab. 2013;17:49–60. [DOI] [PMC free article] [PubMed] [Google Scholar]
- 9. Wang Z, Klipfell E, Bennett BJ, Koeth R, Levison BS, Dugar B, Feldstein AE, Britt EB, Fu X, Chung YM, Wu Y, Schauer P, Smith JD, Allayee H, Tang WH, DiDonato JA, Lusis AJ, Hazen SL. Gut flora metabolism of phosphatidylcholine promotes cardiovascular disease. Nature. 2011;472:57–63. [DOI] [PMC free article] [PubMed] [Google Scholar]
- 10. Tang WH, Wang Z, Levison BS, Koeth RA, Britt EB, Fu X, Wu Y, Hazen SL. Intestinal microbial metabolism of phosphatidylcholine and cardiovascular risk. N Engl J Med. 2013;368:1575–1584. [DOI] [PMC free article] [PubMed] [Google Scholar]
- 11. Koeth RA, Wang Z, Levison BS, Buffa JA, Org E, Sheehy BT, Britt EB, Fu X, Wu Y, Li L, Smith JD, DiDonato JA, Chen J, Li H, Wu GD, Lewis JD, Warrier M, Brown JM, Krauss RM, Tang WH, Bushman FD, Lusis AJ, Hazen SL. Intestinal microbiota metabolism of L‐carnitine, a nutrient in red meat, promotes atherosclerosis. Nat Med. 2013;19:576–585. [DOI] [PMC free article] [PubMed] [Google Scholar]
- 12. Wu GD, Compher C, Chen EZ, Smith SA, Shah RD, Bittinger K, Chehoud C, Albenberg LG, Nessel L, Gilroy E, Star J, Weljie AM, Flint HJ, Metz DC, Bennett MJ, Li H, Bushman FD, Lewis JD. Comparative metabolomics in vegans and omnivores reveal constraints on diet‐dependent gut microbiota metabolite production. Gut. 2016;65:63–72. [DOI] [PMC free article] [PubMed] [Google Scholar]
- 13. De Filippis F, Pellegrini N, Vannini L, Jeffery IB, La Storia A, Laghi L, Serrazanetti DI, Di Cagno R, Ferrocino I, Lazzi C, Turroni S, Cocolin L, Brigidi P, Neviani E, Gobbetti M, O'Toole PW, Ercolini D. High‐level adherence to a Mediterranean diet beneficially impacts the gut microbiota and associated metabolome. Gut. 2016;65:1812–1821. [DOI] [PubMed] [Google Scholar]
- 14. Appleby PN, Crowe FL, Bradbury KE, Travis RC, Key TJ. Mortality in vegetarians and comparable nonvegetarians in the United Kingdom. Am J Clin Nutr. 2016;103:218–230. [DOI] [PMC free article] [PubMed] [Google Scholar]
- 15. Weiss R, Dziura J, Burgert TS, Tamborlane WV, Taksali SE, Yeckel CW, Allen K, Lopes M, Savoye M, Morrison J, Sherwin RS, Caprio S. Obesity and the metabolic syndrome in children and adolescents. N Engl J Med. 2004;350:2362–2374. [DOI] [PubMed] [Google Scholar]
- 16. Org E, Blum Y, Kasela S, Mehrabian M, Kuusisto J, Kangas AJ, Soininen P, Wang Z, Ala‐Korpela M, Hazen SL, Laakso M, Lusis AJ. Relationships between gut microbiota, plasma metabolites, and metabolic syndrome traits in the METSIM cohort. Genome Biol. 2017;18:70. [DOI] [PMC free article] [PubMed] [Google Scholar]
- 17. Tang WHW, Wang Z, Li XS, Fan Y, Li DS, Wu Y, Hazen SL. Increased trimethylamine N‐oxide portends high mortality risk independent of glycemic control in patients with type 2 diabetes mellitus. Clin Chem. 2017;63:297–306. [DOI] [PMC free article] [PubMed] [Google Scholar]
- 18. Gregory JC, Buffa JA, Org E, Wang Z, Levison BS, Zhu W, Wagner MA, Bennett BJ, Li L, DiDonato JA, Lusis AJ, Hazen SL. Transmission of atherosclerosis susceptibility with gut microbial transplantation. J Biol Chem. 2015;290:5647–5660. [DOI] [PMC free article] [PubMed] [Google Scholar]
- 19. Wang Z, Roberts AB, Buffa JA, Levison BS, Zhu W, Org E, Gu X, Huang Y, Zamanian‐Daryoush M, Culley MK, DiDonato AJ, Fu X, Hazen JE, Krajcik D, DiDonato JA, Lusis AJ, Hazen SL. Non‐lethal inhibition of gut microbial trimethylamine production for the treatment of atherosclerosis. Cell. 2015;163:1585–1595. [DOI] [PMC free article] [PubMed] [Google Scholar]
- 20. Bucerius J, Mani V, Moncrieff C, Rudd JHF, Machac J, Fuster V, Farkouh ME, Fayad ZA. Impact of noninsulin‐dependent type 2 diabetes on carotid wall 18F‐fluorodeoxyglucose positron emission tomography uptake. J Am Coll Cardiol. 2012;59:2080–2088. [DOI] [PMC free article] [PubMed] [Google Scholar]
- 21. Bekkering S, van den Munckhof I, Nielen T, Lamfers E, Dinarello C, Rutten J, de Graaf J, Joosten LA, Netea MG, Gomes ME, Riksen NP. Innate immune cell activation and epigenetic remodeling in symptomatic and asymptomatic atherosclerosis in humans in vivo. Atherosclerosis. 2016;254:228–236. [DOI] [PubMed] [Google Scholar]
- 22. van Nood E, Vrieze A, Nieuwdorp M, Fuentes S, Zoetendal EG, de Vos WM, Visser CE, Kuijper EJ, Bartelsman JF, Tijssen JG, Speelman P, Dijkgraaf MG, Keller JJ. Duodenal infusion of donor feces for recurrent Clostridium difficile . N Engl J Med. 2013;368:407–415. [DOI] [PubMed] [Google Scholar]
- 23. Cammarota G, Ianiro G, Tilg H, Rajilić‐Stojanović M, Kump P, Satokari R, Sokol H, Arkkila P, Pintus C, Hart A, Segal J, Aloi M, Masucci L, Molinaro A, Scaldaferri F, Gasbarrini G, Lopez‐Sanroman A, Link A, de Groot P, de Vos WM, Högenauer C, Malfertheiner P, Mattila E, Milosavljević T, Nieuwdorp M, Sanguinetti M, Simren M, Gasbarrini A; The European FMT Working Group . European consensus conference on faecal microbiota transplantation in clinical practice. Gut. 2017;66:569–580. [DOI] [PMC free article] [PubMed] [Google Scholar]
- 24. Wang Z, Levison BS, Hazen JE, Donahue L, Li X‐M, Hazen SL. Measurement of trimethylamine‐N‐oxide by stable isotope dilution liquid chromatography tandem mass spectrometry. Anal Biochem. 2014;455:35–40. [DOI] [PMC free article] [PubMed] [Google Scholar]
- 25. van Tits LJ, Demacker PN, de Graaf J, Hak‐Lemmers HL, Stalenhoef AF. Alpha‐tocopherol supplementation decreases production of superoxide and cytokines by leukocytes ex vivo in both normolipidemic and hypertriglyceridemic individuals. Am J Clin Nutr. 2000;71:458–464. [DOI] [PubMed] [Google Scholar]
- 26. Rudd JHF, Myers KS, Bansilal S, Machac J, Pinto CA, Tong C, Rafique A, Hargeaves R, Farkouh M, Fuster V, Fayad ZA. Atherosclerosis inflammation imaging with 18F‐FDG PET: carotid, iliac, and femoral uptake reproducibility, quantification methods, and recommendations. J Nucl Med. 2008;49:871–878. [DOI] [PubMed] [Google Scholar]
- 27. van der Valk FM, Verweij SL, Zwinderman KAH, Strang AC, Kaiser Y, Marquering HA, Nederveen AJ, Stroes ES, Verberne HJ, Rudd JH. Thresholds for arterial wall inflammation quantified by 18F‐FDG PET imaging: implications for vascular interventional studies. JACC Cardiovasc Imaging. 2016;9:1198–1207. [DOI] [PMC free article] [PubMed] [Google Scholar]
- 28. Salonen A, Nikkilä J, Jalanka‐Tuovinen J, Immonen O, Rajilić‐Stojanović M, Kekkonen RA, Palva A, de Vos WM. Comparative analysis of fecal DNA extraction methods with phylogenetic microarray: effective recovery of bacterial and archaeal DNA using mechanical cell lysis. J Microbiol Methods. 2010;81:127–134. [DOI] [PubMed] [Google Scholar]
- 29. Rajilić‐Stojanović M, Heilig HGHJ, Molenaar D, Kajander K, Surakka A, Smidt H, de Vos WM. Development and application of the human intestinal tract chip, a phylogenetic microarray: analysis of universally conserved phylotypes in the abundant microbiota of young and elderly adults. Environ Microbiol. 2009;11:1736–1751. [DOI] [PMC free article] [PubMed] [Google Scholar]
- 30. Lahti L, Salojärvi J, Salonen A, Scheffer M, de Vos WM. Tipping elements in the human intestinal ecosystem. Nat Commun. 2014;5:4344. [DOI] [PMC free article] [PubMed] [Google Scholar]
- 31. Zou H, Hastie T. Regularization and variable selection via the elastic‐net. J R Stat Soc. 2005;67:301–320. [Google Scholar]
- 32. Kootte RS, Levin E, Salojärvi J, Smits LP, Hartstra A V, Udayappan SD, Hermes G, Bouter KE, Koopen AM, Holst JJ, Knop FK, Blaak EE, Zhao J, Smidt H, Harms AC, Hankemeijer T, Bergman JJGHM, Romijn HA, Schaap FG, Olde Damink SWM, Ackermans MT, Dallinga‐Thie GM, Zoetendal E, de Vos WM, Serlie MJ, Stroes ESG, Groen AK, Nieuwdorp M. Improvement of insulin sensitivity after lean donor feces in metabolic syndrome is driven by baseline intestinal microbiota composition. Cell Metab. 2017;26:611–619.e6. [DOI] [PubMed] [Google Scholar]
- 33. Meinshausen N. Stability selection. J R Stat Soc Series B. 2010;72:417–473. [Google Scholar]
- 34. van den Wollenberg AL. Redundancy analysis an alternative for canonical correlation analysis. Psychometrika. 1977;42:207–219. [Google Scholar]
- 35. Hippe B, Zwielehner J, Liszt K, Lassl C, Unger F, Haslberger AG. Quantification of butyryl CoA:acetate CoA‐transferase genes reveals different butyrate production capacity in individuals according to diet and age. FEMS Microbiol Lett. 2011;316:130–135. [DOI] [PubMed] [Google Scholar]
- 36. Matijašić BB, Obermajer T, Lipoglavšek L, Grabnar I, Avguštin G, Rogelj I. Association of dietary type with fecal microbiota in vegetarians and omnivores in Slovenia. Eur J Nutr. 2014;53:1051–1064. [DOI] [PubMed] [Google Scholar]
- 37. Heianza Y, Ma W, Manson JE, Rexrode KM, Qi L. Gut microbiota metabolites and risk of major adverse cardiovascular disease events and death: a systematic review and meta‐analysis of prospective studies. J Am Heart Assoc. 2017;6:e004947 DOI: 10.1161/JAHA.116.004947. [DOI] [PMC free article] [PubMed] [Google Scholar]
- 38. Miao J, Ling AV, Manthena PV, Gearing ME, Graham MJ, Crooke RM, Croce KJ, Esquejo RM, Clish CB; Morbid Obesity Study Group , Vicent D, Biddinger SB. Flavin‐containing monooxygenase 3 as a potential player in diabetes‐associated atherosclerosis. Nat Commun. 2015;6:1–10. [DOI] [PMC free article] [PubMed] [Google Scholar]
- 39. Rey FE, Faith JJ, Bain J, Muehlbauer MJ, Stevens RD, Newgard CB, Gordon JI. Dissecting the in vivo metabolic potential of two human gut acetogens. J Biol Chem. 2010;285:22082–22090. [DOI] [PMC free article] [PubMed] [Google Scholar]
- 40. Harrison AP, Hansen PA. Bacteroides hypermegas nov. spec. Antonie Van Leeuwenhoek. 1963;29:22–28. [DOI] [PubMed] [Google Scholar]
- 41. Romano KA, Vivas EI, Amador‐noguez D, Rey FE. Intestinal microbiota composition modulates choline bioavailability from diet and accumulation of the proatherogenic metabolite trimethylamine‐N‐oxide. MBio. 2015;6:1–8. [DOI] [PMC free article] [PubMed] [Google Scholar]
- 42. Dao MC, Everard A, Aron‐Wisnewsky J, Sokolovska N, Prifti E, Verger EO, Kayser BD, Levenez F, Chilloux J, Hoyles L; MICRO‐Obes Consortium , Dumas ME, Rizkalla SW, Doré J, Cani PD, Clément K. Akkermansia muciniphila and improved metabolic health during a dietary intervention in obesity: relationship with gut microbiome richness and ecology. Gut. 2016;65:426–436. [DOI] [PubMed] [Google Scholar]
- 43. Ouwerkerk JP, van der Ark KCH, Davids M, Claassens NJ, Robert Finestra T, de Vos WM, Belzer C. Adaptation of Akkermansia muciniphila to the oxic‐anoxic interface of the mucus layer. Appl Environ Microbiol. 2016;82:6983–6993. [DOI] [PMC free article] [PubMed] [Google Scholar]
- 44. Huang YS, An Q, Zhao B, Lv QH, Guo JS. Potential for aerobic NO2‐ reduction and corresponding key enzyme genes involved in Alcaligenes faecalis strain NR. Arch Microbiol. 2017;200:147–158. [DOI] [PubMed] [Google Scholar]
- 45. Zhu W, Gregory JC, Org E, Buffa JA, Gupta N, Wang Z, Li L, Fu X, Wu Y, Mehrabian M, Sartor RB, McIntyre TM, Silverstein RL, Tang WHW, DiDonato JA, Brown JM, Lusis AJ, Hazen SL. Gut microbial metabolite TMAO enhances platelet hyperreactivity and thrombosis risk. Cell. 2016;165:111–124. [DOI] [PMC free article] [PubMed] [Google Scholar]
- 46. Kelly B, Appleman MD. Degradation of ergothioneine by cell‐free extracts of Alcaligenes faecalis . J Bacteriol. 1961;81:715–720. [DOI] [PMC free article] [PubMed] [Google Scholar]
- 47. David LA, Maurice CF, Carmody RN, Gootenberg DB, Button JE, Wolfe BE, Ling AV, Devlin AS, Varma Y, Fischbach MA, Biddinger SB, Dutton RJ, Turnbaugh PJ. Diet rapidly and reproducibly alters the human gut microbiome. Nature. 2014;505:559–563. [DOI] [PMC free article] [PubMed] [Google Scholar]
- 48. Coulson JM, Rudd JHF, Duckers JM, Rees JIS, Shale DJ, Bolton CE, Cockcroft JR. Excessive aortic inflammation in chronic obstructive pulmonary disease: an 18F‐FDG PET pilot study. J Nucl Med. 2010;51:1357–1360. [DOI] [PubMed] [Google Scholar]
- 49. Glick‐Bauer M, Yeh M‐C. The health advantage of a vegan diet: exploring the gut microbiota connection. Nutrients. 2014;6:4822–4838. [DOI] [PMC free article] [PubMed] [Google Scholar]
- 50. Seldin MM, Meng Y, Qi H, Zhu W, Wang Z, Hazen SL, Lusis AJ, Shih DM. Trimethylamine N‐oxide promotes vascular inflammation through signaling of mitogen‐activated protein kinase and nuclear factor‐κB. J Am Heart Assoc. 2016;5:e002767 DOI: 10.1161/JAHA.115.002767. [DOI] [PMC free article] [PubMed] [Google Scholar]
- 51. Tawakol A, Fayad Z, Mogg R, Alon A, Klimas MT, Dansky H, Subramanian SS, Abdelbaky A, Rudd JHF, Farkouh ME, Nunes IO, Beals CR, Shankar SS. Intensification of statin therapy results in a rapid reduction in atherosclerotic inflammation: results of a multicenter fluorodeoxyglucose‐positron emission tomography/computed tomography feasibility study. J Am Coll Cardiol. 2013;62:909–917. [DOI] [PubMed] [Google Scholar]
- 52. van Wijk DF, Sjouke B, Figueroa A, Emami H, van der Valk FM, MacNabb MH, Hemphill LC, Schulte DM, Koopman MG, Lobatto ME, Verberne HJ, Fayad ZA, Kastelein JJ, Mulder WJ, Hovingh GK, Tawakol A, Stroes ES. Nonpharmacological lipoprotein apheresis reduces arterial inflammation in familial hypercholesterolemia. J Am Coll Cardiol. 2014;64:1418–1426. [DOI] [PubMed] [Google Scholar]
- 53. Stumbo PJ. New technology in dietary assessment: a review of digital methods in improving food record accuracy. Proc Nutr Soc. 2013;72:70–76. [DOI] [PubMed] [Google Scholar]
Associated Data
This section collects any data citations, data availability statements, or supplementary materials included in this article.
Supplementary Materials
Table S1. Safety Parameters in Obese Metabolic Syndrome Patients Before and After Fecal Microbiota Transplantation
Table S2. Daily Nutritional Intake in Lean Vegan Donors and Obese Metabolic Syndrome Patients
Table S3. Daily Nutritional Intake of Obese Metabolic Syndrome Patients Before and After Fecal Microbiota Transplantation
Figure S1. D6‐choline plasma and urine metabolites. Graphs showing the 24‐hour appearance of d6‐choline in plasma (A), the 24‐hour appearance of d6‐TMAO (from d6‐choline) in plasma (B), and the total urinary excretion of d6‐TMAO and d6‐TMA in the 24 hours following oral ingestion of 250 mg d6‐labeled choline (C and D). Data are depicted as box‐and‐whisker plots. No significant differences were found. Auto FMT indicates autologous fecal microbiota transplantation; Donor FMT, lean vegan‐donor fecal microbiota transplantation; iAUC, incremental area under the curve; MetS, obese omnivorous metabolic syndrome patients; TMA, trimethylamine; TMAO, trimethylamine‐N‐oxide; Vegans, lean vegan FMT donors.
Figure S2. A through D, Monocyte cytokine production after lean vegan‐donor or autologous fecal microbiota transplantation. Depicted is the ex vivo monocyte production of 4 different cytokines after a total of 6 stimuli, of which RPMI served as the control stimulus: (A) IL‐1β; (B) IL‐6; (C) IL‐10; (D) TNF‐α. Data are depicted as box‐and‐whisker plots. P<0.05 was considered significant and is marked with an asterisk. Allo indicates lean vegan‐donor fecal microbiota transplantation; Auto, autologous fecal microbiota transplantation; E coli, Escherichia coli; IL, interleukin; LPS, lipopolysaccharide; oxLDL, oxidized low‐density lipoprotein; RPMI, Roswell Park Memorial Institute medium; TNF‐α, tumor necrosis factor α.