

Abstract
The steady occurrence of DNA mutations is a key source for evolution, generating the genomic variation in the population upon which natural selection acts. Mutations driving evolution have to occur in the oocytes and sperm in order to be transmitted to the next generation. Through similar mechanisms, mutations also accumulate in somatic cells (e.g. skin cells, neurons, lymphocytes) during development and adult life. The concept that somatic cells can collect new mutations with time suggests that we are a mosaic of cells with different genomic compositions. Particular attention has been recently paid to somatic mutations in the brain, with a focus on the relationship between this phenomenon and the origin of human diseases. Given this progressive accumulation of mutations, it is likely that an increased load of somatic mutations is present later in life and that this could be associated with late-life diseases and aging.
In this review we focus on a particular type of mutation: the loss and/or gain of whole chromosomes (i.e. aneuploidy) caused by errors in chromosomes segregation in neurons and glia. Currently it is hard to grasp the functional impact of somatic mutation in the brain because we lack reliable estimates of the proportion of aneuploid cells in the normal brain across different ages. Here, we revisit the key studies that attempted to quantify the proportion of aneuploid cells in both in normal and diseased brains and highlight the deep inconsistencies among the different studies done in the last 15 years. Finally, our review highlights several limitations of studies performed in human and rodent models and explores a possible translational role for non-human primates.
Keywords: aneuploidy, neurons, glia, single-cell sequencing, primates
Introduction
The notion that each individual is a mosaic of cells with different genomic content is now widely accepted. The functional consequences of such mosaicism is, however, still largely unclear because systematic surveys of mosaicism in different tissues across large numbers of individuals has been missing. Such surveys are particularly challenging when the organ under investigation is as complex and inaccessible as the brain. On the other hand, given the potentially significant implications of somatic mosaicism in the brain, a wealth of studies have focused on this topic in the last 15 years (Evrony et al., 2012; McConnell et al., 2013; Poduri et al., 2013; Rehen et al., 2005; van den Bos et al., 2016a) (Fig. 1 and Table 1).
Figure 1. Evolutionary timeline of technologies used to identify somatic aneuploidy and CNVs in the brain.
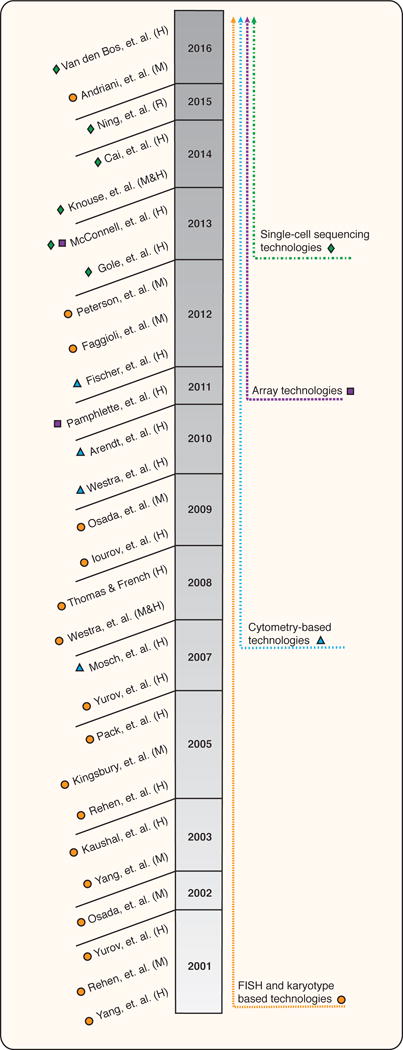
The figure shows the key studies used to study somatic aneuploidy and CNVs in the brain in the last 15 years. The papers are organized chronologically and categorized by the type of technology used. While cytogenetics and cytometry based methods were almost exclusively used at the very beginning, the introduction of next-generation sequencing and single-cell technologies caused a shift towards single-cell sequencing and array. (H) indicates studies done in human, (M) studies done in mouse and (R) study done in rat.
Table 1.
List of key publications on somatic aneuploidy in the human and mouse brain.
| Author | Year | Species | Techniques | Probes | Case(s) | Age | Tissue | Cell Type(s) | # of nuclei examined per case |
Detection metric | Results: chr(s) affected/ percent |
Conclusions: avg % per chromosome |
Conclusion: % aneuploidy within tissue |
|---|---|---|---|---|---|---|---|---|---|---|---|---|---|
| FISH-based techniques | |||||||||||||
| Yang, et. al. | 2001 | Human |
FISH point probes |
Chr. 11, 18, 21 | Control (n=4) & AD (n=7) | 69-87 yrs. | hippocampus | Bulk | ~400 | polyploidy | none | 0% polyploidy | 0% polyploidy |
| Yurov, et. al. | 2001 | Human |
FISH point probes |
Chr. 1, 7, 8, 13, 16, 18, 21, 22, X, Y | Control (n=2), Schizophrenic (n=6) | 28, 76 yrs. | prefrontal cortex | Neurons (morphology) | ~1,800 | trisomy | none | 0% trisomy | 0% trisomy |
| Rehen, et. al. | 2005 | Human |
FISH dual labeled |
Chr. 21 | Control (n=6) | 2-96 yrs. | Variable hippocampus, frontal and occipital cortex | Neurons & Non-neurons (NeuN) | 500-1,500 | aneuploidy & tetrasomy | chr.21 (3.2-5.2% aneuploidy); chr.21 (2.4-3.8% tetrasomy) | ~4% aneuploidy | not reported |
| Pack, et. al. | 2005 | Human |
FISH & LOH analysis dual labeled |
Chr. 1, 3, 6, 7, 8, 9, 11 | Control (n=8) | 40-75 yrs. | cerebral cortex, hippocampus, deep nuclei, cerebellum | Bulk | not reported | aneuploidy | not reported | not reported | 38-47% aneuploidy |
| Yurov et. al. | 2007 | Human |
FISH quantitative (Q-FISH) |
Chr. 1, 9, 15, 16, 17, 18, X, Y | Control Fetal (n=12) | 8-11 gestational weeks | telencephalic region | Bulk | ~5,000 | aneuploidy | chr.1 (1.32%); chr.9 (0.89%); chr.15 (1.17%); chr.16 (1.31%); chr.17 (0.93%); chr.18 (1.25%); chr.X (2.33%); chr.Y (0.78%) | 1.25-1.45% aneuploidy | 30-35% aneuploidy |
| Westra, et. al. | 2008 | Human |
FISH dual labeled |
Chr. 6, 21 | Control (n=6) | 45-76 yrs. | cerebellum | Neurons & Non-neurons (NeuN) | ~3,000 | aneuploidy | chr.6 (1.2%); chr.21 (1.8%) | ~1% aneuploidy | not reported |
| Thomas & French | 2008 | Human |
FISH quantitative (Q-FISH) |
Chr. 17, 21 | Control (n=9) | 60-98 yrs. | hippocampus | Bulk | 1,000 | aneuploidy | chr.17 (18%); chr.21 (11.8%) | not reported | not reported |
| Iourov, et. al. | 2009 | Human |
FISH quantitative (Q-FISH) |
Chr. 1, 7, 11, 13, 14, 17, 18, 21, X, Y | Control (n=7) | 8-47 yrs. | cerebral cortex | Neurons & Non-neurons (NeuN) | 7,000 | aneuploidy | chr.13 (0.5%); chr.18 (0.6%); chr.21 (0.4%); chr.X (0.4%); chr.Y (0.1%) | 0.4-0.9% aneuploidy | 10-22% aneuploidy |
| Cytometry-based techniques | |||||||||||||
| Mosch, et. al. | 2007 | Human | Slide-based cytometry (SBC) | n/a | Control (n=13) | 71.7 ± 10.3 yrs. | entorhinal cortex | Neurons (Neurofilament) | 80,000-120,000 | DNA content variation (DCV) | n/a | n/a | ~10% hyperdiploid |
| Westra, et. al. | 2010 | Human | FACS | n/a | Control (n=24) | 35-95 yrs. | frontal cortex (n=24) & cerebellum (n=8) | Neurons (NeuN) | 10,000 | DNA content variation (DCV) | n/a | n/a | Cortical neurons display an average of 4% (250Mb) increase in DNA content compared to blood and cerebellum. |
| Arendt, et. al. | 2010 | Human | Slide-based cytometry (SBC) | n/a | Control (n=14) | 71.7 ± 10.3 yrs. | entorhinal cortex | Neurons (Neurofilament) | 80,000-120,000 | DNA content variation (DCV) | n/a | n/a | ~10% hyperdiploid |
| Fischer, et. al. | 2012 | Human | Slide-based cytometry (SBC) | n/a | Control (n=18) | 31-88 yrs. | frontal, temporal, parietal, entorhinal and occipital cortices | Neurons (Neurofilament) | 500,000 | DNA content variation (DCV) | n/a | n/a | Average of 11.5% hyperdiploidy |
| Sequencing and array-based techniques | |||||||||||||
| Pamphlette, et. al. | 2011 | Human | SNP array | n/a | Control (n=26) | adult | frontal cortex | Bulk | Bulk DNA | subchromosomal CNV & aneuploidy | not reported | not reported | Total of 410 CNV observed somatic in brain, but not blood |
| Gole, et. al. | 2013 | Human | SC-NGS | n/a | Control (n=1) | not reported | brain sample | Neurons (NeuN) | 2 | Subchromosomal CNV & aneuploidy | not reported | not reported | Detection of CNV in single neurons, present in bluk DNA |
| McConnell, et. al. | 2013 | Human | SC-NGS | n/a | Control (n=3) | 20-26 yrs. | frontal cortex | Neurons (NeuN) | ~36 per (110 total) | subchromosomal CNV & aneuploidy | aneuploidy: chr.2 (0.9%); chr.4 (0.9%); chr.13 (0.9%) | not reported | 2.7% aneuploidy 13-41% large-scale CNV (≥1) |
| Knouse, et. al. | 2014 | Human | SC-NGS | n/a | Control (n=4) | 48-70 yrs. | frontal lobe | Neurons (NeuN) | ~22 per (89 total) | Subchromosomal CNV & aneuploidy | aneuploidy: chr.22 (1.12%); chr.18 (1.12%) | not reported | 2.2% aneuploidy |
| Cai, et. al. | 2014 | Human | SC-NGS | n/a | Control (n=3) | adult | cortex | Neurons & Non-neurons (NeuN) | ~32 per, (97 total) | subchromosomal CNV & aneuploidy | not reported | not reported | 0% aneuploidy 68% large-scale CNV (≥1) |
| Van den Bos, et. al. | 2016 | Human | SC-NGS | n/a | Control (n=6) | 69-93 yrs. | frontal cortex | Neurons & Non-neurons (NeuN) | ~98 per, (589 total) | subchromosomal CNV & aneuploidy | aneuploidy: chr.18 (0.2%); chr.6 (0.2%); chr.4 (0.2%); chr16. (0.34%); chr.13 (0.2%); chr.21 (0.2%); chr.22 (0.2%) | 0-0.34% aneuploidy | 0.7% aneuploidy |
| Rehen, et. al. | 2001 | mouse |
SKY & I-FISH paint probes |
Chr. X, Y | BALB/c (n=?) | E11-14 & adult | cortex | mitotic neuroblasts (SKY) & post-mitotic bulk (I-FISH) | 220 total (SKY); 300 per (I-FISH) | aneuploidy | embryonic aneuploidy: chr.Y (4.7%); chr.X (2.1%) adult aneuploidy: chr.Y (0.7%); chr.X (0.4%) | not reported | ~33% aneuploidy in neuroblasts |
| Osada, et al. | 2002 | mouse | N-NT & karyotype | n/a | B6D2F1 (n=20) | >8 weeks | cerebral and cerebellar cortexes | neurons (morphology) | 242 total | aneuploidy at metaphase I | not reported | not reported | abnormal chromosomes: 64.2% (cortical neurons); 60.3% (Purkinje) |
| Kaushal, et. al. | 2003 | mouse |
SKY & I-FISH paint probes |
Chr. X, Y | GFP transgenic (n, not reported) | P5-P10 | subventricular zone (SVZ) & olfactory bulb (OB) | NPCs (SKY); Bulk (I-FISH) | 65 total SKY, not reported (I-FISH) | aneuploidy | SVZ aneuploidy:chr. X/Y (~5%); OB aneuploidy: chr. X/Y (~6%) | not reported | ~33% aneuploidy SVZ neurons |
| Yang, et. al. | 2003 | mouse | SKY | n/a | BALB/c (n, not reported) | E12 & E14 | cerebral cortex | mitotic NPCs | 220 total | aneuploidy | not reported | not reported | 33.2% aneuploidy in developing cortex (NPCs) |
| Kingsbury, et. al. | 2005 | mouse |
I-FISH paint probes |
Chr. X, Y | BalbC/CR, Swiss Webster, C129SvJ (n=10) | 10 weeks | whole brain | neurons (IEGs) | ~1,000 per | hyperploidy | chr. X/Y (~0.2%) hyperploidy | not reported | not reported |
| Westra, et al. | 2008 | mouse |
I-FISH & M-FISH dual labeled |
Chr. X, 16 | Balb/C (n, not reported) | P0, P7 & adult | cerebellum | mitotic NPCs & post-mitotic neurons and non-neurons | >18,000 I-FISH, ~200 nuclei M-FISH | aneuploidy | chr.X (1.1%), chr.16 (1.6%) aneuploidy | ~1% aneuploidy | ~20% aneuploidy in developing cerebellum (P0, 15.3%; P7, 20.8% in NPCs) |
| Osada, et. al. | 2009 | mouse | N-NT & SKY | n/a | |||||||||
| Faggioli, et. al. | 2012 | mouse |
FISH dual labeled |
chr. 1, 7, 14, 15, 16, 18, 19 and Y | control (n=20) | 4 mo., 28 mo. | cerebral cortex | neuron & non-neurons (NeuN) | 400-800 nuclei | aneuploidy | chr.18 aneuploidy: 0.9% (young), 1.5% (middle-age), 4.5% (old). chr.7/18/7 aneuploidy: 9.8% (old) | ~1% aneuploidy in young, ~2.3% in old mice | almost 50% aneuploidy in aged mouse brain |
| Knouse, et. al. | 2014 | mouse |
sc-NGS WGA4 |
n/a | nestin-GFP mice, C57BL/6J mice | embryonic, adult | cerebral cortex | bulk, neuron/non (NeuN) | 43 nuclei 19 nuclei | aneuploidy | embryonic: chr.15 (2.3%) adult: 0% aneuploidy | not reported | ~1% aneuploidy in mouse brain |
| Ning, et. al. | 2015 | rat |
sc-NGS WGA4, MDA, MALBAC 100 kb |
n/a | control embryoninc rat (n=2) | E18 | Hippocampus | Neurons (NeuN) | 19 nuclei total | CNV | chr.8, single large-scale subchromosomal CNV | not reported | accurate CNV detection using sc-NGS |
| Andriani, et. al. | 2016 | mouse | I-FISH quantitative |
chr. 1, 7, 18 | control mice (n=?) | E13.5, 14 week, 6 mo | cerebral cortex and cerebellum | Bulk | 1000-1500 | aneuploidy | not reported | not reported | 31% aneuploid in embryoninc brain, ~0.1% in adult |
| Peterson, et. al. | 2012 | mouse |
SKY & I-FISH paint probes |
chr. 8, 16 | C57BL/6J (n=?) | E19 | cerebral cortex | mitotic NPCs and post-mitotic bulk | 100 per (SKY), 2500-3500 (I-FISH) | aneuploidy | chr.16: 2.1% aneuploidy in post-mitotic cells; chr.8: 1.6% aneuploidy in post-mitotic cells | not reported | 24-29% aneuploid within mitotic cells of developing cortex |
Detailed list of the key studies that investigated somatic aneuploidy and CNV in the human and mouse brain. (Abbreviations: N-NT= nuclear transfer of neuronal nuclei; SKY= Spectral karyotyping; NPCs= Neural progenitor cells; IEG: immediate early gene)
Actively dividing cells in developing brain are subject to somatic mutations producing genetically distinct daughter cells and resulting in a mosaic landscape. Different types of mechanisms can give rise to a variety of somatic mutations, mimicking mutational processes in the germline. One class of mutations is represented by the gain or loss of entire chromosomes (aneuploidy), which is the result of errors in the segregation of chromosomes, the entities in which the DNA is “packaged” for faithful segregation to the two daughter cells during cell division (Cimini, 2008). Aneuploidy has been extensively investigated in the context of cancer and embryonic development (Carbone and Chavez, 2015), however its frequency and impact on brain development and function is still unclear. Data obtained from the mouse have shown that, while the percentage of aneuploidy is high in the neuronal embryonic stem cells (33%) and in the developing brain (Rehen et al., 2001), it is low (1%) in the adult brain (Faggioli et al., 2012). It has been hypothesized that the acquisition of genetic variability during early development might be important for neuronal differentiation, brain plasticity and quicker adaptation to new environments (Muotri and Gage, 2006; Singer et al., 2010). If this is the case, we would expect post-mitotic neurons to be under different constraints than the highly mitotic glia (i.e. non-neuronal cells that provide support for neuronal cells) and possibly use genomic alterations to their advantage to build and maintain neuronal networks during early development (reviewed in (Bushman and Chun, 2013). Cells with different genomes could also be differentially susceptible to environmental factors like oxidative stress depending on the level of genomic variation. For instance, it has been observed that in neuronal stem cells, caspase-mediated programmed cell death acts differently depending on the level of aneuploidy. This varied response results in the survival of mild aneuploidy, indicating that this state may be beneficial for the organism at this early stage (Peterson et al., 2012).
The accrual of deleterious mutations with aging could, however, lead to a negative outcome later in life; this hypothesis is supported by evidence of deleterious consequences of aneuploidy. For instance, aging and neurodegenerative disorders (e.g. Alzheimer’s disease) have been associated with the accumulation of aneuploidy possibly due to increased errors in cell cycling (Yang et al. 2001, Iourov et al. 2009). It is therefore possible that antagonistic pleiotropy (Gladyshev, 2016) is occurring whereby disease states that derive from an excess of aneuploid cells with age impart a detrimental phenotype. Interestingly, the rate of aneuploidy in dividing glia cells has been found to increase with aging (as much as 46%) supporting a model in which errors tend to accumulate with time. Given the amplitude of this phenomenon, it is likely that it has a functional impact (Faggioli et al., 2012). However, while the hypothesis that levels of aneuploidy in disease-free cells rises with age was conceived decades ago (Jacobs et al. 1961), it has been difficult to accurately measure chromosome numbers in post-mitotic and adult tissues, causing uncertainty about the biological relevance of this phenomenon.
In general, investigating somatic mutations is a daunting task as, opposed to germline mutations that are present in every cell of an individual, somatic events that occur later in life might only be present in a small number of cells. Hence, due to their relatively low frequency in the brain it is not feasible to identify somatic mutations using bulk approaches and/or low-throughput methods. The introduction of next-generation sequencing (NGS) and, more recently, its application to low input (5-10 pg) DNA, has allowed scientists to start exploring the genetic diversity of single somatic cells (Gawad et al., 2016). As copy number variation (CNVs) and aneuploidy are large-scale changes that can be detected with substantially lower sequence coverage than single nucleotide mutations, most of the recent studies have preferentially targeted these types of mutations. At the same time, however, we note that these studies have lacked the power to accurately assess the proportion of aneuploid neurons and glia, address inter-individual differences, and identify a possible relationship between aneuploidy and aging. For instance, McConnell et al. (2013) sequenced a total of 110 single neurons from the frontal cortex (FC) split among three individuals of ages 20, 26 and 50 years. Although this study identified aneuploid neurons (2.7%) only ~30 cells/individual were analyzed. Knouse et al. (2014) sequenced a total of 89 cells from post-mortem samples of the frontal lobe of four individuals of ages 48, 52, 68, and 70 years and concluded that the prevalence of aneuploidy in the human brain is 2.2%. Finally, Cai et al. (2014) analyzed a total of 82 single cortical neurons from three individuals (age not specified) and found 4.9% to be aneuploid (Table 1). Overall these examples demonstrate the ability to obtain and analyze sequence data from single-cells, however their small sample sizes lack the statistical power needed to accurately estimate the proportion of aneuploidy and limit our confidence in extending these observations to the whole species. This is mainly due to the fact that, even with the exponential growth of sequencing throughput, high costs of single-cell isolation and sequencing library preparation still limit our ability to fully characterize complex patterns of somatic mosaicism in the brain.
This review aims to provide an overview of the several attempts that have been made at obtaining an estimate of the proportion of aneuploid cells in the brain in human and mouse. After highlighting the challenges linked to the current technologies and biomedical models, we discuss how using brain tissues from non-human primates could solve some of the current limitations.
What is the origin and possible consequence of aneuploidy?
Chromosome segregation during cell division is highly choreographed and tightly regulated but also an error prone event that, when defective, can result in the erroneous segregation of chromosomes to the two daughter cells (Thompson et al., 2010). As a consequence, gain or loss of one or more chromosomes (i.e. aneuploidy) occurs. Aneuploidy in the germline is generally incompatible with life and often leads to pregnancy loss or stillbirth in humans. In the few cases in which aneuploidy is tolerated (chromosomes 13, 18, 21 and X), it is associated with severe developmental disorders (e.g. Down or Turner syndrome). Since aneuploidy is one of the most frequent hallmarks of cancer, most of the information that we currently have regarding the underlying causes of chromosome mis-segregation comes from studies in cancer cell lines or tumors (Zhang et al., 2015). Chromosomal instability can result from mutations of genes whose products are normally involved in ensuring fidelity of chromosome segregation (Fenech et al., 2011), including genes involved in: spindle checkpoints, cell cycle regulation, chromosome cohesion, microtubule attachment and dynamics, and kinetochore structure and assembly (Crasta et al., 2012; Garvin et al., 2015; Janssen et al., 2011; Kolano et al., 2012; Samora et al., 2011). Initially, in order to accurately segregate to different daughter cells during mitosis, sister kinetochores need to interact with the microtubules from the opposite poles of the spindle. Erroneous orientation of this attachment early in mitosis (i.e. monotelic, syntelic and merotelic) can lead to chromosome mis-segregation (Fig. 2A). Both monotelic (one sister kinetochore is attached to the microtubules from one spindle pole while the other is not attached) and syntelic (both sister kinetochores are attached to the microtubules from the same spindle pole) attachments cause chromosomes to localize close to one spindle pole and would lead to segregation of chromatids to the same pole after progression from metaphase to anaphase. These errors, however, are normally detected by the spindle assembly checkpoint (SAC), which will delay progression to anaphase and eventually cause mitotic arrest (Cimini, 2008). On the contrary, a merotelic orientation, which occurs when a single kinetochore binds to microtubules from both poles, causes chromosomes to arrest on the metaphase plate. Most importantly, this incorrect orientation does not result in mitotic arrest, as the presence of tension caused by the microtubule attachment to the kinetochore is sufficient to silence the SAC and allow progression to anaphase. As a consequence, if the bundles of microtubules attached to each side of the kinetochore are of similar size, the chromosome will be equally pulled from both poles and will end up “lagging” behind in the middle of the spindle (Fig. 2B). At the end of mitosis the lagging chromosome will be randomly pushed into one of the other daughter cells thus causing aneuploidy in 50% of the cases. Moreover, when the nuclear envelope reassembles, lagging chromosomes are known to form micronuclei; within the micronuclei a chromosome will experience increased fragility, perhaps as an effect of asynchronous DNA replication (Crasta et al., 2012; Janssen et al., 2011; Zhang et al., 2015) (Fig.-2b). This suggests that chromosome mis-segregation and rearrangements, both very common in cancer, are associated rather than independent phenomena. It is therefore reasonable to hypothesize that tissues with increased rates of aneuploidy will also display increased rates of chromosomal rearrangements. Indeed, micronuclei have been frequently found in cell culture and differentiated cells like lymphocytes (Fenech et al., 2011). Moreover, micronuclei are observed during embryo development, where they often develop into cellular fragments (Alikani et al., 1999; Carbone and Chavez, 2015; Chavez et al., 2012). While the role of aneuploidy is better known in embryonic development and cancer, its implications in normal somatic cells, like neurons and glia, are unclear.
Figure 2. Mechanisms and effects of chromosome segregation errors in mitosis.
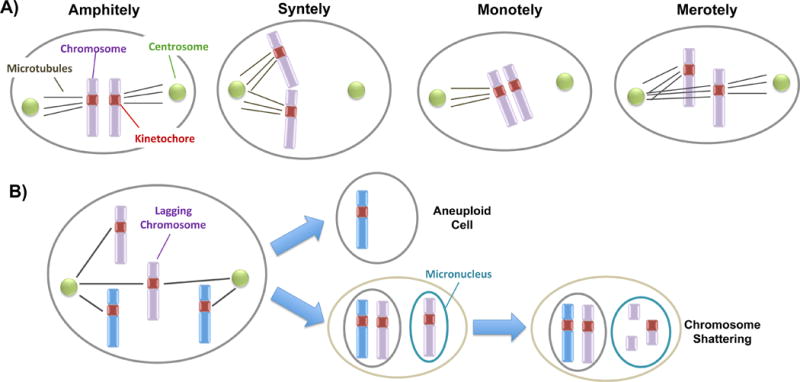
A) The different types of microtubule attachments are shown. Correctly attached sister kinetochores are pulled towards the opposite poles of the spindle (amphitely). In the case of syntely both sister kinetochores are attached to the same pole while in the case of monotely only one of the kinetochores is attached. Finally, in merotely one of the kinetochores is attached to both poles. B) The image shows a scenario in which one of the chromosomes is lagging in anaphase due to a merotelic attachment. As a result, when the nuclear membrane reforms the lagging chromosome is included in a micronucleus and undergoes shattering.
Methods to detect somatic aneuploidy
The exact number of human chromosomes was first identified in 1956 (Tijo and Levan, 1956) thanks to the establishment of techniques for metaphase spreads and karyotyping. Within several years subsequent studies using and perfecting cytogenetic techniques began to unveil the link between inherited abnormal chromosomal counts and numerous human syndromes and diseases (Ford et al., 1959; Jacobs and Strong, 1959; Lejeune et al., 1959). Although variations of the classical karyotyping technique are still used today, there have been a number of technological advancements aimed at increasing the speed, scalability and sensitivity of detecting CNVs and aneuploidy within cells. Here we review these technological advancements and, more specifically, how they have contributed to the current knowledge of somatic CNV in the brain. Additionally, we highlight the main advantages and disadvantages of each method (Fig. 1 and Table 1).
Appropriate investigation of these somatic variations requires high-throughput techniques where a large number of single cells can be analyzed. As the adult brain largely consists of post-mitotic non-dividing neurons, methods relying on dividing cells and mitotic figures, such as classical karyotyping on metaphase spreads, are not suitable for studying somatic aneuploidy in the brain.
The first reports of somatic aneuploidy detection within the non-dividing neurons of the mammalian brain utilized fluorescence in situ hybridization (FISH) on interphase nuclei (interphase FISH or I-FISH) (Rehen et al., 2001; Yang et al., 2001; Yurov et al., 2001). Many of these studies employed the use of several colors of fluorescent probes to different chromosomes so that multiple chromosomes within the same nuclei may be examined for chromosomal gain/loss. Although this has been a powerful tool in establishing the presence of aneuploidy within the brain, several limitations make this technique less desirable. First, FISH generally lacks genome-wide coverage as it relies on the use of a limited number of chromosome-specific probes. Hence, this method cannot simultaneously examine the copy-number of all chromosomes within a given cells. Although spectral karyotyping (SKY) was developed to enable the visualization and detection of all chromosomes within a metaphase spread (Schrock et al., 1996), this method is not suitable for non-dividing cells. Thus, examination of post-mitotic neurons is restricted to I-FISH techniques, limiting copy-number detection to a maximum of five chromosomes per nuclei (Iourov et al., 2009). Second, FISH lacks sensitivity and results in false copy-number gains and losses due to duplications or deletion of the regions recognized by probes, as well as technical artifacts such as probe clustering, cross-hybridization, and failure to hybridize. Finally, FISH is not easily scalable. This method therefore remains a valuable tool for testing more predictable inherited copy number changes; however, because of the issues listed above, it is less suitable for the detection of somatic events.
Cytometry-based methods utilize information on the size and DNA content of nuclei to estimate deviations in diploid DNA content. Although the speed and scalability of this technique is very high, the sensitivity is poor, and there is a complete lack of resolution on the sequences that are impacted in the chromosome loss or gain. Studies utilizing this technique are the frontrunners in terms of the numbers of cells being analyzed, with hundreds of thousands neurons being processed using slide-based cytometry for DNA amounts exceeding diploid level (Arendt et al., 2010; Fischer et al., 2012; Mosch et al., 2007). These methods might provide a “quick and dirty” estimation of changes in diploid DNA content, however they lack the accuracy and resolution needed to infer which chromosomes and/or sub-chromosomal regions have been affected, thus limiting the interpretation of the biological significance of the findings. Hence, while cytometry-based techniques alone are not sufficient for high-resolution detection of copy-number changes, they can be extremely powerful for detecting somatic aneuploidy when used in combination with other methodologies. For instance fluorescent activated cell sorting (FACS) can exploit the use of fluorescent DNA stains, such as DAPI, to make estimates about DNA content and simultaneously sort single cells into individual vessels for downstream molecular analysis (e.g. sequencing). Additionally, the use of a fluorescent antibody for a neuron specific marker (NeuN) to label nuclei, allows researchers to enrich for neuronal and/or non-neuronal populations (McConnell et al., 2013) (Westra et al., 2008).
Since the introduction of single-cell next-generation sequencing (sc-NGS), molecular genetic methods have been at the forefront for the investigation of somatic aneuploidy and CNV in the brain. These techniques provide complete genomic coverage with a high level of sensitivity and resolution (depending on the depth of coverage) and overcome many of the limitations associated with the older techniques mentioned above.
The development of sc-NGS is a direct outcome of fast advances of both Whole Genome Amplification (WGA) and NGS technologies. Even though identifying somatic aneuploidy and CNV using sc-NGS has nearly become standard practice in many molecular biology laboratories, it is still a fairly complex process that involves several technically challenging steps. First, single cells need to be physically isolated from the tissue of interest. In the case of the brain, labs have focused on the isolation of single neuronal nuclei using FACS as this is the only procedure that allows high-throughput isolation of single cells from frozen tissues (Leung et al., 2015). However, validating that single-cells (rather than multiple or zero cells) have truly been isolated usually involves the tedious screening each well via light microscopy. Given the need for scalability in the field (i.e. analysis of thousands of cells/individual), micro-fluidic (White et al., 2011) and droplet-based (Macosko et al., 2015) technologies are likely to replace FACS in the near future.
Second, the genetic content of each cell needs to be amplified using WGA. Current WGA methods have been reviewed in great detail elsewhere (Gawad et al., 2016) (Garvin et al., 2015). Studies targeting somatic mosaicism in the brain, have primarily employed one of three methods: multiple displacement amplification (MDA) (Evrony et al., 2012) alone or in combination with degenerate oligonucleotide primer (DOP-seq) followed by next-generation sequencing (McConnell et al., 2013), (Cai et al., 2014) and multiple annealing and looping-based amplification cycles (MALBAC) (Zong et al., 2012). Generally, MALBAC and DOP-seq seem to perform best for the detection of CNV (Ning et al., 2015) (Garvin et al., 2015).
The final and perhaps most critical steps of sc-NGS are sequencing and data interpretation, which require scientists to take into account technical artifacts, biases and noise introduced during cell isolation and WGA. The main focus of recent studies looking at somatic mosaicism in the brain has been aneuploidy and CNV as these large-scale changes can be detected using lower sequence coverage (i.e. ~5-10%). A wealth of software for CNV discovery in single cells has been generated in the last few years (Baslan et al., 2012; Daley and Smith, 2014; Navin et al., 2011). Worth mentioning is Ginkgo (http://qb.cshl.edu/ginkgo/) (Garvin et al., 2015), a user-friendly, open-source web application for the analysis of sc-NGS data and generation of CNV profiles for single cells (Fig. 3). Importantly, building upon work done by the same group (Baslan et al., 2012), Gingko allows normalizing the sc-NGS data for GC bias and possible amplification biases.
Figure 3. Copy number variation calls in single neurons using Ginkgo.
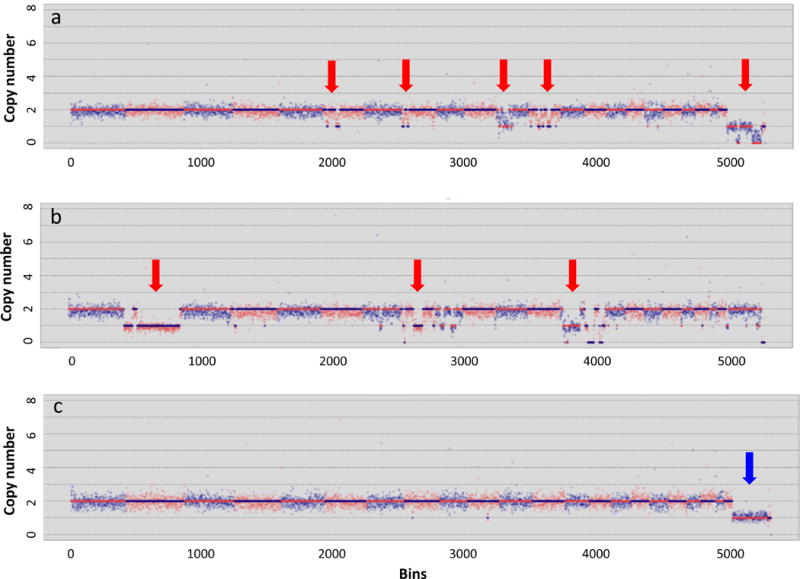
The three plots show examples of single-neuron sequences from the McConnell et al. study (2013) analyzed using the web-application Ginkgo. The first two plots (a and b) are examples of aneuploid neurons in which CNV are indicated by the red arrows. Plot c is an example of an euploid (normal) neuron from a male individual showing that only one copy of the X chromosome is detected (blue arrow).
The cost of sequencing is steadily decreasing. On the other hand the cost associated with generating libraries for a significant number of single neurons in several individuals is still very high. This is the major roadblock to assess the proportion of aneuploid cells in the brain, while accounting for inter- and intra-individual variability.
Somatic aneuploidy in the mouse brain
The mouse is an established biomedical model that presents two distinct advantages: 1) access to fresh tissues that are harvested under controlled conditions; and 2) the possibilities of performing functional studies and establishing transgenic lines. However, some limitations exist with respect to using this model for examining aspects of aneuploidy in the brain, as described in the final section of this review.
Thanks to the easy access of brain tissue, mouse studies have advanced the field in the analysis of somatic aneuploidy (Fig. 1). In particular, a study from Rehen et al. (2001) was the first to show the presence of lagging chromosomes (Fig. 2B) in mitotic cerebral cortical neuroblasts. Since these structures can be cultured and arrested in metaphase through colcemid treatment, SKY could be applied, allowing the analysis of all chromosomes for each metaphase spread in more than 220 neuroblasts. This analysis revealed numerous chromosomal gain and losses, but not structural rearrangements, and reported 33% of the neuroblasts to be aneuploid, in contrast with 2% of adult lymphocytes. These results were also supported by cytometry assays that are independent of nucleotide hybridization used in FISH and SKY. The main hypothesis stemming from this study was that the presence of a population of cells that are genomically different might contribute to the creation of different networks and behavioral variation in the population that cannot be accounted for by classic genetics. Specifically, networks composed of euploid and aneuploid neurons might generate distinct signaling versus a network composed only of euploid cells. This hypothesis is substantiated by functional studies showing that aneuploid neurons can have distant axonal connections and are transcriptionally active (Kingsbury et al., 2005). This was shown by simultaneously labeling mouse brain tissues by FISH, retrograde immunohistochemistry and immunolabeling.
One key question that neuroscientists have strived to address using the mouse model is the developmental fate of aneuploid neurons. Are these cells subject to cell death more often than euploid cells or do they have a selective advantage as observed in cancer cells? One to address this question is to measure changes in the proportion of aneuploid cells with aging. This is still a fairly unexplored area in human studies that can more easily be investigated using animal models. Faggioli et al. (2012) investigated the frequency of aneuploidy in the cerebral cortex in mouse during aging using a two-probe interphase FISH in order to score both gains and losses. This study confirmed previously reported high levels of aneuploidy (1% per chromosome) and showed a ~2-fold increase in 28 month old mice (n=11) in comparison to 4 years old (n=6) and 15 years old (n=3) mice, suggesting that the proportion of aneuploid cells increases with age. Of note, three out of the eight tested chromosomes (i.e. chromosomes 7, 18 and Y) made the largest contribution to this phenomenon. Moreover, only the non-neuronal population of cells (glia) contributed to the age-related increase of aneuploidy based on tests done on three mice using probes for chromosomes 1 and 18, suggesting that chromosome segregation errors might be more frequent with aging, and that aneuploidy in the aging brain is a characteristic of glia and not neurons. However, limitations of this study include the small sample size and the analysis of only eight chromosomes (Faggioli et al., 2012).
A more recent sc-NGS study challenged the results from the cytogenetics-based studies described above. Specifically, (Knouse et al., 2014) isolated neuronal progenitor cells and adult neurons from mice and subjected them to NGS and CNV calling. Their results show very low levels (~1%) of aneuploidy both in the embryonic and adult brain. However, the number of cells analyzed in each of their experiments is extremely small (as few as 9 cells).
Somatic aneuploidy detection in the human brain
The studies described above show that the use of mouse models has been integral for the establishment of techniquesand investigating the functional significance of copy number changes in the brain. The next obvious step is translation to human with the long-term goal of uncovering possible correlations between these somatic mutations and human health. Using similar strategies to the ones employed in mouse, a number of studies have focused on characterization of somatic mosaicism using post-mortem human brain tissues.
Variations in the normal diploid DNA content within the human brain was first reported only about 50 years ago (Müller, 1962). The establishment of modern molecular cytogenetic and genetic techniques combined with an increased accessibility to banked human tissues, have enabled many advances in the examination of somatic CNV in the brain.
As with mouse, early investigations in human utilized FISH-based techniques that were aimed at testing a possible contribution of these mutations to disease by comparing post-mortem brains from patients affected by neurological diseases to healthy brain tissue. DNA/chromosome losses were largely ignored, as it was not possible to distinguish true losses from failed hybridization of the FISH probe. Instead, these initial studies focused on the possible association of somatic DNA/chromosomal gains with Alzheimer disease (Yang et al., 2001) and schizophrenia (Yurov et al., 2001). Both studies report the presence of chromosome gains that were not observed in healthy brains.
The next wave of investigations of CNV in human brain also utilized FISH-based techniques, but included additional controls for the assessment of both chromosomal losses and gains. Besides the novel ability to detect chromosome losses, these studies were more powerful than previous investigations because they analyzed more subjects as well as more cells per individual. Overall, these studies report inconsistent levels of somatic CNV within healthy human brain. For instance, three independent assessments of chromosome 21 aneuploidy in adult human brain varied from <1% (Westra et al., 2008), ~4% (Rehen et al., 2005) and ~11% (Thomas and Fenech, 2008). Across all specific loci and chromosomes examined, the percentage of aneuploidy per chromosome ranged from <1% to 14.9%. Several studies extrapolate these numbers to estimate the percentage of aneuploidy affecting all chromosomes, and have suggested that 38-48% of nuclei in healthy adult human brain are aneuploid (Pack et al., 2005), while approximately 30-35% of embryonic human brain nuclei are aneuploid (Yurov et al., 2007). Overall these studies highlight a vast variability across FISH-based studies that, together with the fact that only a handful of chromosomes can be analyzed in each experiment, make this approach quite limited in scope. On the other hand, these reports ultimately aided in establishing the existence of somatic CNV within healthy human brain tissue and fueled the need for additional higher-throughput and higher resolution investigations.
Investigations aimed at increasing the throughput in comparison to the FISH-based studies used cytometry-based methods to increase the number of nuclei examined from several hundred (500-1800) to thousands (10,000-120,000) of nuclei per case (Arendt et al., 2010; Mosch et al., 2007) (Fig. 1 and Table 1). The results across these studies were generally consistent, suggesting that approximately 10% of neurons within healthy adult human brain displayed excess (hyperdiploid) DNA content (Mosch et al., 2007); (Arendt et al., 2010; Fischer et al., 2012), which is significantly greater than what is observed in blood and liver (Westra et al., 2010). Although, the need for a higher throughput was met, the complete lack of genomic resolution strongly limited the interpretation of the biological relevance of the results.
Soon after its introduction, sc-NGS became the mostly used methodology for detection of somatic aneuploidy (Navin et al., 2011). Given the fairly high-costs of single cell isolation and library preparation, sc-NGS studies have so far analyzed a limited number (<200) of cells (Gawad et al., 2016). These preliminary studies suggest that aneuploidy in the brain is less prominent than what shown by FISH and cytometry based studies with percentages ranging from 0% (Cai et al., 2014) to <3% (McConnell et al., 2013) (Knouse et al., 2014). On the other hand, these studies have revealed the prevalence of somatic sub-chromosomal CNV within the brain, with McConnell reporting ~41% and Cai reporting ~68% of neurons containing at least once large-scale (Define/give size range) somatic CNV. Currently, the time and cost of library preparation and sequencing is steadily declining, making large-scale studies analyzing thousands of single cells across multiple biological replicates possible. For example, Van den Bos, et al. recently published a study using sc-NGS to study somatic aneuploidy in nearly 1,500 brain cells. Only a subset of these cells were from healthy brain tissue, and similar to the results of other sc-NGS studies only ~0.7% (4/589) were determined to be aneuploid (van den Bos et al., 2016b).
Why do we need a new model?
The findings described above demonstrate that, while the presence of somatic aneuploidy in both the human and mouse brain is not under debate, its prevalence is highly controversial. Some of the discrepancies are certainly linked to the resolution and throughput of the techniques that have been used to investigate this phenomenon. Here we argue that some of the shortcomings of previous studies stem from the use of mouse or human tissue and propose that the use of non-human primate tissues, in particular rhesus macaque, could greatly advance the field.
Mouse studies have several recognizable advantages, including the possibility of collecting high quality tissue samples in controlled conditions. Moreover, the mouse brain is not nearly as variable as the primate brain, making it much easier to reliably test the same regions in different individuals. Additionally, the possibility of performing functional studies, obtaining transgenics and the presence of detailed anatomical maps (i.e. Allen Brain Atlas) are all very appealing features of this model. Finally, most existing behavioral tests have been developed for rodents and now well established in the neuroscience community. At the same time, this model carries significant drawbacks when it comes to the field of neuroscience mostly stemming from the vast anatomical and physiological differences between the mouse and the human brain. The neocortex is the center of human cognitive ability and displays a huge disparity in surface area between mouse and human (1:1000X) (Fig. 4) (Rakic, 2009). In addition, the mouse neocortex lacks gyrification. As a consequence, it is difficult to compare the anatomy and function underlying higher cognitive activities in the mouse to that of humans. Hence, while we believe that studies on somatic aneuploidy in the mouse brain have been instrumental from a mechanistic standpoint, they carry gross limitations in defining and translating to human the possible effects on cognition of this phenomenon (Fig. 5).
Figure 4. Comparison between the brain of a mouse, a rhesus macaque and a human.
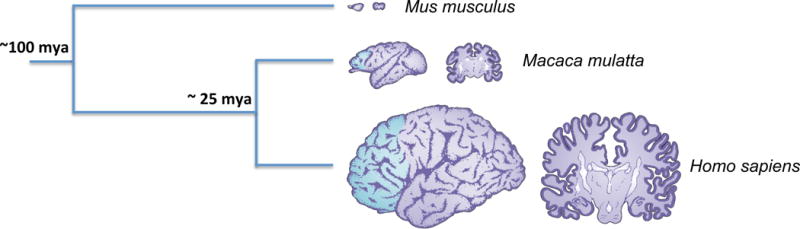
A phylogenetic tree is shown indicating the times of divergence between the three species. At the end of each branch we report the cerebral hemisphere of each species drawn to approximately the same scale to show the difference in size that exists between these three species. The prefrontal cortex (not present in mouse) is shaded in blue in macaque and human. Next to each hemisphere, we report the cerebral sections. [Figure modified from Racik 2013, Evolution of the neocortex: a perspective from developmental biology, Nat Rev Neurosci. 2009 Oct; 10(10): 724–735.]
Figure 5. Comparison between mouse, macaque and human.
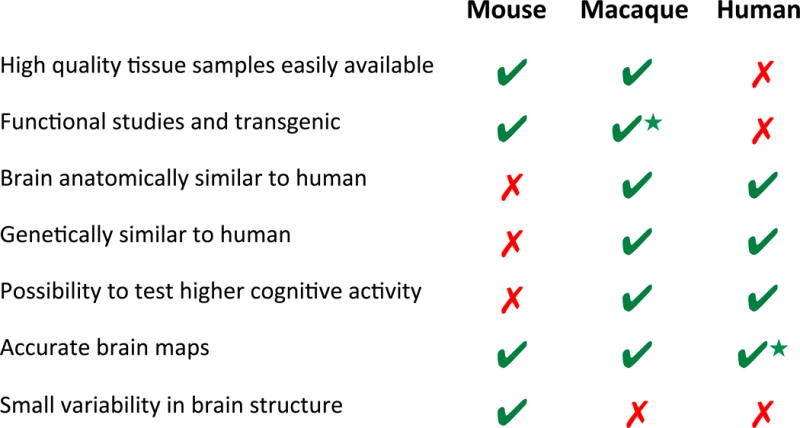
This table illustrates a series of features that are desirable for the study of somatic mosaicism in the brain. A green checkmark indicates that a given feature is present in the corresponding species while a red cross indicates that it is absent. The star near the green checkmark indicates that, although the feature is present, it is not as fully developed or accessible as one of the other species (i.e. generating transgenic monkeys is not as easy as generating transgenic mice).
A large part of the field has been focusing on somatic aneuploidy in the human brain. Human studies have the obvious advantage of being directly applicable to human health and permit direct comparisons of normal and disease brains. At the same time, though, human studies are exceedingly limited with respect to the availability of ideal tissue samples. First, collection of post-mortem tissues is often associated with limited information on the individual’s life, posing a problem of a lack of knowledge about confounding environmental factors. Harvesting of samples is also not as controlled as for laboratory animals and often occurs sometime after death. Finally, portions of brain might be obtained from lesions or surgeries, as in the case of samples isolated from epilepsy patients. Nevertheless, such samples are treated as “healthy brain” in studies (Poduri et al., 2013). Because of the paucity of samples, human studies have not achieved samples sizes larger than 6 individuals using sc-NGS (van den Bos et al., 2016a), hence they are hardly representative of the whole species. Furthermore, transgenic, longitudinal studies and possible intervention necessary to study the effects of aging and environmental factors on somatic mosaicism in the brain are not feasible in human.
Among all animal models currently used for neuroscience experiments, the monkey possesses a brain that is the most similar to human (Fig. 4) (Roelfsema and Treue, 2014). Given the high value associated with every animal and the fact that non-human primate research is not undertaken lightly, institutes make strong efforts to bank as many tissues as possible, including brain samples (e.g. see http://matrr.com/), making this valuable resource available to the scientific community at large. Because these animals live in the same colony, are fed the same diet, are not normally exposed to external factors (e.g. drugs, alcohol, pollution) and their medical history is accurately documented, confounding factors are minimal. Moreover, collection of samples occurs immediately after the animals are sacrificed under extremely controlled conditions. Furthermore, transgenic non-human primate are becoming increasingly popular to study neurological diseases (Chan, 2013; Pouladi et al., 2013) and the development of genetic editing through CRISPR/cas9 (Mali et al., 2013) is likely to substantially increase the feasibility of generating disease models. Finally, similar to mouse and human, very detailed maps are now available for the macaque brain (e.g. http://cocomac.g-node.org/main/index.php) (Bakken et al., 2016). This model, therefore, provides many of the same advantages of mouse but is genetically, physiologically and anatomically more similar to human. The similarities between human and macaque become particularly crucial when thinking about the long-term goals of studying somatic mosaicism in the brain. This includes analyzing the possible effects of this phenomenon on cognitive abilities, a notable shortcoming of the mouse model. Monkeys can be trained to perform tasks that are impossible to replicate in mouse, and studies of higher aspects of perception and cognition can only be carried in non-human primates (Rakic, 2009) (Fig. 4).
Conclusions and future prospective
We reviewed progress made in studying somatic aneuploidy and CNVs in the brain. Although the field has advanced significantly and moved toward sequence-based techniques, leaving less quantitative approaches (e.g. cytogenetics) behind, there is still deep controversy with respect to the prevalence of CNV and aneupolidy in neurons and glia. Some of the differences observed in the studies mentioned above could be due to the inclusion of different developmental ages and/or the different levels of resolution of the method used to measure aneuploidy. Irrespective of these issues, a higher throughput in both number of cells and number of individuals analyzed is needed in order to account for inter- and intra-specific variability. While this can be more easily achieved using mouse samples, we have outlined several limitations of this model and we argue that the banked tissues from non-human primates could provide the same number of high-quality samples but in a model genetically, physiologically and anatomically more similar to human. This would enable a more direct translation to human, particularly as it relates to the analysis of functional effects of somatic mosaicism on cognition.
Acknowledgments
The authors are grateful to Dr. Steven Kohama for reviewing and providing comments on this manuscript. They also thank members of the Carbone and Chavez lab for helpful discussions and apologize to these authors whose work they were unable to describe.
Funding
Jimi Rosenkrantz is supported by the Collins Medical Trust Foundation and Glenn/AFAR Scholarship for Research in the Biology of Aging. Lucia Carbone is supported by the Office of the Director/Office of Research Infrastructure Programs (OD/ORIP) of the NIH (grant no. OD011092).
Footnotes
Conflict of Interest
Jimi Rosenkrantz declares that she has no conflict of interest.
Lucia Carbone declares that she has no conflict of interest.
Ethical approval
This article does not contain any studies with human participants or animals performed by any of the authors.
References
- Alikani M, Cohen J, Tomkin G, Garrisi GJ, Mack C, Scott RT. Human embryo fragmentation in vitro and its implications for pregnancy and implantation. Fertil Steril. 1999;71:836–842. doi: 10.1016/s0015-0282(99)00092-8. [DOI] [PubMed] [Google Scholar]
- Arendt T, Brückner MK, Mosch B, Lösche A. Selective cell death of hyperploid neurons in Alzheimer’s disease. The American journal of pathology. 2010;177 doi: 10.2353/ajpath.2010.090955. [DOI] [PMC free article] [PubMed] [Google Scholar]
- Bakken TE, Miller JA, Ding SL, Sunkin SM, Smith KA, Ng L, Szafer A, Dalley RA, Royall JJ, Lemon T, et al. A comprehensive transcriptional map of primate brain development. Nature. 2016 doi: 10.1038/nature18637. [DOI] [PMC free article] [PubMed] [Google Scholar]
- Baslan T, Kendall J, Rodgers L, Cox H, Riggs M, Stepansky A, Troge J, Ravi K, Esposito D, Lakshmi B, et al. Genome-wide copy number analysis of single cells. Nature protocols. 2012;7:1024–1041. doi: 10.1038/nprot.2012.039. [DOI] [PMC free article] [PubMed] [Google Scholar]
- Bushman DM, Chun J. The genomically mosaic brain: aneuploidy and more in neural diversity and disease. Semin Cell Dev Biol. 2013;24:357–369. doi: 10.1016/j.semcdb.2013.02.003. [DOI] [PMC free article] [PubMed] [Google Scholar]
- Cai X, Evrony GD, Lehmann HS, Elhosary PC, Mehta BK, Poduri A, Walsh CA. Single-cell, genome-wide sequencing identifies clonal somatic copy-number variation in the human brain. Cell reports. 2014;8 doi: 10.1016/j.celrep.2014.07.043. [DOI] [PMC free article] [PubMed] [Google Scholar]
- Carbone L, Chavez SL. Mammalian pre-implantation chromosomal instability: species comparison, evolutionary considerations, and pathological correlations. Systems biology in reproductive medicine. 2015;61:321–335. doi: 10.3109/19396368.2015.1073406. [DOI] [PMC free article] [PubMed] [Google Scholar]
- Chan AW. Progress and prospects for genetic modification of nonhuman primate models in biomedical research. ILAR J. 2013;54:211–223. doi: 10.1093/ilar/ilt035. [DOI] [PMC free article] [PubMed] [Google Scholar]
- Chavez SL, Loewke KE, Han J, Moussavi F, Colls P, Munne S, Behr B, Reijo Pera RA. Dynamic blastomere behaviour reflects human embryo ploidy by the four-cell stage. Nature communications. 2012;3:1251. doi: 10.1038/ncomms2249. [DOI] [PMC free article] [PubMed] [Google Scholar]
- Cimini D. Merotelic kinetochore orientation, aneuploidy, and cancer. Biochimica et biophysica acta. 2008;1786:32–40. doi: 10.1016/j.bbcan.2008.05.003. [DOI] [PubMed] [Google Scholar]
- Crasta K, Ganem NJ, Dagher R, Lantermann AB, Ivanova EV, Pan Y, Nezi L, Protopopov A, Chowdhury D, Pellman D. DNA breaks and chromosome pulverization from errors in mitosis. Nature. 2012;482:53–58. doi: 10.1038/nature10802. [DOI] [PMC free article] [PubMed] [Google Scholar]
- Daley T, Smith AD. Modeling genome coverage in single-cell sequencing. Bioinformatics. 2014;30:3159–3165. doi: 10.1093/bioinformatics/btu540. [DOI] [PMC free article] [PubMed] [Google Scholar]
- Evrony GD, Cai X, Lee E, Hills LB, Elhosary PC, Lehmann HS, Parker JJ, Atabay KD, Gilmore EC, Poduri A, et al. Single-neuron sequencing analysis of L1 retrotransposition and somatic mutation in the human brain. Cell. 2012;151:483–496. doi: 10.1016/j.cell.2012.09.035. [DOI] [PMC free article] [PubMed] [Google Scholar]
- Faggioli F, Wang T, Vijg J, Montagna C. Chromosome-specific accumulation of aneuploidy in the aging mouse brain. Human molecular genetics. 2012;21:5246–5253. doi: 10.1093/hmg/dds375. [DOI] [PMC free article] [PubMed] [Google Scholar]
- Fenech M, Kirsch-Volders M, Natarajan AT, Surralles J, Crott JW, Parry J, Norppa H, Eastmond DA, Tucker JD, Thomas P. Molecular mechanisms of micronucleus, nucleoplasmic bridge and nuclear bud formation in mammalian and human cells. Mutagenesis. 2011;26:125–132. doi: 10.1093/mutage/geq052. [DOI] [PubMed] [Google Scholar]
- Fischer HG, Morawski M, Brückner MK, Mittag A, Tarnok A, Arendt T. Changes in neuronal DNA content variation in the human brain during aging. Aging cell. 2012;11 doi: 10.1111/j.1474-9726.2012.00826.x. [DOI] [PubMed] [Google Scholar]
- Ford CE, Jones KW, Polani PE, De Almeida JC, Briggs JH. A sex-chromosome anomaly in a case of gonadal dysgenesis (Turner’s syndrome) Lancet. 1959;1:711–713. doi: 10.1016/s0140-6736(59)91893-8. [DOI] [PubMed] [Google Scholar]
- Garvin T, Aboukhalil R, Kendall J, Baslan T, Atwal GS, Hicks J, Wigler M, Schatz MC. Interactive analysis and assessment of single-cell copy-number variations. Nat Methods. 2015;12:1058–1060. doi: 10.1038/nmeth.3578. [DOI] [PMC free article] [PubMed] [Google Scholar]
- Gawad C, Koh W, Quake SR. Single-cell genome sequencing: current state of the science. Nat Rev Genet. 2016;17:175–188. doi: 10.1038/nrg.2015.16. [DOI] [PubMed] [Google Scholar]
- Gladyshev VN. Aging: progressive decline in fitness due to the rising deleteriome adjusted by genetic, environmental, and stochastic processes. Aging Cell. 2016 doi: 10.1111/acel.12480. [DOI] [PMC free article] [PubMed] [Google Scholar]
- Iourov IY, Vorsanova SG, Liehr T, Yurov YB. Aneuploidy in the normal, Alzheimer’s disease and ataxia-telangiectasia brain: differential expression and pathological meaning. Neurobiology of disease. 2009;34:212–220. doi: 10.1016/j.nbd.2009.01.003. [DOI] [PubMed] [Google Scholar]
- Jacobs PA, Strong JA. A case of human intersexuality having a possible XXY sex-determining mechanism. Nature. 1959;183:302–303. doi: 10.1038/183302a0. [DOI] [PubMed] [Google Scholar]
- Janssen A, van der Burg M, Szuhai K, Kops GJ, Medema RH. Chromosome segregation errors as a cause of DNA damage and structural chromosome aberrations. Science. 2011;333:1895–1898. doi: 10.1126/science.1210214. [DOI] [PubMed] [Google Scholar]
- Kingsbury MA, Friedman B, McConnell MJ, Rehen SK, Yang AH, Kaushal D, Chun J. Aneuploid neurons are functionally active and integrated into brain circuitry. Proceedings of the National Academy of Sciences of the United States of America. 2005;102:6143–6147. doi: 10.1073/pnas.0408171102. [DOI] [PMC free article] [PubMed] [Google Scholar]
- Knouse K, Wu J, Whittaker C, Amon A. Single cell sequencing reveals low levels of aneuploidy across mammalian tissues. Proceedings of the National Academy of Sciences. 2014;111 doi: 10.1073/pnas.1415287111. [DOI] [PMC free article] [PubMed] [Google Scholar]
- Kolano A, Brunet S, Silk AD, Cleveland DW, Verlhac MH. Error-prone mammalian female meiosis from silencing the spindle assembly checkpoint without normal interkinetochore tension. Proceedings of the National Academy of Sciences of the United States of America. 2012;109:E1858–1867. doi: 10.1073/pnas.1204686109. [DOI] [PMC free article] [PubMed] [Google Scholar]
- Lejeune J, Gautier M, Turpin R. Les chromosomes somatique des enfants mongoliens. Comptes rendus hebdomadaires des séances de l’Académie des sciences. 1959;248 [PubMed] [Google Scholar]
- Leung ML, Wang Y, Waters J, Navin NE. SNES: single nucleus exome sequencing. Genome Biol. 2015;16:55. doi: 10.1186/s13059-015-0616-2. [DOI] [PMC free article] [PubMed] [Google Scholar]
- Macosko EZ, Basu A, Satija R, Nemesh J, Shekhar K, Goldman M, Tirosh I, Bialas AR, Kamitaki N, Martersteck EM, et al. Highly Parallel Genome-wide Expression Profiling of Individual Cells Using Nanoliter Droplets. Cell. 2015;161:1202–1214. doi: 10.1016/j.cell.2015.05.002. [DOI] [PMC free article] [PubMed] [Google Scholar]
- Mali P, Yang L, Esvelt KM, Aach J, Guell M, DiCarlo JE, Norville JE, Church GM. RNA-guided human genome engineering via Cas9. Science. 2013;339:823–826. doi: 10.1126/science.1232033. [DOI] [PMC free article] [PubMed] [Google Scholar]
- McConnell MJ, Lindberg MR, Brennand KJ, Piper JC, Voet T, Cowing-Zitron C, Shumilina S, Lasken RS, Vermeesch JR, Hall IM, et al. Mosaic copy number variation in human neurons. Science. 2013;342:632–637. doi: 10.1126/science.1243472. [DOI] [PMC free article] [PubMed] [Google Scholar]
- Mosch B, Morawski M, Mittag A, Lenz D, Tarnok A, Arendt T. Aneuploidy and DNA Replication in the Normal Human Brain and Alzheimer’s Disease. The Journal of Neuroscience. 2007;27:6859–6867. doi: 10.1523/JNEUROSCI.0379-07.2007. [DOI] [PMC free article] [PubMed] [Google Scholar]
- Müller HA. Cytophotometrische DNS-Messungen an ganglienzellkernen des nucleus dentatus beim menschen. Naturwissenschaften 1962 [Google Scholar]
- Muotri AR, Gage FH. Generation of neuronal variability and complexity. Nature. 2006;441:1087–1093. doi: 10.1038/nature04959. [DOI] [PubMed] [Google Scholar]
- Navin N, Kendall J, Troge J, Andrews P, Rodgers L, McIndoo J, Cook K, Stepansky A, Levy D, Esposito D, et al. Tumour evolution inferred by single-cell sequencing. Nature. 2011;472:90–94. doi: 10.1038/nature09807. [DOI] [PMC free article] [PubMed] [Google Scholar]
- Ning L, Li Z, Wang G, Hu W, Hou Q, Tong Y, Zhang M, Chen Y, Qin L, Chen X, et al. Quantitative assessment of single-cell whole genome amplification methods for detecting copy number variation using hippocampal neurons. Sci Rep. 2015;5:11415. doi: 10.1038/srep11415. [DOI] [PMC free article] [PubMed] [Google Scholar]
- Pack SD, Weil RJ, Vortmeyer AO, Zeng W, Li J, Okamoto H, Furuta M, Pak E, Lubensky IA, Oldfield EH, et al. Individual adult human neurons display aneuploidy: detection by fluorescence in situ hybridization and single neuron PCR. Cell cycle (Georgetown, Tex) 2005;4 doi: 10.4161/cc.4.12.2153. [DOI] [PubMed] [Google Scholar]
- Peterson SE, Yang AH, Bushman DM, Westra JW, Yung YC, Barral S, Mutoh T, Rehen SK, Chun J. Aneuploid cells are differentially susceptible to caspase-mediated death during embryonic cerebral cortical development. The Journal of neuroscience: the official journal of the Society for Neuroscience. 2012;32:16213–16222. doi: 10.1523/JNEUROSCI.3706-12.2012. [DOI] [PMC free article] [PubMed] [Google Scholar]
- Poduri A, Evrony GD, Cai X, Walsh CA. Somatic mutation, genomic variation, and neurological disease. Science. 2013;341:1237758. doi: 10.1126/science.1237758. [DOI] [PMC free article] [PubMed] [Google Scholar]
- Pouladi MA, Morton AJ, Hayden MR. Choosing an animal model for the study of Huntington’s disease. Nature reviews Neuroscience. 2013;14:708–721. doi: 10.1038/nrn3570. [DOI] [PubMed] [Google Scholar]
- Rakic P. Evolution of the neocortex: a perspective from developmental biology. Nature reviews Neuroscience. 2009;10:724–735. doi: 10.1038/nrn2719. [DOI] [PMC free article] [PubMed] [Google Scholar]
- Rehen SK, McConnell MJ, Kaushal D, Kingsbury MA, Yang AH, Chun J. Chromosomal variation in neurons of the developing and adult mammalian nervous system. Proceedings of the National Academy of Sciences of the United States of America. 2001;98:13361–13366. doi: 10.1073/pnas.231487398. [DOI] [PMC free article] [PubMed] [Google Scholar]
- Rehen SK, Yung YC, McCreight MP, Kaushal D, Yang AH, Almeida BS, Kingsbury MA, Cabral KM, McConnell MJ, Anliker B, et al. Constitutional aneuploidy in the normal human brain. The Journal of neuroscience: the official journal of the Society for Neuroscience. 2005;25:2176–2180. doi: 10.1523/JNEUROSCI.4560-04.2005. [DOI] [PMC free article] [PubMed] [Google Scholar]
- Roelfsema PR, Treue S. Basic neuroscience research with nonhuman primates: a small but indispensable component of biomedical research. Neuron. 2014;82:1200–1204. doi: 10.1016/j.neuron.2014.06.003. [DOI] [PubMed] [Google Scholar]
- Samora CP, Mogessie B, Conway L, Ross JL, Straube A, McAinsh AD. MAP4 and CLASP1 operate as a safety mechanism to maintain a stable spindle position in mitosis. Nat Cell Biol. 2011;13:1040–1050. doi: 10.1038/ncb2297. [DOI] [PubMed] [Google Scholar]
- Schrock E, du Manoir S, Veldman T, Schoell B, Wienberg J, Ferguson-Smith MA, Ning Y, Ledbetter DH, Bar-Am I, Soenksen D, et al. Multicolor spectral karyotyping of human chromosomes. Science. 1996;273:494–497. doi: 10.1126/science.273.5274.494. [DOI] [PubMed] [Google Scholar]
- Singer T, McConnell MJ, Marchetto MC, Coufal NG, Gage FH. LINE-1 retrotransposons: mediators of somatic variation in neuronal genomes? Trends Neurosci. 2010;33:345–354. doi: 10.1016/j.tins.2010.04.001. [DOI] [PMC free article] [PubMed] [Google Scholar]
- Thomas P, Fenech M. Chromosome 17 and 21 aneuploidy in buccal cells is increased with ageing and in Alzheimer’s disease. Mutagenesis. 2008;23 doi: 10.1093/mutage/gem044. [DOI] [PubMed] [Google Scholar]
- Thompson SL, Bakhoum SF, Compton DA. Mechanisms of chromosomal instability. Current biology: CB. 2010;20:R285–295. doi: 10.1016/j.cub.2010.01.034. [DOI] [PMC free article] [PubMed] [Google Scholar]
- Tijo JH, Levan A. The chromosome number of man. Hereditas. 1956;42 [Google Scholar]
- van den Bos H, Spierings DC, Taudt AS, Bakker B, Porubsky D, Falconer E, Novoa C, Halsema N, Kazemier HG, Hoekstra-Wakker K, et al. Single-cell whole genome sequencing reveals no evidence for common aneuploidy in normal and Alzheimer’s disease neurons. Genome Biol. 2016a;17:116. doi: 10.1186/s13059-016-0976-2. [DOI] [PMC free article] [PubMed] [Google Scholar]
- van den Bos H, Spierings DCJ, Taudt AS, Bakker B, Porubský D, Falconer E, Novoa C, Halsema N, Kazemier HG, Hoekstra-Wakker K, et al. Single-cell whole genome sequencing reveals no evidence for common aneuploidy in normal and Alzheimer’s disease neurons. Genome Biology. 2016b;17:1–9. doi: 10.1186/s13059-016-0976-2. [DOI] [PMC free article] [PubMed] [Google Scholar]
- Westra JW, Peterson SE, Yung YC, Mutoh T, Barral S, Chun J. Aneuploid mosaicism in the developing and adult cerebellar cortex. The Journal of comparative neurology. 2008;507:1944–1951. doi: 10.1002/cne.21648. [DOI] [PubMed] [Google Scholar]
- Westra JW, Rivera RR, Bushman DM, Yung YC, Peterson SE, Barral S, Chun J. Neuronal DNA content variation (DCV) with regional and individual differences in the human brain. Journal of Comparative Neurology. 2010;518:3981–4000. doi: 10.1002/cne.22436. [DOI] [PMC free article] [PubMed] [Google Scholar]
- White AK, VanInsberghe M, Petriv OI, Hamidi M, Sikorski D, Marra MA, Piret J, Aparicio S, Hansen CL. High-throughput microfluidic single-cell RT-qPCR. Proceedings of the National Academy of Sciences of the United States of America. 2011;108:13999–14004. doi: 10.1073/pnas.1019446108. [DOI] [PMC free article] [PubMed] [Google Scholar]
- Yang Y, Geldmacher DS, Herrup K. DNA replication precedes neuronal cell death in Alzheimer’s disease. The Journal of neuroscience: the official journal of the Society for Neuroscience. 2001;21:2661–2668. doi: 10.1523/JNEUROSCI.21-08-02661.2001. [DOI] [PMC free article] [PubMed] [Google Scholar]
- Yurov YB, Iourov IY, Vorsanova SG, Liehr T, Kolotii AD, Kutsev SI, Pellestor F, Beresheva AK, Demidova I, Kravets VS, et al. Aneuploidy and confined chromosomal mosaicism in the developing human brain. PloS one. 2007;2 doi: 10.1371/journal.pone.0000558. [DOI] [PMC free article] [PubMed] [Google Scholar]
- Yurov YB, Vostrikov VM, Vorsanova SG, Monakhov VV, Iourov IY. Multicolor fluorescent in situ hybridization on post-mortem brain in schizophrenia as an approach for identification of low-level chromosomal aneuploidy in neuropsychiatric diseases. Brain & development. 2001;23 doi: 10.1016/s0387-7604(01)00363-1. [DOI] [PubMed] [Google Scholar]
- Zhang CZ, Spektor A, Cornils H, Francis JM, Jackson EK, Liu S, Meyerson M, Pellman D. Chromothripsis from DNA damage in micronuclei. Nature. 2015;522:179–184. doi: 10.1038/nature14493. [DOI] [PMC free article] [PubMed] [Google Scholar]
- Zong C, Lu S, Chapman AR, Xie XS. Genome-wide detection of single-nucleotide and copy-number variations of a single human cell. Science. 2012;338:1622–1626. doi: 10.1126/science.1229164. [DOI] [PMC free article] [PubMed] [Google Scholar]