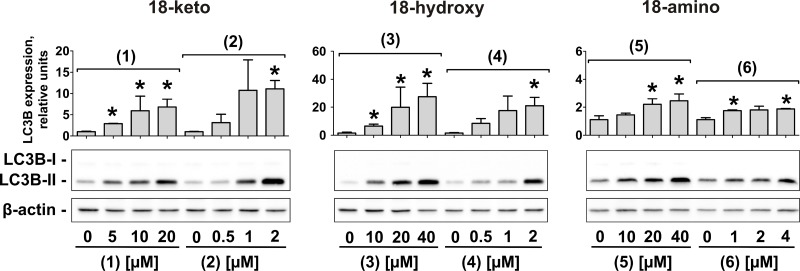
Figure 4. Inhibition of autophagy in human prostate cancer cells under treatment with the compounds (1)–(6).
Western blotting analysis of LC3B-I/II proteins in PC-3 cells treated with different concentrations of the compounds (1) – (6) for 48 h. The signal intensity was quantified with Quantity One 4.6 software and normalized to the signal of β-actin. *p < 0.05 (Student's t-test).

