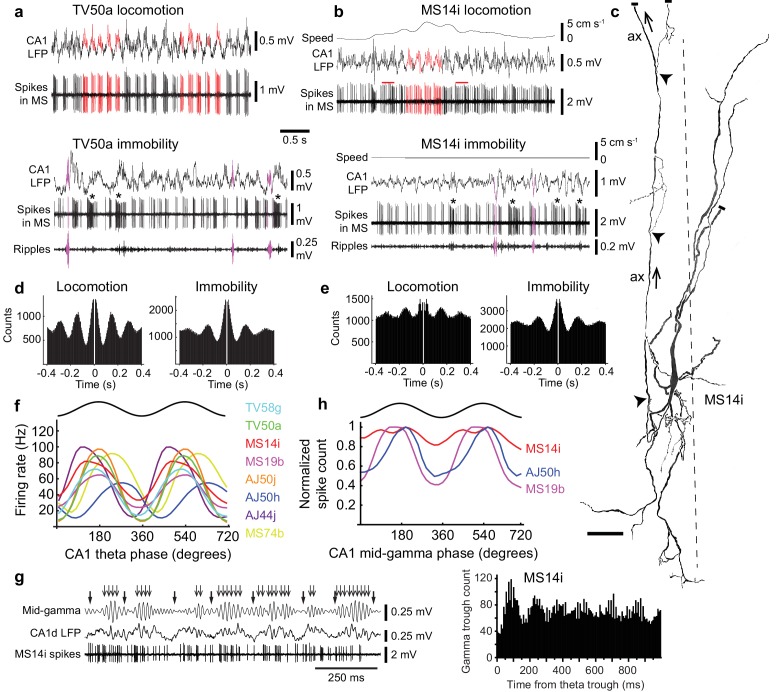
Figure 2. Firing patterns of medial septal neurons projecting to the EC.
(a) Top, rhythmic burst firing of EC-projecting medial septal neuron TV50a during locomotion. CA1 LFP, local field potential in SP. Red, examples of bursts of spikes associated with peaks of CA1 theta oscillations. Bottom, rhythmic burst firing during immobility with some spikes during some SWRs (magenta; 130–230 Hz filtered CA1 LFP). Examples of long accommodating bursts are shown below the asterisks. (b) Same as in (a) for another EC-projecting neuron, MS14i, which fires less rhythmic bursts at high rate during locomotion (top) and rhythmic bursts during immobility (bottom). Red bars, examples of bursts spanning two theta cycles. (c) Reconstruction of the soma, dendrites, and axon (ax; arrows: towards dorsal fornix) of MS14i in the tip of dorsal MS. Dashed line, midline. Local axon collaterals, which give rise to terminals, are marked by arrowheads. Cut ends not included in the reconstruction are marked by small bars. Scale bar, 50 μm. (d,e) Autocorrelograms of spikes during locomotion and immobility for TV50a (d) and MS14i (e). (f) Firing rate versus CA1 theta phase plots show preferential firing near the peak of theta during movement (locomotion and small movements) for eight labeled neurons (color-coded) projecting to extra-hippocampal regions. Black, sinusoid representation of two idealized cycles. Data are duplicated to represent rhythmicity. (g) Left, part of the time series from (a) during locomotion displaying several theta cycles in the unfiltered LFP (thick arrows mark theta troughs), and 55–80 Hz filtered LFP mid-gamma cycles (thin arrows mark high amplitude gamma troughs). Note that gamma troughs occur mostly at the peak of theta cycles. Right, event correlation of detected mid-gamma troughs relative to theta troughs from the MS14i recorded CA1d LFP. Note peak around 100 ms corresponding to the peak of theta cycles. (h) Normalized spike count versus CA1 mid-gamma phase for all significantly coupled EC-projecting neurons (see also Table 3).


