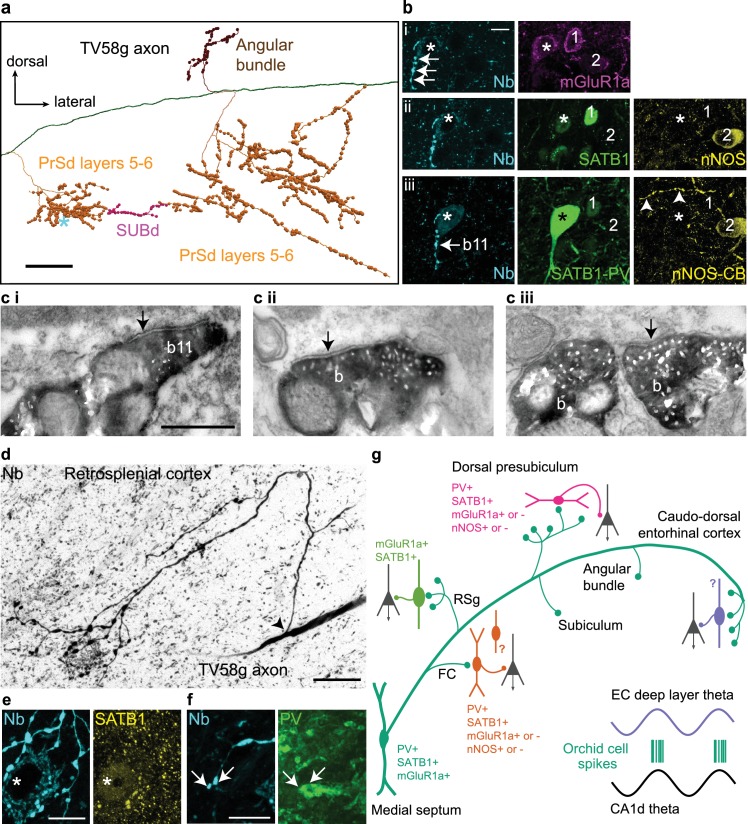
Figure 4. Postsynaptic GABAergic target neurons of a GABAergic orchid cell, TV58g.
(a) Selected collaterals and varicosities (see Figure 2a). Asterisk, location of target neuron in b. (b) Boutons (cyan, neurobiotin, arrows) in the PrSd (asterisk in a) are apposed to a neuron immunopositive for mGluR1a (i, top, magenta, somato-dendritic membrane), SATB1 (ii, middle, green, nucleus), and PV (iii, bottom, green) but lacking detectable immunoreactivity for both nNOS (ii, yellow) and CB (iii, yellow). Arrowheads in iii (bottom right) highlight a CB-immunoreactive process. Two neighboring PV-immunonegative neurons (1, 2) were not targeted. (c) Electron micrographs of synapses (arrows) made by boutons (b) of TV58g on interneurons in the PrSd with the proximal dendrite of a PV+ cell (i, b11 in b), (ii) the dendrite of an unknown interneuron and (iii) soma of another interneuron. (d) Main axon and collateral (arrow, branch point) along with terminals surrounding a neuron in layer 6 of RSg (reverse contrast, confocal microscopic image). The target neuron contains a high level of endogenous biotin (high background), revealed by the streptavidin-conjugated fluorophore signal. (e) The target neuron soma (asterisk) innervated by multiple terminals (cyan) from (d) showed nuclear immunoreactivity for SATB1 (yellow). (f) The dendrite of the target showed positive immunoreactivity for PV (green); arrows highlight two terminals in close apposition. Nb, neurobiotin. (g) Schematic summary of the data presented in Figures 3 and 4 and Tables 1 and 6. Green circles represent the relative proportions of cortical axon terminals from all orchid cells (see Table 1). Immunoreactivity of synaptic target neurons is color-coded based on innervated cortical region. Innervated cortical interneurons may target principal cells (dark gray) on the dendrites, soma or axon initial segment. Bottom right, two idealized theta cycles with representative orchid cell spike bursts at the peak of CA1d theta and EC theta (see Figure 6). Images (z-thickness in µm and z-projection type): (b) 3.63/4.3/4.76, (i/ii/iii), maximum, (d) 22.09 standard deviation, (e) 2.8 maximum, (f) 2.88 maximum. Scale bars: (a) 100 µm, (b,e,f) 10 µm, (c) 0.5 µm (applies to i/ii/iii), (d) 20 µm.

