(Cancer Cell 33, 29–43; January 8, 2018)
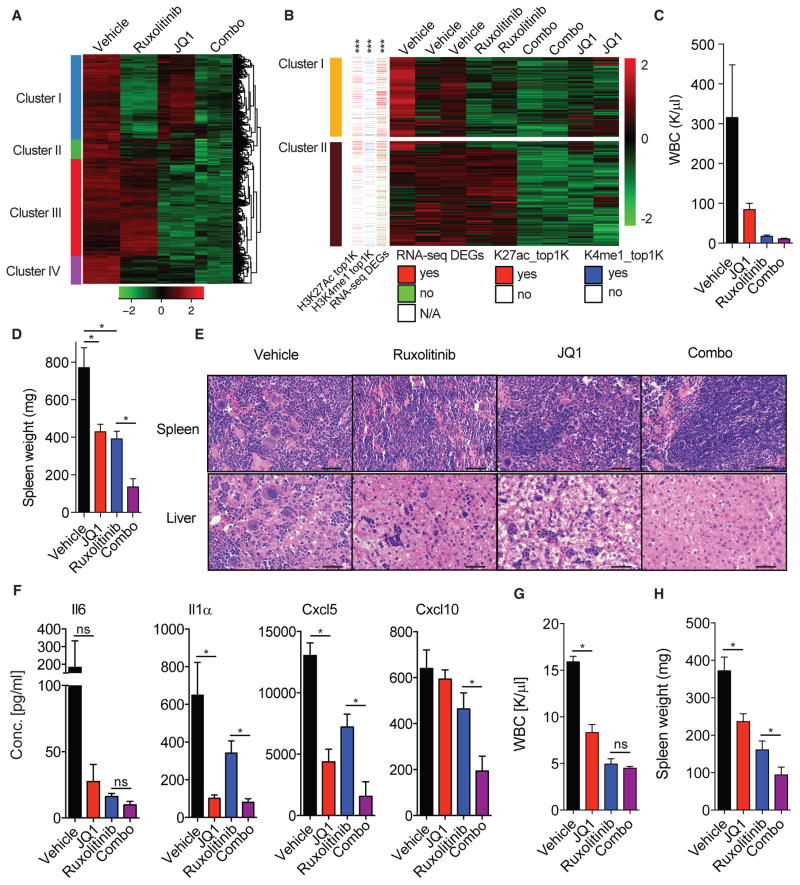
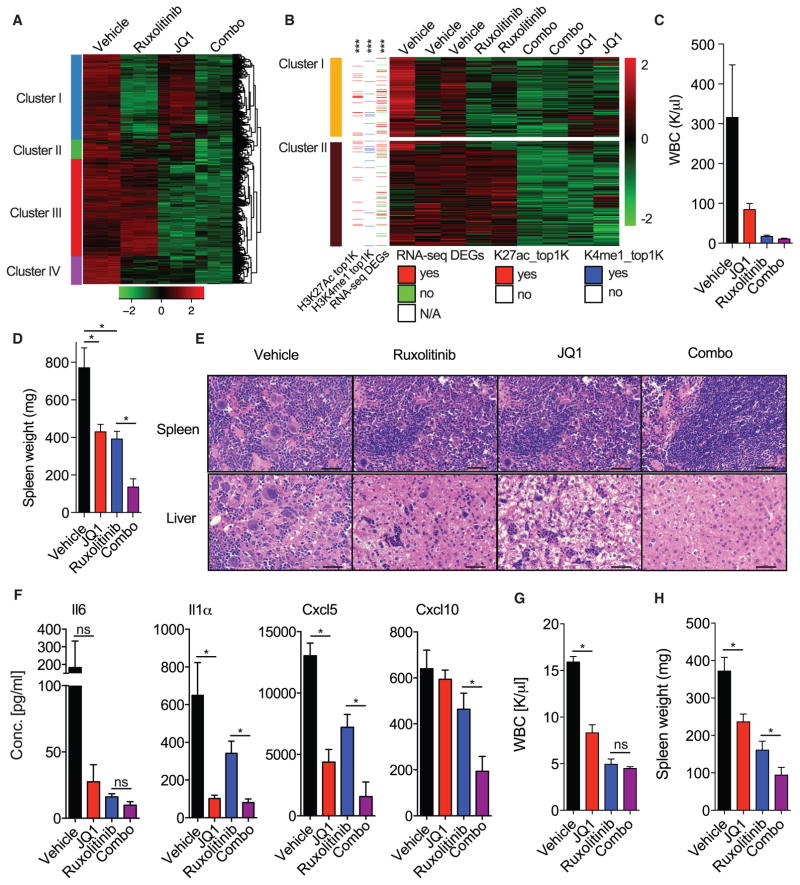
In the originally published version of this paper, the spleen histology images for the ruxolitinib- and JQ1-treated mice were the same image. This happened because, during the first revision of our paper, we inadvertently put the same image in both panels. We have gone back and reviewed pathology from nine mice treated with JQ1 in three different trials, and the images are consistent with what we described. We provide here a revised Figure 5, which includes one of those images in a revised Figure 5E. Please note that we show data from a separate cohort of mice treated with vehicle, JQ1, or ruxolitinib (in Figure S4), which is correct and is consistent with the description of the results. This independent experiment shows similar results from JQ1 monotherapy treatment on spleen histopathology.
We also identified one additional error in the text description of Figure 2A. The original text stated: To elucidate MPLW515L-dependent gene expression changes, we applied DESeq2 to identify differentially expressed genes (DEGs) (adjusted p value < 0.01 and absolute value of log2-fold change > 1), of which 850 genes were upregulated and 499 genes were downregulated in MPLW515L-expressing MEPs compared with empty vector control cells. The corrected version should be as follows: To elucidate MPLW515L-dependent gene expression changes, we applied DESeq2 to identify differentially expressed genes (DEGs) (adjusted p value < 0.01 and absolute value of log2-fold change > 1), of which 499 genes were upregulated and 850 genes were downregulated in MPLW515L-expressing MEPs compared with empty vector control cells. The images shown in Figure 2A and Table S2 are correct.
Both Figure 5 and the legend of Figure 2A have now been corrected in the online version of the paper. The authors apologize for any confusion this may have caused.
Figure 5.
RNA Sequencing Analysis Reveals Inhibitory Effect of JQ1 on TNF/NF-κB Signaling Network (corrected)
Figure 5.
RNA Sequencing Analysis Reveals Inhibitory Effect of JQ1 on TNF/NF-κB Signaling Network (original)


