Supplemental Digital Content is available in the text.
Abstract
Background:
The objective of this study was to demonstrate simple three-dimensional analyses of facial soft tissue shape and asymmetry.
Methods:
There were 2 study samples: one retrospective comprised patients with repaired cleft lip and palate (CL/P) and control subjects; and the other prospective comprised patients with unilateral facial paralysis (FP) and control subjects. The data collected were digitized three-dimensional facial landmarks. Scores for shape and asymmetry of subjects’ faces and for different facial regions were generated using Procrustes methods. Pivotal bootstrap methods and analysis of variance were used to test for significant differences in the scores between the patients and controls, and plots of the scores were generated to compare differences among the subjects.
Results:
(1) Shape scores: The CL/P patients demonstrated significant overall and regional facial differences (P ≤ 0.01). The patients were further from the control mean, especially those with unilateral CL/P. Patients with FP demonstrated significant differences (P ≤ 0.05) for the lower face only. (2) Asymmetry scores: CL/P and FP patients demonstrated significant overall and regional facial differences (CL/P, P ≤ 0.0001; FP, P ≤ 0.01). CL/P and FP patients were more asymmetric and were further from the control mean, and patients with unilateral CL/P were more asymmetric than the bilateral CL/P patients.
Conclusion:
Clinicians can use the analyses to isolate differences and/or changes in the face due to shape or asymmetry, or a combination of both; based on the score plots, the extent of the shape and asymmetry differences can be compared among subjects and the extent of changes due to surgery measured.
INTRODUCTION
Many patients who have craniofacial abnormalities have esthetic and functional problems that arise from shape distortions and asymmetry of the facial soft tissues. Clinicians assess these problems in several ways: (1) subjectively, as part of the clinical examination of the patient; and (2) by means of measures made on 2-dimensional (2D) and 3-dimensional (3D) facial photographs. It is recognized that a clinician’s subjective assessment is a necessary aspect of the diagnostic process; however, studies have demonstrated great variability among clinicians in their subjective assessments of facial soft tissue distortions.1,2 Thus, objective analyses that can supplement clinicians’ subjective assessments of patients are beneficial in isolating areas of distortion and providing more accurate measures of the deformed regions. Most 2D and 3D analyses for the facial soft tissues include multiple measurements that are somewhat difficult to interpret from a global perspective. With the advent of 3D scanning technology, 3D facial surface data can be generated that provide clinicians with the ability to more comprehensively evaluate facial features. For such evaluations, surface analyses have been proposed based on color differentials when surfaces are superimposed for comparison.3–5 Individual colors represent millimeters of differences or changes in facial regions. This approach has been used in research and clinical settings; however, when movements of the soft tissues or bony structures are performed clinically, visualizing differences and changes based on color gradients can be nonintuitive.
Therefore, the objective of this study was to demonstrate simple, targeted, 3D analyses of facial soft tissue shape and asymmetry to supplement clinicians’ subjective diagnosis and aid in the assessment of surgical outcomes. The methods and analyses were demonstrated using 2 patient populations: patients with repaired cleft lip and palate (CL/P) and patients with facial paralysis (FP).
MATERIALS AND METHODS
The study included 2 subject samples: one based on retrospective data (sample 1) and the other based on prospective data (sample 2). Sample 1 comprised 3D facial images of patients with CL/P and control subjects that were collected from a previous study designed to develop a system to assess 3D static and dynamic facial soft tissues (National Institutes of Health Grant DE019742). Supplemental Digital Content 1 gives the subject demographics for sample 1 (http://links.lww.com/PRSGO/A700). There were 6 groups of control subjects divided by gender—male and female—and the following age ranges: 5–6 years (5), 8–10 years (8), and 11–13 years (11). The patients with CL/P (mean age = 11.7 years; SD = ±4.9) were divided into bilateral CL/P (BLP) and unilateral CL/P (ULP). The study, consent, and HIPAA documents were approved by the University of North Carolina Biomedical Human Subjects Institutional Review Board. Sample 2 comprised 3D facial “landmark” images of patients with FP and control subjects taken from a prospective, on-going study (National Institutes of Health Grant DE025295) designed to track recovery of paralysis in facial soft tissues over time. The sample consisted of 10 patients with FP (mean age = 51.8 years; SD = ±11.6; 3 males and 7 females) and 10 control subjects (mean age = 35.9 years; SD = ±10.5; 4 males and 6 females). The patients and controls were the first 10 consecutive participants recruited into the study. The study, consent, and Health Insurance Portability and Accountability Act documents were approved by the Tufts Health Sciences Institutional Review Board. The selection criteria for both study samples were given in Supplemental Digital Contents 2, 3 (see tables, Supplemental Digital Contents 2, 3, which describe the selection criteria for each sample, http://links.lww.com/PRSGO/A701 and http://links.lww.com/PRSGO/A702).
For subjects in sample 1, a standardized set of 3D static facial images/photographs was recorded using a 3dMD Face System (3dMD, Atlanta, GA; see figure, Supplemental Digital Content 4, which shows the 3dMD Face System, http://links.lww.com/PRSGO/A703). The system had 4 digital cameras that were used for the geometry reconstruction and 2 color digital cameras for texture overlay, and employed a combination of white light for the texture cameras and a random pattern projector for the geometry cameras. The field of view was 220 × 300 mm with a stated accuracy rating of 500 μm, and the system captured both 3D surface data (x, y, and z coordinates) and high-resolution (≈2 megapixels) 2D image texture data (color overlay). For data capture, each subject was seated comfortably in front of the camera with the camera focused on the subject’s face. 3D facial images then were captured “at rest” and at the maximum position of several animations (eg, smile, lip purse, cheek puff). The images then were exported and stored for further analyses. For this study, only the at rest images were used. Subsequently, 35 nasolabial landmarks (Fig. 1) were digitized on the 3D at rest facial images of 184 control subjects and 42 patients with repaired CL/P.
Fig. 1.
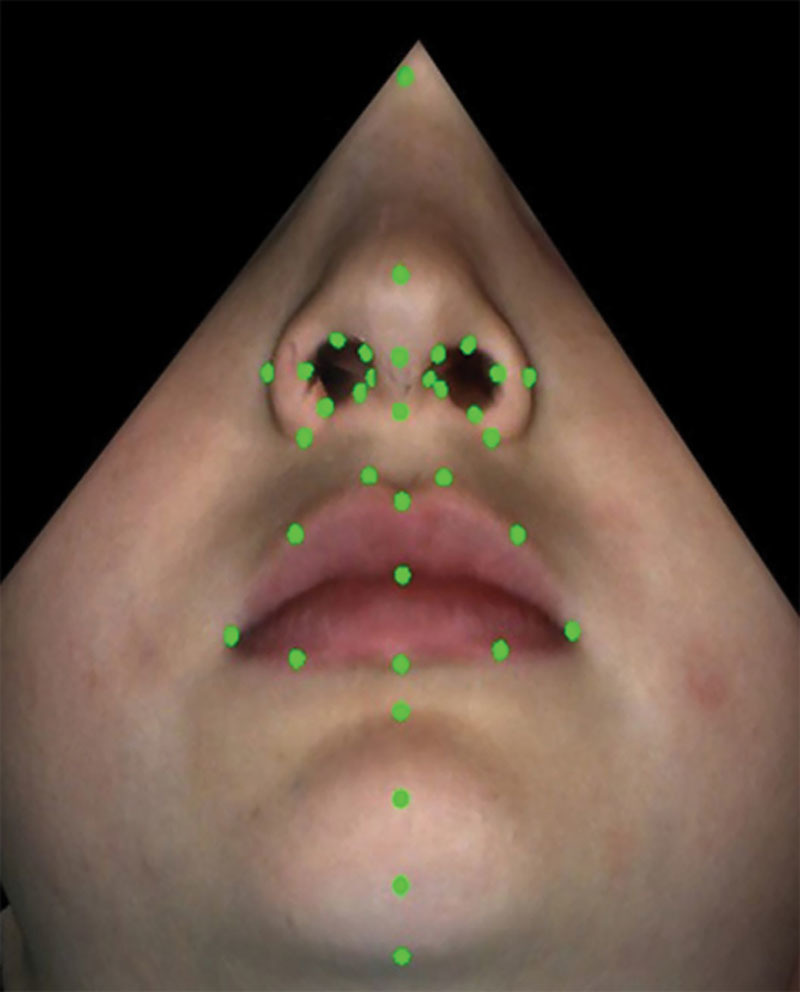
Digitized landmarks on the 3D facial images of patients with CL/P.
For the subjects in sample 2, sixty-four 3-mm, hemispherical, retroreflective markers were placed on specific facial landmarks (Fig. 2, FP landmark positions). Then, each subjects’ face was captured during different facial animations/movements at 60 frames per second using a motion capture system according to the methods by Trotman et al.,6 and the 3D dynamic, surface data (x, y, and z coordinates) were exported for later analyses (see figure, Supplemental Digital Content 5, which shows the Motion Analysis System, http://links.lww.com/PRSGO/A704). For this study, only the subjects’ at rest image in a single frame of data (before the movement was performed) was used.
Fig. 2.
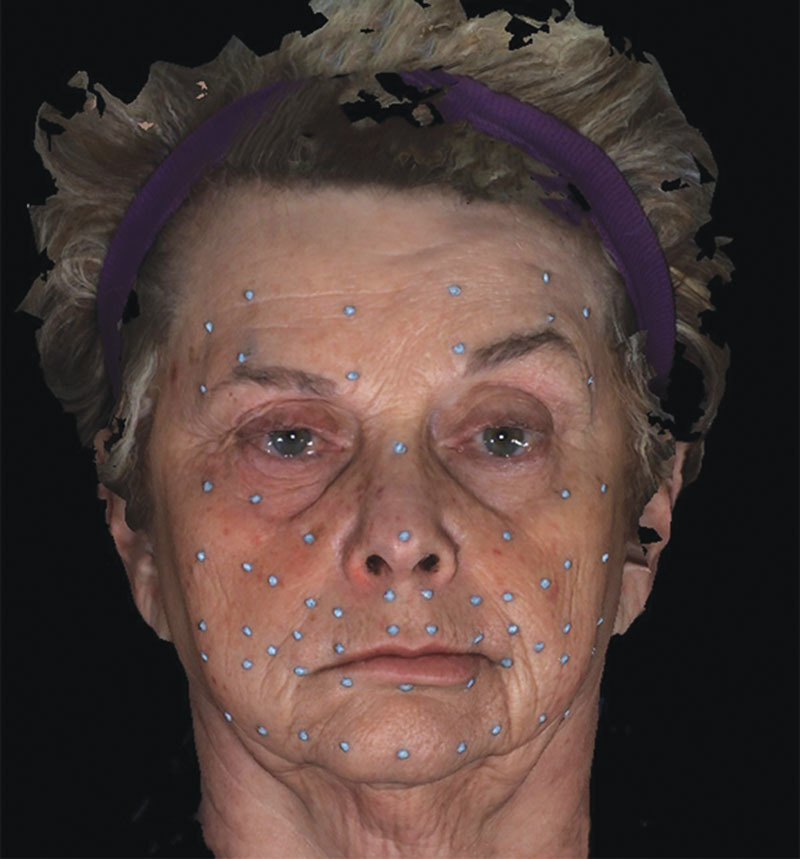
Three-millimeter, hemispherical, retroreflective landmarks secured to specific sites on the faces of patients with FP.
Shape Analysis
Figure 3 shows the overall landmark distributions on the faces of all the subjects in samples 1 and 2, respectively. To determine the facial shape differences between the patients with CL/P and their controls and the patients with FP and their controls, the overall shape mean based on the landmarks was computed separately for the controls in each sample, that is, the shape mean for sample 1 based on 35 landmarks and the shape mean for sample 2 based on 64 landmarks. Within each sample, the distance from the control mean was computed for every subject (both the patients and controls) using ordinary Procrustes analysis.7 Then, the square root of the normalized Procrustes distance was used as a measure of how far each subject (patient and control) was from their respective control mean. Plots then were made of the distribution of these distances termed “shape scores” for the subjects in each sample. Statistical tests were conducted to determine the differences in shape between patients with CL/P and their control group, and between patients with FP and their control group.
Fig. 3.
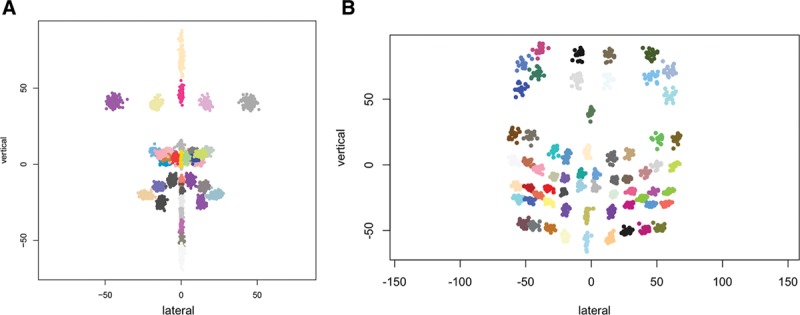
Landmark distributions. A, Frontal view of facial landmark distributions over all subjects (patients with CL/P and controls) in sample 1. B, Frontal view of facial landmark distributions over all subjects (patients with FP and controls) in sample 2.
A comparison of samples of shapes requires special statistical methods that are invariant to rotation, translation, and scaling because these operations do not alter a shape. For this comparison, pivotal bootstrap methods7 were used. Specifically, the test statistic was pivotal because its distribution does not depend on unknowns. Bootstrap resampling was required because an accurate reference distribution for finite samples was hard to obtain. The test was implemented in the shapes package of R (statistical software) R Foundation, Vienna, Austria.
Asymmetry Analysis
To determine differences in facial asymmetry, the subjects’ faces (patients and controls) in samples 1 and 2 (together with their facial landmarks) were reflected left to right. On each reflected face, the left landmarks were relabeled as right and the right landmarks were relabeled as left. Then, Procrustes superimposition7 was used to match the reflected and original faces as closely as possible, and the distances between the “matched” landmarks in the reflected and original faces of each subject were computed. If the left–right pairs of landmarks were perfectly symmetric, then their scores would be zero, while the midline landmarks would be singletons. The average asymmetry over (1) the right–left pair landmarks and (2) the midline singleton landmarks then was calculated to represent “asymmetry” scores for the left–right pairs and the midline singletons, respectively. Each sample was analyzed separately. Subsequently, analysis of variance (ANOVA) was used to test for significant differences in the asymmetry scores between the patients with CL/P and their control group in sample 1, and between the patients with FP and their control group in sample 2.
RESULTS
Sample 1: CL/P Shape Differences
The pivotal bootstrap methods8 for the patients with CL/P demonstrated significant differences (P ≤ 0.01) in the shape scores between the patients and the controls for the overall face, the nose, the upper lip, and the lower lip, and differences in gender (Table 1). The patients were further away from the control mean. The results also demonstrated strongly significant (P ≤ 0.0001) differences in the shape scores between the patients with ULP and BLP: patients with ULP were further away from the control mean. There were no significant differences in shape among the control groups. Figures 4–6 show plots of the shape scores for the whole face, nose, and upper lip regions for the patients with CL/P and their respective controls. Supplemental Digital Content 6 shows plots of the shape scores for the lower lip region for the patients with CL/P and their respective controls (http://links.lww.com/PRSGO/A705).
Table 1.
Results for Significant Differences in Shape Scores for the Overall Face, Nose, Upper Lip, and Lower Lip Regions between the BC/L Patients Versus the Control Subjects, UC/L Patients Versus the Control Subjects, and Males Versus Females

Fig. 4.
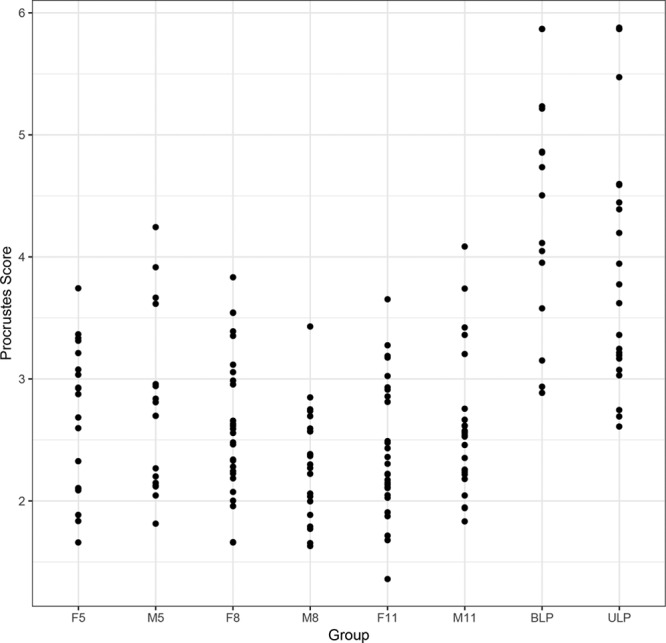
Plots of the shape scores for the whole face in patients with CL/P and controls. F5 indicates control females 5–7 years of age; F8, control females 8–10 years of age; F11, control females 11–14 years of age; M5, control males 5–7 years of age; M8, control males 8–10 years of age; M11, control males 11–14 years of age.
Fig. 6.
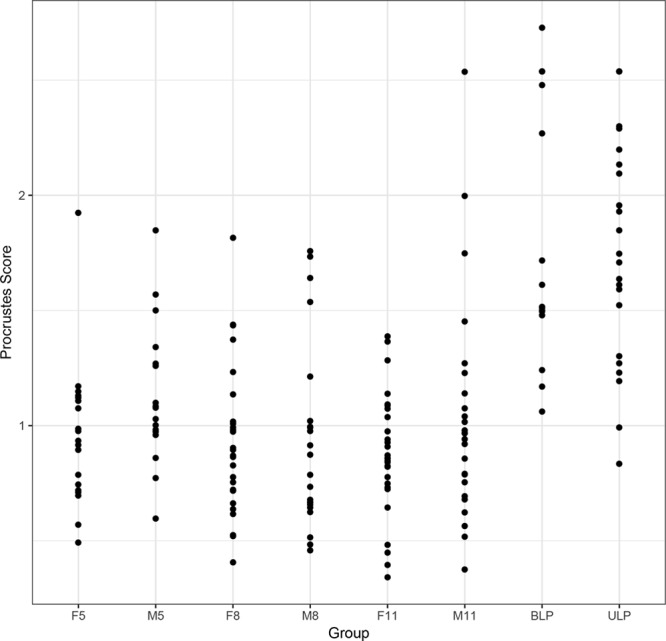
Plots of the shape scores for the upper lip in patients with CL/P and controls. F5 indicates control females 5–7 years of age; F8, control females 8–10 years of age; F11, control females 11–14 years of age; M5, control males 5–7 years of age; M8, control males 8–10 years of age; M11, control males 11–14 years of age.
Fig. 5.
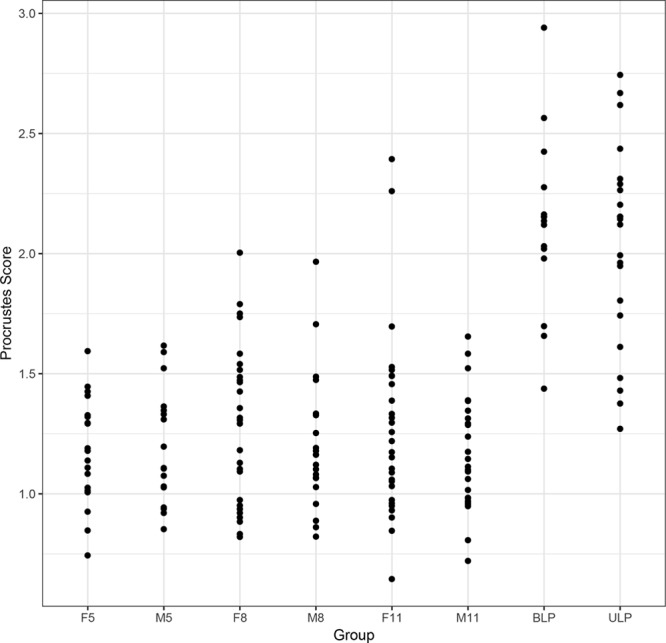
Plots of the shape scores for the nose in patients with CL/P and controls. F5 indicates control females 5–7 years of age; F8, control females 8–10 years of age; F11, control females 11–14 years of age; M5, control males 5–7 years of age; M8, control males 8–10 years of age; M11, control males 11–14 years of age.
Sample 2: FP Shape Differences
The results of the pivotal bootstrap methods8 for the patients with FP (Table 2) demonstrated no significant differences in the shape scores between the patients and controls for the full face, the upper face, and the middle face; however, the lower face demonstrated significant differences (P ≤ 0.05).
Table 2.
Results for Significant Differences in Shape Scores for the Full Face, Upper Face, Middle Face, and Lower Face Between the Patients With FP and the Control Subjects

Sample 1: CL/P Asymmetry Differences
The results of the ANOVA demonstrated strongly significant differences (P ≤ 0.0001) in asymmetry between the patients with CL/P and the controls for the overall face, the nose, the upper lip, and the lower lip regions. For the paired landmarks, the patients with both ULP and BLP were more asymmetric and were further from the control mean shape; however, the patients with ULP were more asymmetric than those with BLP. For the midline landmarks, the patients with ULP were more asymmetric than the controls. There were no significant differences in asymmetry among the control groups. Figure 7 shows the plot for the overall facial asymmetry scores of the paired landmarks for the patients with CL/P and controls. Supplemental Digital Content 7 shows the plot for the overall facial asymmetry scores of the midline landmarks for the patients and the control (http://links.lww.com/PRSGO/A706).
Fig. 7.
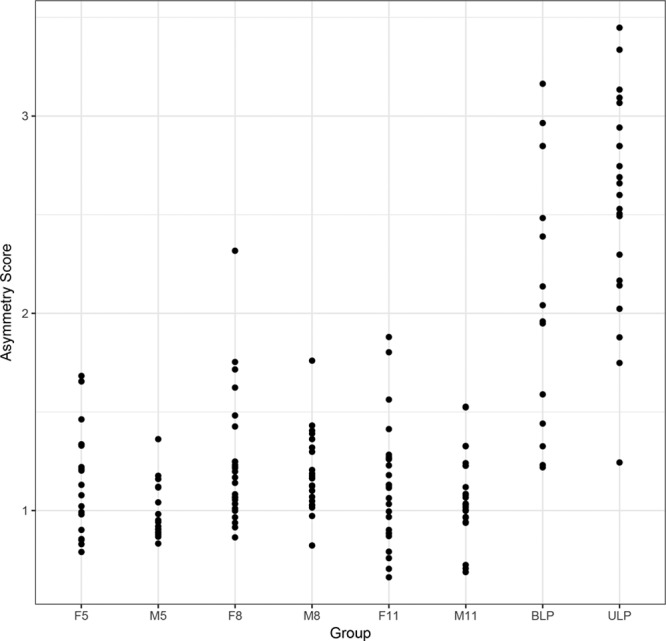
Plots of the overall facial paired asymmetry scores for the patients with CL/P and controls. F5 indicates control females 5–7 years of age; F8, control females 8–10 years of age; F11, control females 11–14 years of age; M5, control males 5–7 years of age; M8, control males 8–10 years of age; M11, control males 11–14 years of age.
Sample 2: FP Asymmetry Differences
The results of the ANOVA demonstrated significant differences (P ≤ 0.01) in asymmetry between the patients with FP and the controls for the overall face, the upper face, the middle face, and the lower face for the paired landmarks only. Figure 8 shows the plot of the paired asymmetry landmarks for the subjects in sample 2. Supplemental Digital Content 8 shows the plot of the midline asymmetry landmarks for the subjects in sample 2 (http://links.lww.com/PRSGO/A707).
Fig. 8.
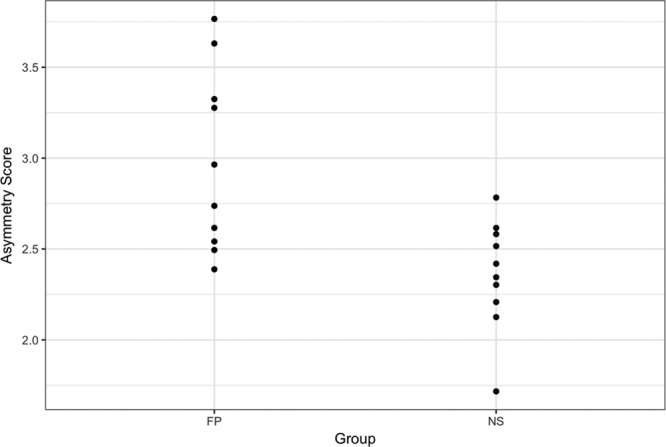
Plot of asymmetry scores for the paired landmarks of the subjects in sample 2. NS indicates normal “control” subjects.
DISCUSSION
The patient samples in this study—patients with CL/P and FP—were used to demonstrate the utility of the analyses. These analyses had 2 main advantages. The first was that the clinician had the ability to isolate differences and/or changes in the face that may be due to shape or asymmetry, and when present, a combination of both shape and asymmetry. The unilateral FP patients have one half of the face, either the right or the left, different from the other half—indicating an asymmetry—but other than the mouth corners and chin regions of the lower face, each half of the face had minimal shape differences when compared with the controls. This finding is demonstrated in Figure 9A where the patient is first shown with unilateral FP. Then, each half of the patient’s face (paralyzed and nonparalyzed halves) was separated, duplicated, and mirror imaged to produce 2 full faces—one face based on the paralyzed half and the other based on the nonparalyzed half (Figs. 9B, C). For this patient, the generated faces were more or less normal in shape albeit the paralyzed full face was somewhat narrower than the nonparalyzed probably because of the loss of muscle tone that accompanied the facial palsy and a downturn of the mouth corners (Figs. 9B, C). In addition, close examination of both the paralyzed and nonparalyzed faces demonstrated that the differences extended to the neck region and the platysma muscles which can be affected by the paralysis.
Fig. 9.

Facial simulations. A, Face of a patient with right unilateral facial paralysis. B, Simulated face of the same patient with the paralyzed, right side of the face duplicated and mirror imaged to produce a full face. C, Simulated face of the same patient with the nonparalyzed, left side of the face duplicated and mirror imaged to produce a full face.
A second advantage of the analyses was the ability to generate separate plots for the shape and asymmetry scores. This feature was particularly relevant for the patients with repaired CL/P, most of whom had both shape and asymmetry differences when compared with the controls. As stated previously, the distinction between these 2 elements—shape and asymmetry—was important and should be factored into any static analysis of the face. The plots provided a direct comparison of the extent of the shape and asymmetry problems across the patients and control subjects. For example, consider the patients with CL/P indicated by the arrows in the shape and paired asymmetry plots of Figures 10, 11, respectively—patient 1 (Fig. 12A, solid arrow) and patient 2 (Fig. 12B, broken arrow)—have a repaired BLP. As shown in the plot, patient 1 (Fig. 12A) had both shape (score = 5.24) and asymmetry (score = 3.17) scores for the nasolabial region that were far outside the upper end of the range for the control subjects—the control range of the shape scores was 1.36–4.24, whereas that for asymmetry was 0.66–2.32. Patient 2 (Fig. 12B) had a shape score of 4.12 for the nasolabial region that also was at the upper limit of the control range (scores = 1.36–4.24); however, the asymmetry score for the nasolabial region of 1.44 was well within that of the control values (scores = 0.66–2.32). From a surgical perspective, given the extent of the disability of the nasolabial region of patient 1, specific surgical maneuvers designed to thoroughly address the nasolabial region would need to be incorporated. In this regard, clinicians may employ the plots to track the extent of any improvement following surgery.
Fig. 10.
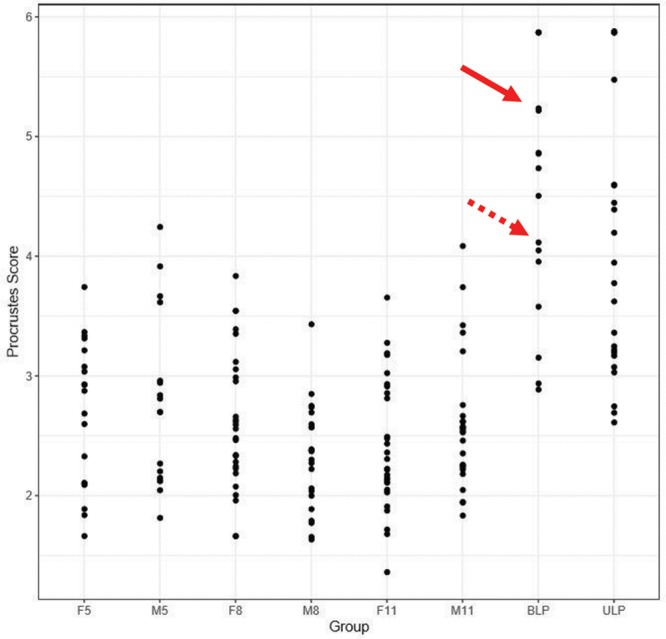
Plots of the shape scores (1) for the whole face of patients with CL/P and controls. The solid arrows indicate the position of patient 1 in Figure 12, and the broken arrows indicate the position of patient 2 in Figure 12. F5 indicates control females 5–7 years of age; F8, control females 8–10 years of age; F11, control females 11–14 years of age; M5, control males 5–7 years of age; M8, control males 8–10 years of age; M11, control males 11–14 years of age.
Fig. 11.
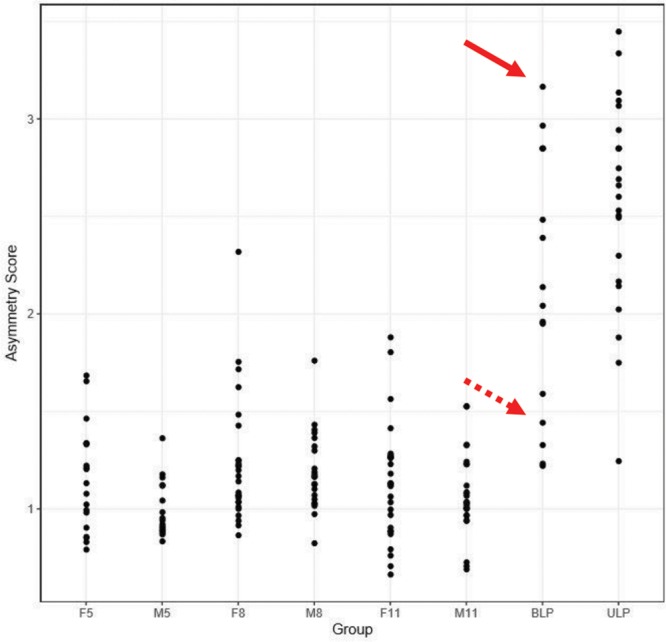
Plots of the “paired” asymmetry scores (2) for the whole face of patients with CL/P and controls. The solid arrows indicate the position of patient 1 in Figure 12, and the broken arrows indicate the position of patient 2 in Figure 12. F5 indicates control females 5–7 years of age; F8, control females 8–10 years of age; F11, control females 11–14 years of age; M5, control males 5–7 years of age; M8, control males 8–10 years of age; M11, control males 11–14 years of age.
Fig. 12.
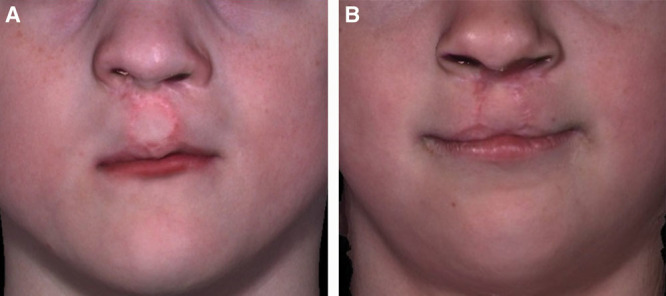
Patients 1 & 2 with repaired bilateral cleft lip and palate. A, Position of patient 1 in Figures 10, 11 is indicated by solid arrows. B, Position of patient 2 in Figures 10, 11 is indicated by broken arrows.
The sensitivity of the analyses described herein can be increased by performing separate analyses for different facial regions or zones depending on the deformity being studied. For patients with FP, given the contemporary focus on zonal facial assessment and reconstruction, the analytical tools presented in this study would be of significant value. Thus, it would be more appropriate to analyze the asymmetry and shape of the face within the upper (trichion to glabella), middle (glabella to subnasale), and lower (subnasale to menton) facial regions that are innervated by the extracranial branches of the facial nerve. In general, the temporal branch of the facial nerve animates the upper facial region that includes the forehead and brow; the zygomatic and buccal branches animate the middle facial region—the zygomatic branch animates the eyelids and nasolabial folds, and the buccal branch animates the cheek, upper lip, and mouth corners (elevates); the marginal mandibular branch animates the chin, lower lip, and mouth corners (depresses); and the cervical branch animates the neck region (platysma muscle). Other workers9 have demonstrated that observers tend to focus attention on an area of the face bounded by the eyes, nose, and mouth termed the “central triangle” (CT). Moreover, within the CT observers focus on the mouth region of patients with unilateral FP9 while for patients with CL/P, the CT encompasses the very regions that are affected by the cleft deformity—the nose, the upper lip, and the lower lip which may show a disfiguring eversion. The analyses we have developed can be perfectly localized to the region of the CT.
One caveat is that the analysis of the face by regions requires identification of numerous data points as demonstrated in Figure 13 in which the patient with right, unilateral, FP has clear differences in asymmetry by region. The open circles are the mean of the static face for the control subjects, and the solid circles are the patient’s mean static face. The patient’s mean is superimposed on the control mean. The greater asymmetry on the right side of the face and the regional differences are evident. Also, it is interesting that there are differences between the patient and control mean evident on the left, nonparalyzed side of the face. This patient had one of the highest asymmetry scores as shown in the plot in Figure 14. We hypothesize that the differences evident on the nonparalyzed side of the face are most likely indicative of compensatory muscle behavior on the nonparalyzed side secondary to the paralysis.
Fig. 13.
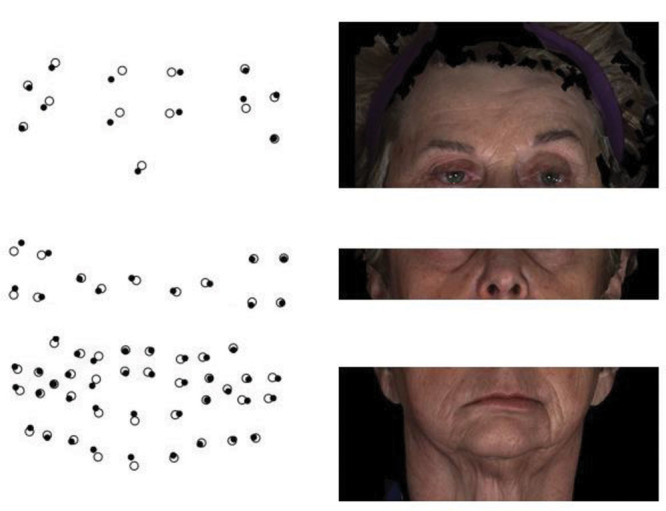
A patient with right, unilateral, facial paralysis who shows regional differences in facial asymmetry. The open circles are the mean of the static face for the control subjects, and the solid circles are the patient’s mean static face. The patient’s mean is superimposed on the control mean.
Fig. 14.
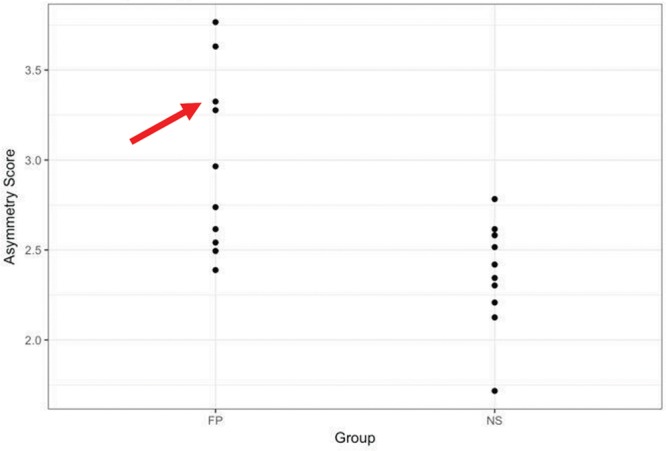
A plot of asymmetry scores for the paired landmarks of the subjects in sample 2. Patient in the Figures 2, 9, 13 is indicated by the red arrow. NS indicates normal control subjects.
Finally, the analyses presented, as demonstrated using the 2 subject samples, can be used with different approaches for 3D data capture. We used 2 different landmark-based approaches for data capture. The patients with CL/P had their images captured first and then the landmarks were identified on the images by one investigator. The patients with FP first had their landmarks identified and fixed to the face and then the facial images were captured. Other workers have advocated the use of surface-based as opposed to landmark-based approaches. Codari et al.10 assessed asymmetry by comparing facial surfaces of different halves of facial regions—upper, middle, and lower regions—in patients with FP. They demonstrated a high level of agreement and minimal systematic errors with repeated landmark identification and measurements. Alqattan et al.5 demonstrated that both the landmark- and surface-based approaches can be used to accurately quantify facial asymmetry but that the surface-based approach offered a more comprehensive analysis. The latter was to be expected because it was based on greater data. Importantly, however, the analyses we have presented here can be used with both landmark- and surface-based approaches.
Supplementary Material
Footnotes
Presented at the International/American/Canadian Association for Dental Research (IADR/AADR/CADR), March 22–25, 2017, San Francisco, CA.
This study was funded by National Institute of Dental and Craniofacial Research Grants # DE025295, DE019742, and DE024503.
Disclosure: The authors have no financial interest to declare in relation to the content of this article. The Article Processing Charge was paid for by Tufts University School of Dental Medicine.
Supplemental digital content is available for this article. Clickable URL citations appear in the text.
REFERENCES
- 1.Taylor HO, Morrison CS, Linden O, et al. Quantitative facial asymmetry: using three-dimensional photogrammetry to measure baseline facial surface symmetry. J Craniofac Surg. 2014;25:124–128.. [DOI] [PubMed] [Google Scholar]
- 2.Trotman CA, Phillips C, Essick GK, et al. Functional outcomes of cleft lip surgery. Part I: study design and surgeon ratings of lip disability and need for lip revision. Cleft Palate Craniofac J. 2007;44:598–606.. [DOI] [PMC free article] [PubMed] [Google Scholar]
- 3.Djordjevic J, Lewis BM, Donaghy CE, et al. Facial shape and asymmetry in 5-year-old children with repaired unilateral cleft lip and/or palate: an exploratory study using laser scanning. Eur J Orthod. 2014;36:497–505.. [DOI] [PubMed] [Google Scholar]
- 4.Ostwald J, Berssenbrügge P, Dirksen D, et al. Measured symmetry of facial 3D shape and perceived facial symmetry and attractiveness before and after orthognathic surgery. J Craniomaxillofac Surg. 2015;43:521–527.. [DOI] [PubMed] [Google Scholar]
- 5.Alqattan M, Djordjevic J, Zhurov AI, et al. Comparison between landmark and surface-based three-dimensional analyses of facial asymmetry in adults. Eur J Orthod. 2015;37:1–12.. [DOI] [PubMed] [Google Scholar]
- 6.Trotman CA, Faraway JJ, Phillips C, et al. Effects of lip revision surgery in cleft lip/palate patients. J Dent Res. 2010;89:728–732.. [DOI] [PMC free article] [PubMed] [Google Scholar]
- 7.Dryden IL, Mardia KV. Statistical Shape Analysis. 1998Chichester, United Kingdom: Wiley. [Google Scholar]
- 8.Amaral GJA, Dryden IL, Wood ATA. Pivotal bootstrap methods for k-sample problems in directional statistics and shape analysis. J Am Stat Assoc. 2007;102:695–707.. [Google Scholar]
- 9.Ishii L, Dey J, Boahene KD, et al. The social distraction of facial paralysis: objective measurement of social attention using eye-tracking. Laryngoscope. 2016;126:334–339.. [DOI] [PubMed] [Google Scholar]
- 10.Codari M, Pucciarelli V, Stangoni F, et al. Facial thirds-based evaluation of facial asymmetry using stereophotogrammetric devices: application to facial palsy subjects. J Craniomaxillofac Surg. 2017;45:76–81.. [DOI] [PubMed] [Google Scholar]


