Abstract
Synthesizing a genetic network which generates stable Turing patterns is one of the great challenges of synthetic biology, but a significant obstacle is the disconnect between the mathematical theory and the biological reality. Current mathematical understanding of patterning is typically restricted to systems of two or three chemical species, for which equations are tractable. However, when models seek to combine descriptions of intercellular signal diffusion and intracellular biochemistry, plausible genetic networks can consist of dozens of interacting species. In this paper, we suggest a method for reducing large biochemical systems that relies on removing the non-diffusible species, leaving only the diffusibles in the model. Such model reduction enables analysis to be conducted on a smaller number of differential equations. We provide conditions to guarantee that the full system forms patterns if the reduced system does, and vice versa. We confirm our technique with three examples: the Brusselator, an example proposed by Turing, and a biochemically plausible patterning system consisting of 17 species. These examples show that our method significantly simplifies the study of pattern formation in large systems where several species can be considered immobile.
Keywords: Turing patterns, model reduction, synthetic gene circuits, reaction–diffusion
1. Introduction
How cells coordinate with one another to form regular patterns of alternate differentiated states is a foundational question in developmental biology [1]. Establishing general rules that biochemistry can follow to enable pattern formation could impact on our ability to understand and cure developmental disorders [2], construct synthetic organs/organoids [3] or enable synthetic biology applications to use multicellular self-organization [4–6]. While there are several mechanisms that are known to enable multicellular self-organization of regular patterns, such as the french flag model [7], we focus here on diffusion-driven instability (DDI) first described by Alan Turing [8]. He proposed that two ‘morphogens’ (intercellular signalling molecules) could enable tissues to produce regular patterns, and introduced a framework based on the reaction–diffusion equations that can establish when a given chemical system has pattern-forming potential. Later, Gierer & Meinhardt proposed that self-organization requires a self-enhancing activator, which also upregulates an inhibitor, forming a negative feedback, and further that the activator must diffuse more slowly than the inhibitor [9]. While an activator–inhibitor system is the simplest pattern-forming network, requiring only two chemical species but with differential diffusion, the introduction of a third (non-diffusing) species has been found to enable pattern formation when the morphogens have equal diffusion rates [10,11].
Despite the theory of Turing patterns having existed since the 1950s, only much more recently has compelling evidence emerged that suggests that Turing patterns are responsible for pattern formation in natural biological systems, including digit patterning [12,13] and fish skin colouring [14]. In most cases, it has been challenging to relate known biology involving many interacting species to simple 2- and 3-species networks for which analysis of DDI is more straightforward [13,15]. As such, it remains the subject of debate as to whether the examples of biological pattern formation cited above actually depend on DDI, or might arise due to other reasons. To help understand the biochemical mechanisms that can result in biological pattern formation, several articles have proposed constructing synthetic biochemical networks that are engineered to specifically implement pattern-forming behaviours, some based on Turing instability [16–19] but also other mechanisms [20–24]. Libraries of biological parts/components have now been compiled that have been demonstrated to be functional in specific cellular systems that are frequently used in synthetic biology applications (e.g. Escherichia coli and Saccharomyces cerevisiae). Knowledge of the functioning of these components could then be used to demonstrate how manipulating kinetic parameters influence the conditions for DDI, and alter pattern wavelength, in predictable ways. Establishing a close relationship between theory and experiment would then provide further evidence that Turing's mechanism can drive biological pattern formation. However, examples of synthetic biological circuits that can produce Turing patterns have yet to emerge, further raising the question of whether the Turing mechanism alone is sufficient to robustly generate regular patterns in a biological system.
Analysis of DDI for two species is now well-established [25], but quickly becomes more complicated with the introduction of additional (often non-diffusing) species [10]. While more theory and automated mathematical tools are now emerging that facilitate the analysis of DDI in general n-dimensional systems [11,26], it still remains a challenge when the underlying system is nonlinear, as is typically the case in biological systems. Therefore, it is not uncommon to start with a more detailed mathematical description of a chemical system, then attempt to reduce it to a simpler form while retaining the majority of the behaviour of the detailed model [16]. However, little analysis has emerged that establishes whether the conditions of DDI are preserved during a model reduction, despite it being observed that model reduction can change the required diffusion ratio for pattern formation [10]. One paper has shown that reaction–diffusion systems with a particular simple form can be reduced without impacting on the dynamics (and consequently the pattern-forming capabilities), but the result is not generalizable beyond a small subset of systems [27].
Many techniques have been established that reduce the size of ordinary differential equation (ODE) models, offering a starting point for interpreting the impact of model reduction on Turing pattern formation. Each technique is based on maximizing the fidelity between detailed and reduced models with respect to a specific property (see [28,29] for reviews of model reduction techniques). Some methods guarantee that equilibrium solutions (and their stability properties) are retained through a reduction, while others attempt to minimize the deviation of the transient behaviour of a specified model variable or variables, in response to a stimulus. Furthermore, some methods preserve the model co-ordinates/variables, while others do not. In biochemical systems, timescale separation techniques are often used, of which the most common are the quasi-steady-state approximation (QSSA) and the quasi-equilibrium (QE) assumption [28]. Both involve removing species that are fast, substituting the concentration of these species for functions of the dynamic species that are derived from equilibrium relationships arising from the full system.
In this paper, we investigate the question of whether model reduction can be applied to a chemical reaction network (CRN) in a manner that preserves Turing pattern-forming behaviour. In §2, we prove that if a reduced model forms patterns, then so does the corresponding full system (and vice versa), given that some easily checkable conditions are fulfilled. In §3, we confirm our results on three separate CRNs, including the Brusselator, and a synthetic gene network with 17 species. These examples show that the method developed in this paper allows for quick and easy Turing pattern analysis of complex chemical systems with an arbitrarily large number of non-diffusible species.
2. Theory
2.1. Background description of Turing instability
The majority of theoretical work on Turing patterns builds upon the classical reaction–diffusion equations for a chemical system undergoing diffusion. In the absence of convection/advection, the reaction–diffusion equations are given by
| 2.1 |
where  is in general a nonlinear system for the rate equations of a CRN involving N species (X1, …, XN), and D is a diagonal matrix containing the diffusion rates of each species. The ∇ operator describes the spatial derivatives in
  , where d is the number of spatial dimensions. In one dimension, this simply corresponds to ∂2c/∂x2.
A Turing pattern arises when an equilibrium of the spatially homogeneous system ( such that
  ) goes unstable in the presence of diffusion. In our definition of a Turing pattern, this equilibrium is also assumed to be stable in the absence of diffusion. To analyse stability, we consider standard linear analysis of the system about the equilibrium
  . If
. If  when
when  , then (2.1) becomes
| 2.2 |
where J is the matrix of the first-order partial derivatives of f with respect to each species j
| 2.3 |
evaluated at  .
.
To assess stability in the presence of diffusion, we consider how perturbations evolve over time. If wk(x) are the eigenmodes of the Laplacian operator ∇2, i.e. ∇2wk = ηkwk, then it has been shown that ηk ≤ 0 (with zero flux boundary conditions) [30]. Therefore, it is customary to let ηk =− k2, with k corresponding to the wavenumber of the eigenmode. As such, in one dimension, on a domain x ∈ [0, L], there are solutions of the form
| 2.4 |
Accordingly, the original linearization problem (2.2) translates into
| 2.5 |
Therefore, we are interested in the eigenvalues of J − k2D. If we denote by σJ−k2D the spectrum of J − k2D, then this gives rise to a dispersion relation
| 2.6 |
For Turing instability, we require that the system is stable in the absence of diffusion, which translates to eigenvalues at k = 0 all having negative real part. Additionally, we require the existence of at least one unstable wavenumber, i.e. there exists a wavenumber k* such that there is a corresponding eigenvalue λ* with positive real part.
2.2. Model reduction
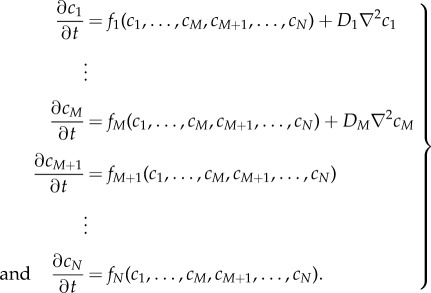
We now consider a system of N species in which the first M species can diffuse with diffusion coefficients D1, …, DM, while the remaining species cannot. Accordingly, we describe a spatially inhomogeneous reaction–diffusion system as
 |
2.7 |
The associated spatially homogeneous system can therefore be written compactly as
| 2.8 |
Because we look for Turing patterns we further assume that there exists a non-negative spatially homogeneous equilibrium of (2.1) given by  , which satisfies
| 2.9 |
We now outline a strategy to reduce system (2.8) to a smaller system of NR species, with M ≤ NR < N, including all diffusible species. Without loss of generality, we assume that the reduced model consists of species X1,…, XNR. The reduction is obtained by defining the functions  , which satisfy
| 2.10 |
Intuitively, this amounts to solving the steady-state ODEs for the removed species, as functions of the remaining species, thereby eliminating N − NR species from the system. Note that  . The reduced system of ODEs becomes
 |
2.11 |
Using the chain rule, the Jacobian of the reduced system (2.11) is the NR × NR diagonal matrix given by
 |
2.12 |
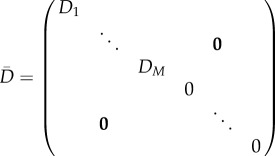
evaluated at  . Accordingly, the diffusion matrix of the reduced system (2.11) is the NR × NR diagonal matrix given by
 |
2.13 |
where the first M diagonal entries are the diffusion rates of the diffusible species, and the additional NR − M entries correspond to non-diffusible species that were not removed during the model reduction.
We now have two systems, (2.8) and (2.11), which are models of the same underlying process. To consider how Turing pattern formation is affected by the reduction from (2.8) to (2.11), we return to the mathematical conditions of pattern-forming behaviour introduced above.
We say a system is pattern-forming if there exist k1, k2, k3, k4 > 0 with k1 ≤ k2 < k3 ≤ k4 such that all eigenvalues of J − k2D have negative real parts when k < k1 and k > k4, and there is a positive real eigenvalue when k2 < k < k3. This is a strict definition that explicitly excludes certain systems that are capable of forming patterns: (i) systems with patterns formed by Turing–Hopf bifurcations, (ii) systems that are unstable without diffusion, and (iii) systems that can form patterns on arbitrarily small length-scales (‘noise-amplifying networks’ [11]). Systems of type (i) are excluded because they can form either spatial patterns or temporal oscillations depending on the initial conditions, and so are not consistently pattern-forming; systems of type (ii) are excluded because they violate the concept of DDI; systems of type (iii) are excluded because they violate physical principles by permitting, for example, patterns on length-scales smaller than a molecule [10].
Knowing that we are interested in the behaviour of the matrix J − k2D, and its reduced counterpart  , we note the following relationship between the full and reduced systems.
Lemma 2.1. —
|J − k2D| and
change sign at the same values of k.
Proof. —
We define
2.14 so that
2.15 and we define
2.16 so that
2.17 We now compare |J − k2D| and
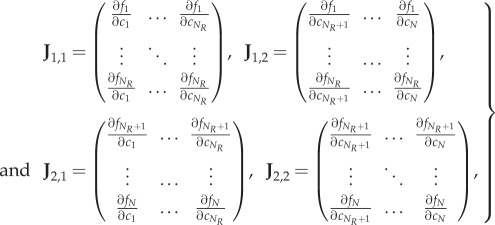
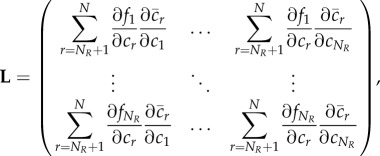
. In the former case, the Schur complement of J2,2 provides the relationship
2.18 while in the latter case
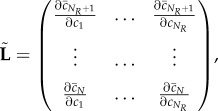
2.19 The two determinants are directly proportional if L = −J1,2 J−12,2 J2,1. We observe that we can write
, where
2.20 so that the condition for proportional determinants becomes that
, or algebraically, that
2.21 We note from equation (2.10) that,

is a constant function of c1, …, cNR, i.e.
2.22 Expanding this gives precisely the condition (2.21). It follows that the determinants of the full and reduced systems are directly proportional, and consequently change sign at exactly the same values of k. □
We next turn our attention to the conditions of Turing pattern formation, specifically considering when eigenvalues can cross the imaginary axis. We can make the following statement.
Lemma 2.2. —
A system is pattern-forming if it has the following properties:
(I) the system is linearly stable without diffusion (i.e.
),
(II) the non-diffusible subsystem is either linearly stable without diffusion (i.e.
), or else non-existent (i.e. M = N),
(III) |J − k2D| changes sign at least twice as a function of k, and we denote smallest two such values of k as k2 and k3, with 0 < k2 < k3.
Proof. —
By (I), the real parts of eigenvalues of J − k2D are negative when k = 0, and by continuity, also negative up to some k1 > 0 with k1 ≤ k2. When k is very large, the characteristic polynomial of the system will have the form (λ + k2D1)(λ + k2D2) ⋯ s(λ + k2DM)|λI − J2,2| + O(k2M−2) = 0 if N > M, or else (λ + k2D1)(λ + k2D2) ⋯ s(λ + k2DM) = 0 if N = M. The eigenvalues of J − k2D will therefore converge to −k2D1, −k2D2, …, −k2DM and if N > M, also the eigenvalues of J2,2, which all have negative real part, by (II). It follows that all eigenvalues of J − k2D have negative real part for sufficiently large k (say, larger than some k4 ≥ k3). Furthermore, by (III), |J − k2D| changes sign first at k2 and second at k3. As there exist k < k2 and k > k3 both corresponding to all negative real part eigenvalues of J − k2D, it follows that there is at least one eigenvalue with positive real part when k2 < k < k3. The system therefore satisfies all conditions required for pattern-forming behaviour. ▪
The combination of lemmas 2.1 and 2.2 directly provides the conditions for which model reduction preserves pattern-forming behaviour. In particular, we have the following result.
Lemma 2.3. —
If a full (reduced) system is pattern-forming, then the reduced (full) system is also pattern-forming if both the reduced (full) system and—if it exists—its non-diffusible subsystem are stable without diffusion.
Proof. —
Conditions (I) and (II) of lemma 2.2 hold by definition. As the full (reduced) system is pattern-forming, there must exist distinct smallest values of k, k2 and k3, with 0 < k2 < k3 such that |J − k2D| changes sign at them. By lemma 2.1, the full and reduced systems change signs at the same values of k, so condition (III) of lemma 2.2 also holds. Therefore, the reduced (full) system is pattern-forming. ▪
There are two important implications of this result for model reduction in practice. Firstly, if we reduce a large model and find a set of parameters for which the reduced model forms patterns, then we only have to check the Jacobian of the full model to find if it also forms patterns. This is useful because checking the stability of a Jacobian is computationally much simpler than finding largest real eigenvalues as functions of k, especially for systems with many species. Secondly, if the reduced model is stable for a region of parameter space, then the full model cannot form patterns in that region. This is useful because the stable region is typically large, and unstable regions frequently correspond to physically impossible parameter values, and so model reduction can be an efficient way of eliminating systems incapable of pattern formation.
In the next section, we apply our technique to some example systems and confirm that our results hold.
3. Examples
3.1. Brusselator
One of the simplest chemical systems that is known to exhibit Turing patterns is the Brusselator, which in its original form is described by four reactions involving only two essential chemical species X and Y [31]
| 3.1 |
Here, the species A, B, D and E are explicitly included to ensure that mass is conserved. However, they are often removed during analysis as they do not contribute to the characterization of the system behaviour, under the assumption that A and B are never depleted.
Following some debate over the chemical plausibility of reactions with more than two reactants, it was proposed in [32] that by introducing a third chemical species, the trimolecular reaction could be converted to a pair of bimolecular reactions
| 3.2 |
As the resulting bimolecular Brusselator system has not previously been analysed for Turing pattern formation explicitly, we applied our model reduction approach to determine conditions for which Turing instability is preserved. To simplify the reaction network while retaining full coverage of the space of possible behaviours of the bimolecular Brusselator system, we remove the non-essential species and remove two of the rate parameters, leaving
| 3.3 |
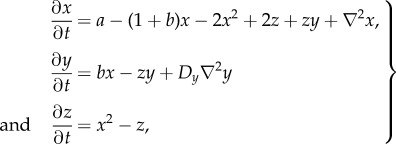
Note that we allow for the first new reactions to be reversible ( ), but keep the subsequent reaction irreversible, which together produces an essentially irreversible transition from 2X + Y to 3X, as in the original scheme. Assuming that X diffuses with unit rate, Y at a relative rate DY and Z is immobile, the concentrations of X, Y and Z for this system evolve as
 |
3.4 |
with equilibria  ,
,  . We perform a model reduction which removes Z from the system. As per our strategy, this is achieved by solving dz/dt = 0 for
  . We get
| 3.5 |
The reduced model is obtained by substituting equation (3.5) into equation (3.4)
 |
3.6 |
which recovers the reaction–diffusion equations for the classical Brusselator model.
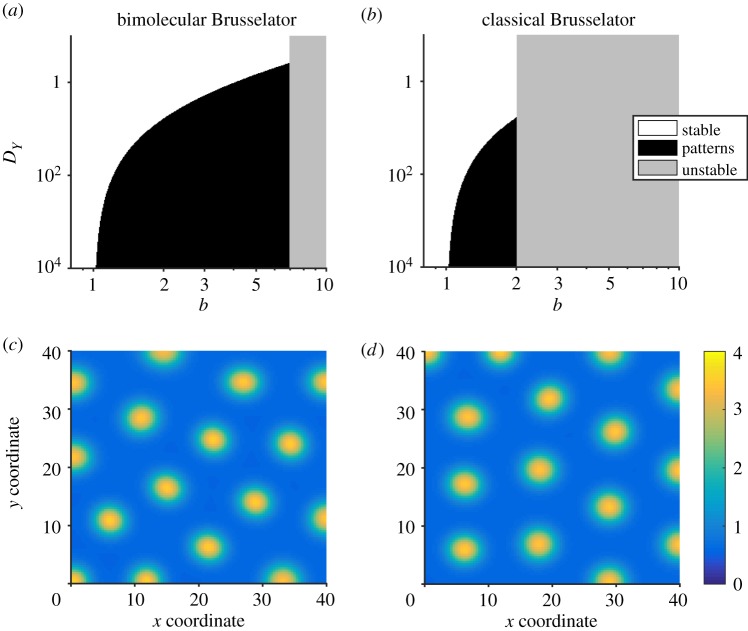
In general, we find that parameter values which lead to patterns in the bimolecular Brusselator model also lead to patterns in the classical Brusselator model (figure 1a,b). To see this, we varied the parameter b and the diffusion constant DY over large ranges, and compared the bifurcation diagrams. As we would expect from lemma 2.3, these show that parameter values which lead to patterns in the reduced system also lead to patterns in the full system; correspondingly, parameters which lead to patterns in the full system lead either to patterns or instability in the reduced system. In figure 1c,d, we show the patterns formed by the species X in systems (3.4) and (3.6), respectively.
Figure 1.
Model reduction of a bimolecular Brusselator mostly retains the bifurcation structure of the classical Brusselator model. Bifurcation diagrams are shown for (a) the bimolecular Brusselator (3.4) system and (b) the classical Brusselator (3.6) system. The clear area indicates parameter values of b and DY for which the homogeneous equilibrium is stable, while the black region indicates parameter values corresponding to Turing instability. The grey region indicates where the equilibrium solution is unstable in the spatially homogeneous scenario. (c,d) Stable patterns formed by species X in the bimolecular Brusselator (3.4) and classical Brusselator (3.6) systems respectively. In the bimolecular Brusselator, Z is assumed to be non-diffusible, which enables its removal by our model reduction procedure. The parameter values used in these analyses were a = 1, DX = 1, b = 1.88, DY = 10. Spatial simulations used a domain length of 20 (arbitrary units).
In figure 2, we show the dispersion relations for systems (3.4) and (3.6). As predicted by lemma 2.1, while the relations themselves are different, they both change sign at the same values of k, implying that both systems will form patterns on the same wavelengths.
Figure 2.
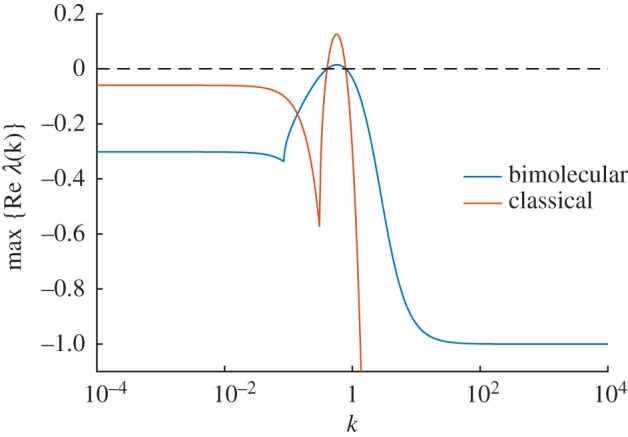
Dispersion relations for the bimolecular and classical Brusselators. Dispersion relations are shown for the bimolecular Brusselator (3.4) system and the classical Brusselator (3.6) system. Although the two plots are different in general, they both cross the zero line at the same points. Parameter values are as in figure 1.
3.2. Turing's example
We next considered a larger example that is closely related to one proposed by Turing [8]. It consists of species X, Y, W, C and C′, and concentrations x, y, w, c and c′ respectively. X and Y can diffuse with diffusion coefficients DX and DY, and the reactions are given by
 |
3.7 |
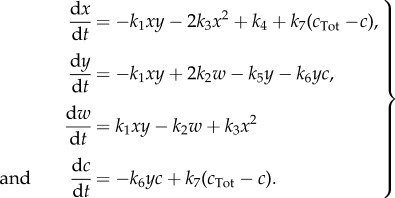
We note that the C and C′ are related via a conservation law, and so we substitute c′ = cTot − c (cTot constant), which leads to four independent ODEs that completely characterize the deterministic behaviour of the system
 |
3.8 |
To demonstrate how the model reduction can be applied to different extents, we reduce this system to both 3- and 2-species system approximations. First, we eliminate c by solving dc/dt = 0 for  , which gives
| 3.9 |
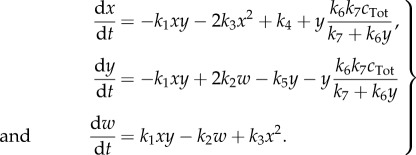
Substituting  in system (3.8), we obtain a three species system defined by
 |
3.10 |
Next, we eliminate w by solving dw/dt = 0 for  , which gives
| 3.11 |
Substituting  in (3.10), we obtain a two species system defined by
 |
3.12 |
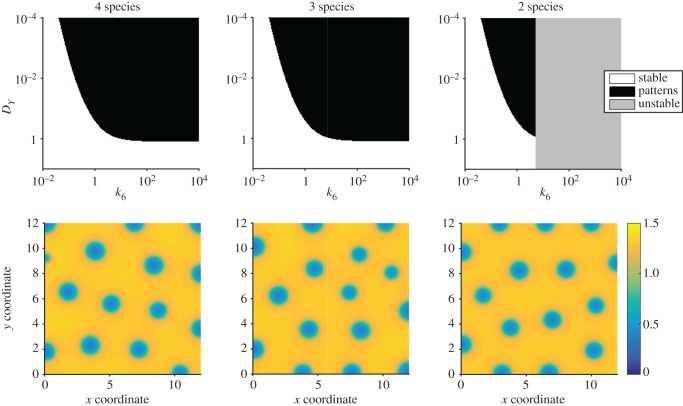
We therefore arrive at three models of system (3.7) with varying levels of dynamical complexity. A complete model is described by four species, whereas two successive equilibrium assumptions applied to C and then W generate two simpler models. To demonstrate the equivalence of Turing instability (lemma 2.3) across these models, we illustrate bifurcation diagrams of the full system (figure 3a), and the reduced three (figure 3b) and two species (figure 3c) systems. These show that the four and three species models have indistinguishable parameter-dependent behaviour, while the two species model is unstable for a region of parameter space where the other models are stable. We note that this unstable region prevents the two species model from forming patterns when the diffusion rates of X and Y are equal (DX = DY = 1), though such equal diffusion rates can produce patterns for the three and four species models. We also observe that pattern-forming parameters in the two species system also lead to patterns in the larger systems (figure 3d–f). This is similar to the situation observed for the Brusselator, whereby model reduction leads to a shrinkage of the parameter space that produces patterns. Intuitively, adding immobile species should lead to an expansion of the permissible parameter space in general, and therefore we are observing the opposite of this when applying our form of model reduction.
Figure 3.
Turing pattern analysis for a reaction network from Turing [8]. (a–c) Bifurcation diagrams for 4- (3.8), 3- (3.10) and 2-species (3.12) systems. In all cases, the parameter values used were k1 = 2, k2 = 0.2, k3 = 0.01, k4 = 0.08, k5 = 0.04, k7 = 2, cTot = 6, DX = 1. (d–f) Stable patterns formed by species X in the 4- (3.8), 3- (3.10) and 2-species (3.12) systems, respectively. In all cases, the parameter values used were as in (a–c) but additionally k6 = 3.37, DY=0.04, domain length = 6.
In figure 4, we show the dispersion relations for the 4- (3.8), 3- (3.10) and 2-species (3.12) systems. As predicted by lemma 2.1, while the relations themselves are generally different (although the 3- and 4-species relations are near-indistinguishable), they all change sign at the same values of k, implying that all systems will produce patterns on the same length scales.
Figure 4.
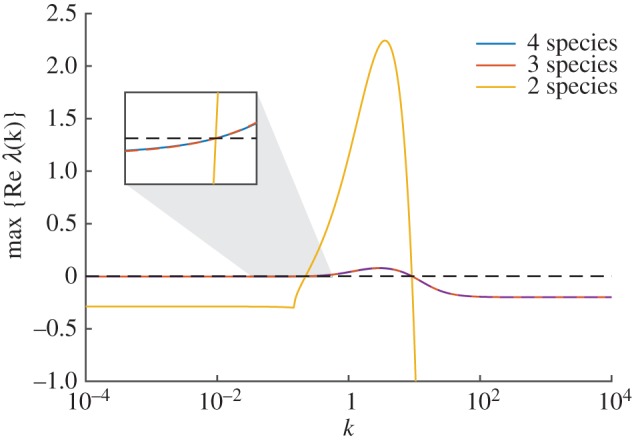
Dispersion relations for the reaction network from Turing [8]. Dispersion relations are shown 4- (3.8), 3- (3.10) and 2-species (3.12) systems (blue, red and yellow, respectively). Although the plots are different in general, all three cross the zero line at the same points. An inset plot shows the crossing of the zero line at the lower value of k. Parameter values are as in figure 3.
3.3. A synthetic gene circuit
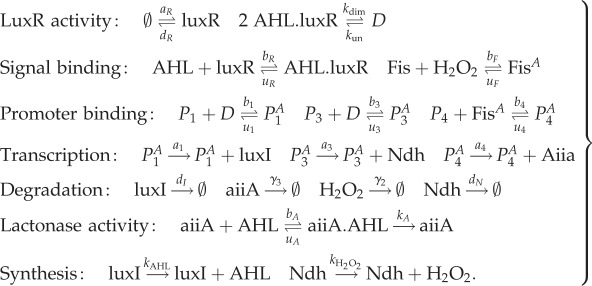
In our final example, we consider a much larger system consisting of 17 species, which is based on the synthetic gene circuit proposed in [18]. While this publication presents only a theoretical analysis of the synthetic gene circuit, it represents a biologically plausible approach to realizing a synthetic cellular Turing patterning circuit in live cells. The synthetic gene circuit is arranged in an activator–inhibitor network, whereby the intercellular signalling molecule acyl homoserine lactone (AHL) plays the role of a short-range activator, and hydrogen peroxide gas (H2O2) plays the role of a long-range inhibitor. Activation is achieved by AHL binding a constitutively expressed LuxR receiver protein, forming an activating complex for PLux promoters, which are placed upstream of coding sequences for the AHL synthase luxI [33] and the H2O2-producing ndh. The inhibitory loop is formed by an H2O2-sensitive topA promoter stimulating production of the AHL lactonase aiiA, which degrades AHL [34], thus inhibiting its action.
In [18], it is shown that a model containing five variables (but analysis over four variables due to the presence of a conservation law) can give rise to DDI for certain parameter choices. Already, analysis of Turing instability is made challenging by virtue of there being more than two essential dependent variables. One might categorize their model as having intermediate complexity, as a simpler model could be arrived at by considering only the concentrations of the diffusive signals AHL and H2O2. By contrast, a more complex model might be considered that describes more of the intracellular components, and complexes between them, directly.
Here, we show that the bifurcation properties of models of the synthetic gene circuit in [18] are preserved across models of varying complexity. To demonstrate this, we start by considering a model described by elementary chemical reactions, as follows:
 |
3.13 |
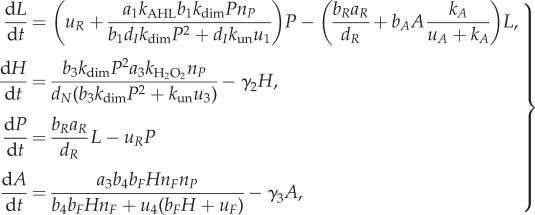
For brevity, we do not write out the full system of reaction rate equations here (although code is available from the authors upon request). We reduce the full system of equations to one of intermediate complexity consisting only of AHL, H2O2, AHL.luxR and aiiA (as considered in [18]), whose concentrations we write as L, H, P and A, respectively. The reduced ODEs are
 |
3.14 |
where nP is the total promoter concentration and nF is the total Fis concentration. While this system is very similar to the four species model studied in [18], there are some minor differences, but we nevertheless still find that Turing instabilities arise. These differences arise because we arrived at equation (3.14) by reducing a full mass-action system equation (3.13), while the system in [18] is not obtained systematically from a more complex model.
Finally, we can further reduce the system of intermediate complexity to a system comprising only the diffusive molecules AHL and H2O2:
 |
3.15 |
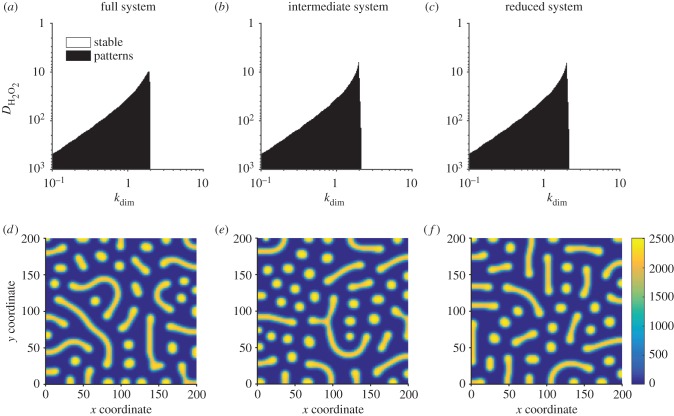
In figure 5a–c, we show bifurcation diagrams of the full system (3.13), the four species model (3.14) and the two species model (3.15). In this case, we find that the diagrams for the full (3.13) and intermediate (3.14) complexity systems are identical, while the diagram for fully reduced system (3.15) shows an unstable region of parameter space where the larger models are stable (in accordance with lemma 2.3). All three models have identical pattern forming regions. In figure 5d–f, we show stable two-dimensional patterns of [AHL] in each system, which illustrates how patterns of a similar wavelength emerge. This is confirmed by the dispersion relations shown in figure 6, which show that each system's dispersion relation changes sign at precisely the same wavenumbers (in accordance with lemma 2.1).
Figure 5.
Turing patterns are robust to reductions of a model of a synthetic gene circuit with intercellular signalling. (a–c) Bifurcation diagrams for systems (3.13)–(3.15), respectively. (d–f) Stable patterns formed by species AHL in systems (3.13)–(3.15), respectively. Parameter values: a1 = 2142, a3 = 1190, kAHL = 2, kH2O2 = 0.057, b1 = 0.156, b3 = 0.03, b4 = 0.25, bF = 2, dN = 2, dI = 2, dR = 2, γ2 = 2, γ3 = 2, bR = 0.0156, uR = 2, uA = 2, kA = 2, bA = 0.0117, aR = 0.5, kun = 2, nF = 2, nP = 2, u1 = 2, u3 = 2, u4 = 2, uF = 2, DAHL = 1; in (d–f), kdim = 2, DH2O2 = 100, domain length = 100.
Figure 6.
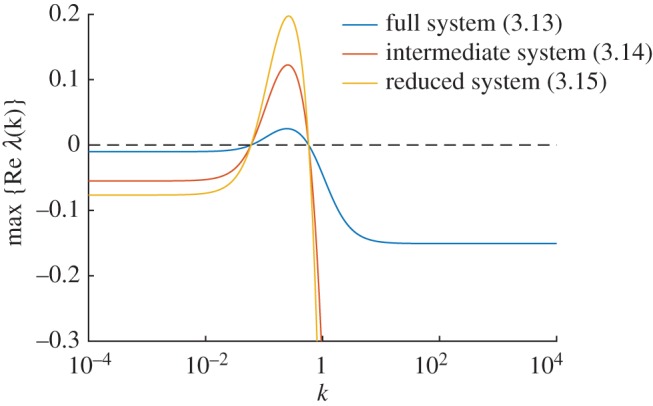
Dispersion relations for the synthetic gene circuit model. Dispersion relations are shown for systems (3.13)–(3.15) (blue, red and yellow, respectively). Although the plots are different in general, all three cross the zero line at the same points. Parameter values are as in figure 5.
4. Discussion
In this paper, we have proposed a technique for reducing a large chemical system to a small one, in a manner that preserves pattern-forming behaviour as far as possible. In essence, the reduction relies on a QSSA, since it assumes that the concentrations of the removed species can be written in terms of the remaining species without reference to time. However, the QSSA is a method to eliminate species which can be considered to be in equilibrium, to simplify the description of the non-equilibrium species; in Turing patterning systems all species are necessarily in equilibrium, so it may be misleading to equate our reduction method with the QSSA, although they are mathematically equivalent. Comparison with other model reduction techniques is also difficult, as unlike typical approaches, our strategy is not necessarily interested in preserving the correct dynamical behaviour of the full system: indeed, we make no claims that the reduced model is an accurate description of the original system. But as a consequence, it is notable that our approach does not require specific values of kinetic parameters, unlike model reductions in other systems and their behaviours.
The reduced model is derived with one aim in mind: to help find parameters of the full model which can lead to Turing patterns, or to help prove that none exist. In that respect, our technique is very successful. We have shown that, if we can find a pattern-forming parameter set for the reduced system, then it is simply a matter of checking the stability of the Jacobian of the full system to determine whether it, too, forms patterns with those parameters. Furthermore, if we can find a region of parameter space for which the reduced system is stable, then we know for certain that the full system cannot form patterns in that region.
The power of our technique is demonstrated very well on system (3.13): a biologically plausible system consisting of 17 species and 31 reactions. At face-value, it is impossible to know whether this system is capable of forming patterns, and, if so, which parameters correspond to pattern-forming behaviour. By performing a dramatic reduction from 17 to 2 species, due to there only being two diffusive species, we quickly found regions of parameter space corresponding to pattern-forming and stability in the reduced model. Our results prove that these regions necessarily correspond to potential-pattern-forming and no-pattern-forming, respectively, in the full system. The fact that both systems generate near-indistinguishable patterns is an added bonus. Temporal dynamics are not conserved, which can be seen in the larger eigenvalues of reduced systems (figures 2, 4 and 6), which is known to correlate with faster pattern emergence [35]. However, this is not surprising. Our model reduction technique is to simply assume that certain species equilibrate infinitely fast, and so the overall dynamics of reduced systems will be faster, in general.
Overall, our results provide a quick and rigorous way to check for pattern-forming behaviour in large biochemical networks. While we do not attempt to automate this process here, such automation could be of serious utility to synthetic biologists in their attempts to find and synthesize genetic networks capable of forming stable patterns. While the results here are unfortunately not applicable to the purely diffusive systems, we feel they will be of general interest to those in the reaction–diffusion field, as they provide a means to extend the current analytical tools developed for two or three species Turing-patterning systems to systems that additionally include an arbitrary number of non-diffusible species.
5. Numerical methods
All simulations and figures were prepared using Matlab R2016a. Code is available from GitHub: https://github.com/ndalchau/turing-model-reduction.
5.1. Dispersion relations
Dispersion relations (figures 2, 4 and 6) were evaluated numerically using Matlab's built-in eigenvalue function eig. The eigenvalues were computed for J and J − k2D (as defined in §2.1), with the equilibrium points as specified in the text of each example, and Jacobian entries differentiated by hand.
5.2. Bifurcation diagrams
Bifurcation diagrams (figures 1a,b, 3a–c and 5a–c) were constructed by sampling parameter values uniformly in two-dimensional subspaces of the overall parameter space for each example. Then for each parameter set, a dispersion relation was numerically evaluated. Region colours were then assigned according to the sign of the maximum of the real part of the eigenvalues at each wavenumber.
5.3. PDE simulations
PDE simulations (figures 1c,d, 3d–f and 5d–f) were carried out using an explicit finite difference scheme on a regular grid. The code was implemented in Matlab R2016a, making use of the del2u function to generate a finite difference approximation of ∇2 at each time step.
Acknowledgements
The authors would like to thank Boyan Yordanov and Andrew Phillips (both Microsoft Research) for helpful discussions about model reduction prior to conducting this work.
Data accessibility
Code for reproducing the numerical results is available from https://github.com/ndalchau/turing-model-reduction.
Authors' contributions
N.D. designed the study; S.S. proved the theorems, while both authors wrote simulation codes, developed the case studies and wrote the manuscript.
Competing interests
We declare we have no competing interests.
Funding
S.S. was funded by a Microsoft Research internship.
References
- 1.Koch AJ, Meinhardt H. 1994. Biological pattern formation: from basic mechanisms to complex structures. Rev. Mod. Phys. 66, 1481–1507. ( 10.1103/RevModPhys.66.1481) [DOI] [Google Scholar]
- 2.Edlund H. 2002. Organogenesis: pancreatic organogenesis developmental mechanisms and implications for therapy. Nat. Rev. Genet. 3, 524–532. ( 10.1038/nrg841) [DOI] [PubMed] [Google Scholar]
- 3.Fatehullah A, Tan SH, Barker N. 2016. Organoids as an in vitro model of human development and disease. Nat. Cell. Biol. 18, 246–254. ( 10.1038/ncb3312) [DOI] [PubMed] [Google Scholar]
- 4.Chen M-T, Weiss R. 2005. Artificial cell-cell communication in yeast Saccharomyces cerevisiae using signaling elements from Arabidopsis thaliana. Nat. Biotechnol. 23, 1551–1555. ( 10.1038/nbt1162) [DOI] [PubMed] [Google Scholar]
- 5.Song H, Payne S, Gray M, You L. 2009. Spatiotemporal modulation of biodiversity in a synthetic chemical-mediated ecosystem. Nat. Chem. Biol. 5, 929–935. ( 10.1038/nchembio.244) [DOI] [PMC free article] [PubMed] [Google Scholar]
- 6.Grant PK, Dalchau N, Brown JR, Federici F, Rudge TJ, Yordanov B, Patange O, Phillips A, Haseloff J. 2016. Orthogonal intercellular signaling for programmed spatial behavior. Mol. Syst. Biol. 12, 849 ( 10.15252/msb.20156590) [DOI] [PMC free article] [PubMed] [Google Scholar]
- 7.Wolpert L. 1969. Positional information and the spatial pattern of cellular differentiation. J. Theor. Biol. 25, 1–47. ( 10.1016/S0022-5193(69)80016-0) [DOI] [PubMed] [Google Scholar]
- 8.Turing AM. 1952. The chemical basis of morphogenesis. Phil. Trans. R. Soc. Lond. B 237, 37–72. ( 10.1098/rstb.1952.0012) [DOI] [PMC free article] [PubMed] [Google Scholar]
- 9.Gierer A, Meinhardt H. 1972. A theory of biological pattern formation. Kybernetik 12, 30–39. ( 10.1007/BF00289234) [DOI] [PubMed] [Google Scholar]
- 10.Klika V, Baker RE, Headon D, Gaffney EA. 2012. The influence of receptor-mediated interactions on reaction–diffusion mechanisms of cellular self-organisation. Bull. Math. Biol. 74, 935–957. ( 10.1007/s11538-011-9699-4) [DOI] [PubMed] [Google Scholar]
- 11.Marcon L, Diego X, Sharpe J, Müller P. 2016. High-throughput mathematical analysis identifies Turing networks for patterning with equally diffusing signals. eLife 5, 1–60. ( 10.7554/eLife.14022) [DOI] [PMC free article] [PubMed] [Google Scholar]
- 12.Sheth R, Marcon L, Bastida MF, Junco M, Quintana L, Dahn R, Kmita M, Sharpe J, Ros MA. 2012. Hox genes regulate digit patterning by controlling the wavelength of a Turing-type mechanism. Science 338, 1476–1480. ( 10.1126/science.1226804) [DOI] [PMC free article] [PubMed] [Google Scholar]
- 13.Raspopovic J, Marcon L, Russo L, Sharpe J. 2014. Digit patterning is controlled by a Bmp-Sox9-Wnt Turing network modulated by morphogen gradients. Science 345, 566–570. ( 10.1126/science.1252960) [DOI] [PubMed] [Google Scholar]
- 14.Nakamasu A, Takahashi G, Kanbe A, Kondo S. 2009. Interactions between zebrafish pigment cells responsible for the generation of Turing patterns. Proc. Natl Acad. Sci. USA 106, 8429–8434. ( 10.1073/pnas.0808622106) [DOI] [PMC free article] [PubMed] [Google Scholar]
- 15.Watanabe M, Kondo S. 2015. Is pigment patterning in fish skin determined by the Turing mechanism? Trends Genet. 31, 88–96. ( 10.1016/j.tig.2014.11.005) [DOI] [PubMed] [Google Scholar]
- 16.Lengyel I, Epstein IR. 1992. A chemical approach to designing turing patterns in reaction–diffusion systems. Proc. Natl Acad. Sci. USA 89, 3977–3979. ( 10.1073/pnas.89.9.3977) [DOI] [PMC free article] [PubMed] [Google Scholar]
- 17.Diambra L, Senthivel VR, Menendez DB, Isalan M. 2015. Cooperativity to increase turing pattern space for synthetic biology. ACS. Synth. Biol. 4, 177–186. ( 10.1021/sb500233u) [DOI] [PMC free article] [PubMed] [Google Scholar]
- 18.Borek B, Hasty J, Tsimring L. 2016. Turing patterning using gene circuits with gas-induced degradation of quorum sensing molecules. PLoS ONE 11, e0153679 ( 10.1371/journal.pone.0153679) [DOI] [PMC free article] [PubMed] [Google Scholar]
- 19.Scholes NS, Isalan M. 2017. A three-step framework for programming pattern formation. Curr. Opin. Chem. Biol. 40, 1–7. ( 10.1016/j.cbpa.2017.04.008) [DOI] [PubMed] [Google Scholar]
- 20.Basu S, Gerchman Y, Collins CH, Arnold FH, Weiss R. 2005. A synthetic multicellular system for programmed pattern formation. Nature 434, 1130–1134. ( 10.1038/nature03461) [DOI] [PubMed] [Google Scholar]
- 21.Liu C. et al. 2011. Sequential establishment of stripe patterns in an expanding cell population. Science 334, 238–241. ( 10.1126/science.1209042) [DOI] [PubMed] [Google Scholar]
- 22.Dalchau N, Smith MJ, Martin S, Brown JR, Emmott S, Phillips A. 2012. Towards the rational design of synthetic cells with prescribed population dynamics. J. R. Soc. Interface 9, 2883–2898. ( 10.1098/rsif.2012.0280) [DOI] [PMC free article] [PubMed] [Google Scholar]
- 23.Payne S, Li B, Cao Y, Schaeffer D, Ryser MD, You L. 2014. Temporal control of self-organized pattern formation without morphogen gradients in bacteria. Mol. Syst. Biol. 9, 697 ( 10.1038/msb.2013.55) [DOI] [PMC free article] [PubMed] [Google Scholar]
- 24.Gomez MM, Arcak M. 2017. A tug-of-war mechanism for pattern formation in a genetic network. ACS Synth. Biol. 6, 2056–2066. ( 10.1021/acssynbio.7b00077) [DOI] [PMC free article] [PubMed] [Google Scholar]
- 25.Murray JD. 1993. Mathematical biology, vol. 18 Berlin, Germany: Springer. [Google Scholar]
- 26.Satnoianu RA, Menzinger M, Maini PK. 2000. Turing instabilities in general systems. J. Math. Biol. 41, 493–512. ( 10.1007/s002850000056) [DOI] [PubMed] [Google Scholar]
- 27.Pearson JE, Bruno WJ. 1992. Pattern formation in an N+Q component reaction–diffusion system. Chaos (Woodbury, N.Y.) 2, 513–524. ( 10.1063/1.165893) [DOI] [PubMed] [Google Scholar]
- 28.Radulescu O, Gorban AN, Zinovyev A, Noel V. 2012. Reduction of dynamical biochemical reactions networks in computational biology. Front Genet. 3, 131 ( 10.3389/fgene.2012.00131) [DOI] [PMC free article] [PubMed] [Google Scholar]
- 29.Snowden TJ, van der Graaf PH, Tindall MJ. 2017. Methods of model reduction for large-scale biological systems: a survey of current methods and trends. Bull. Math. Biol. 79, 1449–1486. ( 10.1007/s11538-017-0277-2) [DOI] [PMC free article] [PubMed] [Google Scholar]
- 30.Baker RE, Gaffney EA, Maini PK. 2008. Partial differential equations for self-organization in cellular and developmental biology. Nonlinearity 21, R251–R290. ( 10.1088/0951-7715/21/11/R05) [DOI] [Google Scholar]
- 31.Prigogine I, Lefever R. 1968. Symmetry breaking instabilities in dissipative systems. II. J. Chem. Phys. 48, 1695–1700. ( 10.1063/1.1668896) [DOI] [Google Scholar]
- 32.Lefever R, Nicolis G, Borckmans P. 1988. The brusselator: it does oscillate all the same. J. Chem. Soc. Faraday Trans. 84, 1013 ( 10.1039/f19888401013) [DOI] [Google Scholar]
- 33.Schaefer AL, Val DL, Hanzelka BL, Cronan JE, Greenberg EP. 1996. Generation of cell-to-cell signals in quorum sensing: acyl homoserine lactone synthase activity of a purified Vibrio fischeri LuxI protein. Proc. Natl Acad. Sci. USA 93, 9505–9509. ( 10.1073/pnas.93.18.9505) [DOI] [PMC free article] [PubMed] [Google Scholar]
- 34.Liu D, Momb J, Thomas PW, Moulin A, Petsko GA, Fast W, Ringe D. 2008. Mechanism of the quorum-quenching lactonase (AiiA) from Bacillus thuringiensis. 1. Product-bound structures. Biochemistry 47, 7706–7714. ( 10.1021/bi800368y) [DOI] [PMC free article] [PubMed] [Google Scholar]
- 35.Miura T, Maini PK. 2004. Speed of pattern appearance in reaction–diffusion models: implications in the pattern formation of limb bud mesenchyme cells. Bull. Math. Biol. 66, 627–649. ( 10.1016/j.bulm.2003.09.009) [DOI] [PubMed] [Google Scholar]
Associated Data
This section collects any data citations, data availability statements, or supplementary materials included in this article.
Data Availability Statement
Code for reproducing the numerical results is available from https://github.com/ndalchau/turing-model-reduction.


