Abstract
Mutualisms are ubiquitous, but models predict they should be susceptible to cheating. Resolving this paradox has become relevant to synthetic ecology: cooperative cross-feeding, a nutrient-exchange mutualism, has been proposed to stabilize microbial consortia. Previous attempts to understand how cross-feeders remain robust to non-producing cheaters have relied on complex behaviour (e.g. cheater punishment) or group selection. Using a stochastic spatial model, we demonstrate two novel mechanisms that can allow cross-feeders to outcompete cheaters, rather than just escape from them. Both mechanisms work through the spatial segregation of the resources, which prevents individual cheaters from acquiring the resources they need to reproduce. First, if microbe dispersal is low but resources are shared widely, then the cross-feeders self-organize into stable spatial patterns. Here the cross-feeders can build up where the resource they need is abundant, and send their resource to where their partner is, separating resources at regular intervals in space. Second, if dispersal is high but resource sharing is local, then random variation in population density creates small-scale variation in resource density, separating the resources from each other by chance. These results suggest that cross-feeding may be more robust than previously expected and offer strategies to engineer stable consortia.
Keywords: syntrophy, stochastic spatial model, cross-feeding, pattern formation, neighbour uncertainty, multilevel selection
1. Introduction
Mutualisms are common [1]. For example, cooperative cross-feeding, a nutrient-exchange mutualism that is ubiquitous among microbes, has been observed in communities including the open ocean (diatoms and bacteria exchanging vitamin B-12 for carbon [2]), and the gut microbiomes of animals such as humans (bacteria exchange acetate for xylose [3]), bees (bacteria exchange lactate for pyrimidines and B-vitamins [4]) and termites (bacteria exchange hydrogen for vitamins [5]). However, models suggest that many mutualisms will be susceptible to cheaters, who receive the benefit of a mutualism without paying the cost of helping their partner [1,6–9]. For example, many metabolites are costly to produce [10,11]; therefore, if cross-feeders share resources freely, then individuals may benefit from not making resources. Left unchecked, each species will evolve towards non-production until the mutualism collapses [7,12,13]. Thus, why cross-feeding and other mutualisms are robust to cheating is a long-standing question [1]. In this paper, we examine mechanisms that allow cross-feeders to resist cheaters.
Cheaters in a cross-feeding mutualism may require resources from multiple mutualists [14]. This is unusual among mutualisms: for example, in pollination mutualism, cheaters never require both nectar and pollen transportation. We suspect that cheaters who rely on multiple mutualists are more common among microbes. Microbes produce a variety of public goods and services, including environmental detoxification [15], biofilm formation [16] extracellular products [17], and, of course, cross-feeding resources [2–5]. Thus, it is feasible that microbes could cheat at multiple functions. This work will thus help us understand how microbial mutualisms differ from non-microbial mutualisms.
Space is thought to be important for allowing cross-feeding and other mutualisms to persist [9,18,19]. Many studies have shown that mutualisms can persist by becoming segregated from cheaters [8,9,13,14,20–23]. Segregation typically occurs when individuals have long-term interactions within small groups [13,14,20,21]. This phenomenon can be understood using the multilevel selection framework [12,24]: individual cheaters will have an advantage within a group; however, groups with too many cheaters will collapse, and groups with few cheaters will tend to form new groups. Thus, whether cheaters dominate depends on the relative importance of an individual-level and group-level selection. Group selection that maintains cooperation has been called partner fidelity feedback [23].
Partner fidelity feedback relies on two key properties of space. First, interactions must be local (resources are shared within a group or small neighbourhood), so cheaters strongly affect their neighbours. If interactions are widespread and diffuse, then an individual's contribution will have little effect on others, and there will not be an immediate consequence of cheating. Second, microbes must have long-term interactions, ideally across generations; otherwise, a cheater could damage a local community and then leave (or disperse its offspring away) without consequences.
Though most studies have focused on partner fidelity feedback, space may promote cross-feeding in other ways. For example, mutualists can become segregated from the cheaters if cheaters disperse farther than mutualists [8]. However, these results still rely on the mutualists becoming segregated from the cheaters, rather than other aspects of the spatial structure. As far as we know, no studies have examined how spatial factors can allow cross-feeders to become competitively superior to cheaters.
Understanding how cross-feeding persists is of practical use in synthetic ecology. A goal of synthetic ecology is to grow multi-species consortia of engineered microbes [18,25,26]. One proposed strategy for stabilizing coexistence is to make the microbes cross-feed, so they rely on one another [27–30]. However, if there is selection for non-production, then such consortia may be short-lived. Some have proposed to counter this selective pressure using active behaviours that harm cheaters, such as quorum sensing or cheater punishment [31]. However, such behaviours may be challenging to engineer (but see [32]) and could themselves be selected against [18]. This problem has lead some to ask whether simpler and more passive mechanisms—such as those relying on population dynamics alone—are possible [18].
Here we use a stochastic spatial model to study how spatial processes affect whether cross-feeders can be robust to cheaters. As expected, we find that if cross-feeders have loose, short-term associations, then they are susceptible to cheating, and if they have tight, long-term associations, then they persist via partner fidelity feedback. Additionally, we demonstrate two novel ways that space can stabilize mutualism: cross-feeding can be stabilized by long-term associations, even when interactions are diffuse; and they can be stabilized by localized interactions, even when interacting with random partners. Both mechanisms are driven by population dynamics alone, without the need for complex behaviours. They allow the cross-feeders to be competitive dominants, rather than fugitive species who persist by escaping from cheaters.
2. Model summary
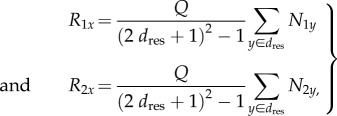
We modelled microbes competing for sites on a lattice (figure 1). Our consortium contains cross-feeding species 1 and 2 that produce resources 1 and 2, respectively, and a cheater that produces neither resource (figure 1a). Each cross-feeder produces quantity Q of its shared resource, and shares it equally with every individual within dres sites in each direction (known as a Moore neighbourhood of distance dres, [33]), figure 1b. Thus, the concentration of each resource at a site x, R1x and R2x for resources 1 and 2, will equal Q times the number of species 1 and 2 microbes within dres sites in any direction, i.e.
 |
2.1 |
where the summation is over the (2dres + 1)2 – 1 sites within dres sites of x, and N1y and N2y are 1 if a site y is occupied by a species 1 or 2 microbe (respectively) and 0 otherwise (figure 1b). Sharing resources uniformly is not a perfect representation of diffusion, because the resources are not concentrated at the source; however, it is a common simplifying assumption in stochastic spatial models because it is a tractable way to represent neighbourhood interactions [33].
Figure 1.
Model structure. (a) Species 1 and 2 produce resource 1 and 2, respectively. The cheater (species 0) produces neither resource. (b) Microbes take up resources from neighbours within a Moore neighbourhood of distance dres (i.e. all sites within dres sites in any direction, including diagonal). Here, the starred individual gains resource 2 from the five species 2 microbes within two sites; thus, R2x = 5Q/24. (c) Newly born microbes disperse to a random site within a Moore neighbourhood of distance dmic and survive if that site is empty. Here, offspring of the starred individual will survive if they disperse into one of the three adjacent sites that are unoccupied; thus, Ex = 3/8.
We assume that each microbe's reproductive rate is determined by the rarer essential resource (i.e. Liebig's Law of the minimum [27,34]). Thus, a microbe that is constrained by resource 1 limitation will not benefit from additional of resource 2. There is evidence for this in some primary producer systems [35]; we are not aware of tests in cross-feeding bacteria. We assume each cross-feeder makes enough of its own resource that that resource is never limiting. Thus, a cross-feeder produces offspring at a rate equal to its birth rate (b1 or b2) times the availability of the resource it does not make (R1x or R2x at site x) [27,36]. Therefore, during a time period of length Δt, a species 1 microbe will produce an average of b1R2xΔt offspring, and a species 2 microbe will produce an average of b2R1xΔt offspring. The cheater has a higher birth rate (i.e. b0 > b1 and b2), but because it does not produce either resource, its reproductive rate is proportional to the rarer essential resource. Thus, during a time period of length Δt, a cheater microbe will produce an average of b0min(R1x, R2x)Δt offspring. Therefore, the cheater has a higher reproductive rate than at least one cross-feeder at every site, and if both resources are similarly abundant, it will have a higher birth rate than both cross-feeders.
When a microbe reproduces, its offspring disperses to a random site in a Moore neighbourhood of dmic (figure 1c). If that site is empty, the microbe survives, but if the site is occupied, then the microbe dies [33]. Thus, if Ex is the fraction of sites near x that are unoccupied, then a species 1 microbe will produce an average of b2R1xExΔt offspring in Δt units of time. Empty sites act as a proxy for all other limiting resources besides resource 1 and 2 in our model.
All microbes die at density-independent rate δ, immediately freeing their site. Unused resources are degraded or removed from the system each time step.
2.1. Model analysis
We analysed the effect of cheaters by determining if they could invade an established pair of cross-feeders and either displace or coexist with them. As we show below, the system crashes in the absence of either cross-feeder, as expected in an obligate mutualism [36]; thus, our methods differed slightly from a traditional invasion analysis. Instead, we allowed species 1 and 2 to establish and then introduced a small number of cheaters. Cheaters were introduced once, but at high enough density that extinction from demographic stochasticity was unlikely [37]. We determined whether, after thousands of generations, the species coexisted (i.e. all species persisted), the cross-feeders displaced the cheaters (i.e. the cheater went extinct while the cross-feeders persisted) or the community crashed (i.e. all species went extinct).
Most of our analysis was done using simulations. Details as to how the model was implemented are described in appendix A. We also considered a mean field version of this model, which we analysed using differential equation (appendix B). Additional analyses on the spatial properties of the community are reported in appendix C.
3. Results
The two parameters that determine the impact of space are resource sharing distance, dres, and microbe dispersal distance, dmic. Resource sharing distance determines how diffuse the interactions are. A low dres means microbes have strong interactions with few neighbours and a high dres means microbes have diffuse interactions with many neighbours. Microbe dispersal determines partner associations. Low dmic means offspring will not disperse far, and will therefore have similar neighbours as their parents. In this case, there is a strong connection between a microbe's density and the local conditions, because microbes will build up in good areas. High dmic means that microbes will have random neighbours and that local abundance is due to random dispersal rather than local conditions.
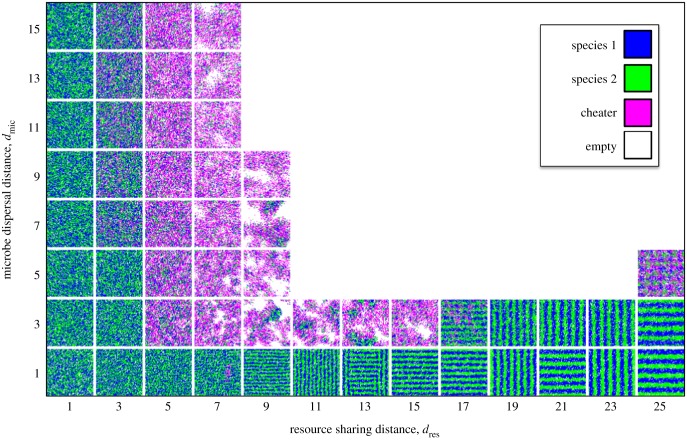
Our model produced four qualitatively different outcomes, depending on whether dres and dmic were large or small (figure 2). We explain each case separately.
Figure 2.
Community patterns as a function of resource sharing and microbe dispersal distances. Each square represents a community 5000 time units after a cheater was introduced. Communities that are all white are those in which the cheater drove everyone extinct. Repeated simulations gave consistent results, except that the stripes have different orientations each time, and communities with moderate dres and dmic sometimes randomly go extinct. Here, b1 = b2 = 0.6, b0 = 0.7, δ = 0.15, Q = 6.5, and the domain is 200 × 200 sites. (Online version in colour.)
3.1. Non-spatial dynamics (high dres and dmic)
If resources are shared over long distances and offspring disperse far (high dres and dmic), then microbes have weak interactions with many random neighbours, so spatial processes have little effect. Our simulations suggest that in this case, cheaters always collapse the cross-feeding community (figure 2).
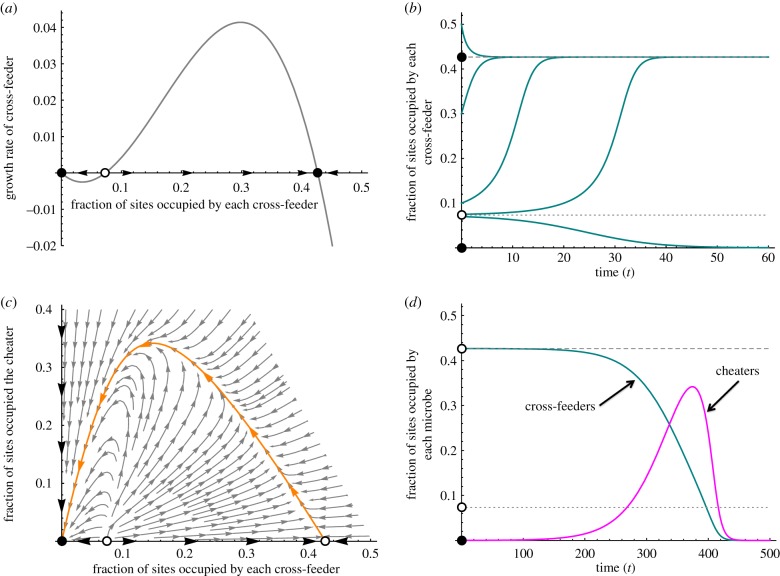
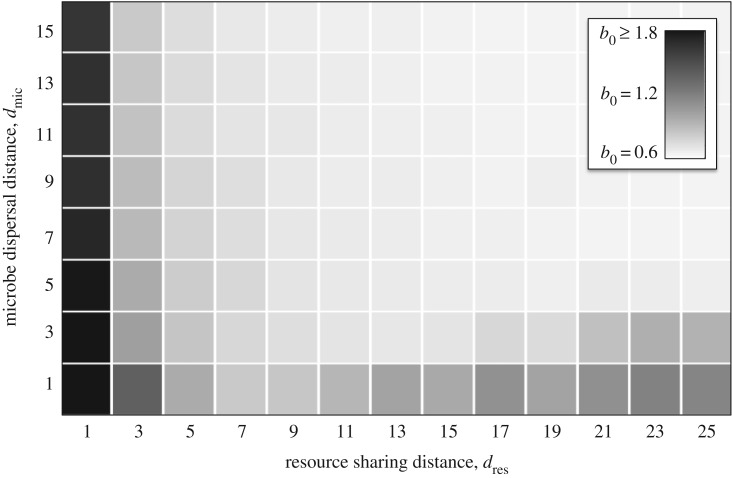
By assuming that dres → ∞ and dmic → ∞, we derive a mean-field model to understand the well-mixed case (appendix B). This acts as a baseline for understanding how space alters community dynamics. Well-mixed communities are highly susceptible to cheaters (figures 2, 3 and 5). A well-mixed community with cross-feeders but not cheaters has at most two stable equilibria—extinction and coexistence (figure 3a). The shared resources create a positive feedback [28,36]: if cross-feeders are rare, then each will be too resource-limited to reproduce, and their densities will decline further; however, if cross-feeders are common enough, then sufficient resources will be produced, and the cross-feeders will grow until they are limited by space (figure 3b). The cheater can invade a community of cross-feeders, because both resources are readily available and the cheater has a higher birth rate (figure 3c, appendix B). As the cheaters become abundant, they displace the cross-feeders, until the cross-feeders become too resource limited to reproduce, and the consortium crashes (figure 3d).
Figure 3.
Results of the mean-field model. (a) A system without cheaters will have at most three equilibria: a stable extinction equilibrium, a stable positive equilibrium and an unstable equilibrium separating them. (b) If the cross-feeders begin at a density above the unstable equilibrium, they will converge on the positive equilibrium. If they begin below the unstable equilibrium, they go extinct. (c) If a cheater is introduced, the positive equilibrium becomes unstable, and no new equilibria are created. (d) Thus, cheaters drive the cross-feeders extinct and then die off. In each figure, b1 = b2 = 0.6, b0 = 0.7, Q = 4 and δ = 0.15. (Online version in colour.)
Figure 5.
Robustness to cheaters. We calculated the maximum birth rate (b0) that a cheater could have without driving a community of cross-feeder extinct. The larger this number is, the more robust the community is to cheaters. Each simulation was run with b1 = b2 = 0.6, δ = 0.15, Q = 6.5 and a community size of 200 × 200 sites.
3.2. Partner fidelity feedback (low dres and dmic)
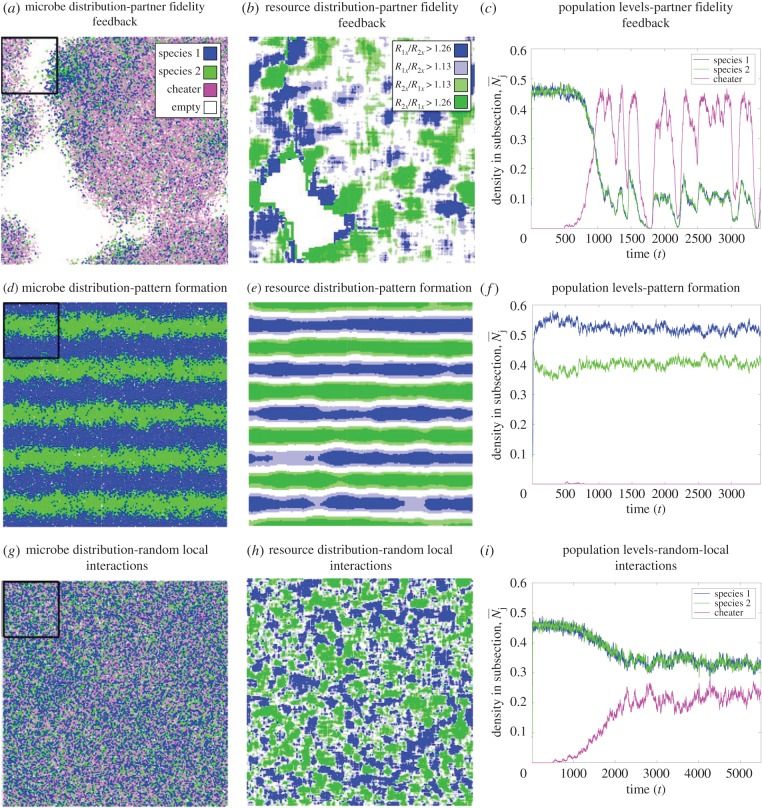
If microbes share resources with a few neighbours and have short-range dispersal (low dres and dmic), then a microbe's resource production has a strong impact on the local conditions and species will tend to build up in favourable locations. In this case, cross-feeding is stabilized by partner fidelity feedback (i.e. strong group selection [12]). Here, local communities behave similarly to the global community in the non-spatial case: individual cheaters will reproduce and grow if they are surrounded by cross-feeders; however, as the cheaters become locally abundant, they will displace the cross-feeders, become too resource-limited to reproduce, and cause the local population to crash. Cross-feeders can persist when there is a dynamic spatio-temporal mosaic, where groups of cross-feeders bud off and grow into empty sites, temporarily escaping the cheaters (figure 4a,c, electronic supplementary material, movie A1). Thus, cheaters have a within-group competitive advantage (figure 4b and 6), but groups of cross-feeders have an advantage (figure 7).
Figure 4.
Microbe and resource distribution under each mechanism. (a) The distribution of microbes with localized interactions (dres = 9) and dependable associations (dmic = 7). (b) The relative density of resources at each site in a. Green and blue areas (lighter and darker areas if in greyscale) indicate that species 1 and 2 has an advantage, respectively (i.e. because b0/b2 ≈ 1.13). (c) Temporal dynamics in the black square in a. (d–f) are analogous to a–c, but with diffuse interactions (dres = 25) and but dependable associations (dmic = 3). Cheaters could not persist here. (g–i) are analogous to a–c, but with localized interactions (dres = 3) and random associations (dmic = 15). Parameters are the same as figure 2. (Online version in colour.)
Figure 6.
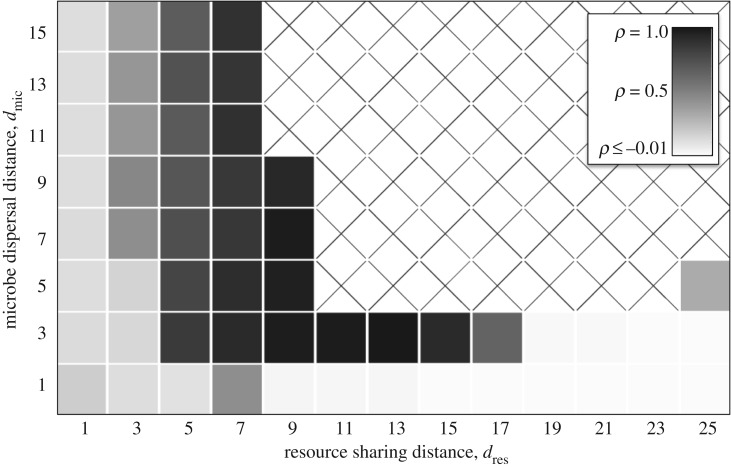
Whether cross-feeders and cheaters partition sites. We correlated the cheater's reproductive rate (B0x) with each cross-feeder's reproductive rate (B1x and B2x) across all sites for each community in microbes in figure 2. Cells display the average of both correlations. Values close to 1 indicate that sites were generally good or bad for every species. Values close to 0 indicate that many sites were good for a cross-feeder but bad for the cheater.
Figure 7.
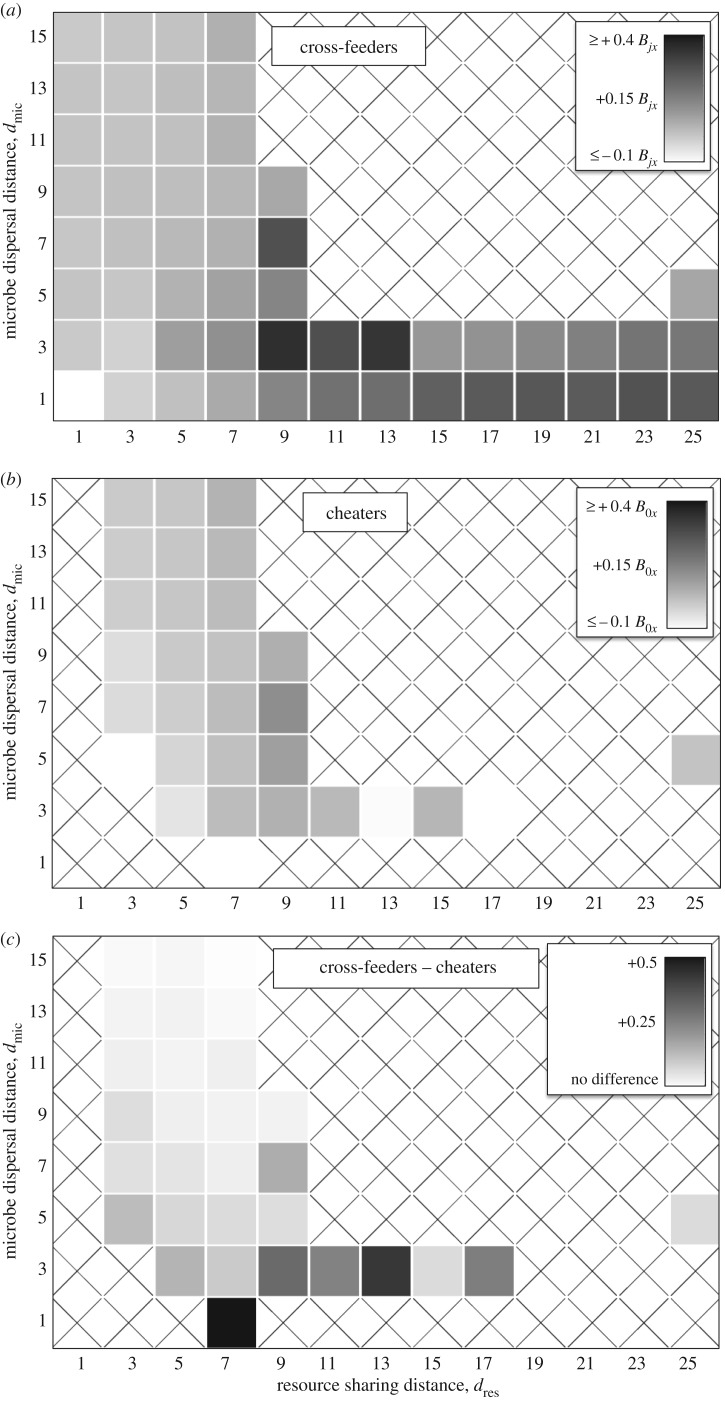
Whether microbes are near the resources they need. (a) We calculated the reproductive rate of each cross-feeder at each site (i.e. B1x or B2x), using the communities in figure 2. We subtracted the mean of this value across all sites from the mean in only sites where that microbe was found. If this difference was positive, then randomly moving a microbe would reduce its reproductive rate. Each result is the average value for both cross-feeders. (b) We calculated the same value for each cheater (i.e. B0x). Communities without cheaters are labelled with an X, because we could not measure the effect of sites they occupy if they are absent. (c) We subtracted the values in b from those in a. When that difference was positive, it indicated that the cross-feeders were more likely to be in favourable locations, compared to the cheater.
3.3. Pattern formation (high dres and low dmic)
If offspring disperse short distances (low dmic) but resources are shared over long distances (high dres), then microbes will build up where the conditions are most favourable, but individuals will have little impact on local resource levels. Group selection has little effect here: a cheater could build up in a good environment without consequences (at least until a huge area collapses). Nonetheless, our simulations show that cross-feeders are robust to cheaters under these conditions (figures 2 and 5), showing that a novel mechanism is occurring.
This novel mechanism occurs because when dmic is low and dres is high, cross-feeders self-organize into regular spatial patterns [38] (figures 2 and 4d; electronic supplementary material, movie A2). Both striped and spotted patterns are possible (figure 2). These patterns form because the resource a cross-feeder produces is most abundant where the producer is not. To see this, consider a species 1 (blue) stripe in figure 4d. The resource they produce is shared over a distance slightly more than the width of a stripe, so most of the resource 1 is produced locally rather than being shared from neighbouring stripes. However, the species 1 stripe is surrounded by two species 2 (green) stripes, each of which produces resource 2 that is shared across most of the blue stripe. Thus, resource 2 will be more abundant in a species 1 stripe (figure 4e). Because species 1 is limited by resource 2, it has a higher reproductive rate in the middle of its own stripe. Similarly, species 2 has a higher reproductive rate in its own stripe. Because of local dispersal, each population builds up where it grows best, thus providing positive feedback that reinforces the regular spatial pattern.
Cheaters cannot persist in areas with a shortage of either resource, because they will have a lower reproductive rate than one of the cross-feeders. For example, a cheater in the core of a species 1 stripe will be limited by resource 1, whereas a species 1 microbe in that area will be limited by the more abundant resource 2 (figures 4e and 8). If this effect outweighs the cheater's inherent birth rate advantage, then the cheater will have a lower reproductive rate than the species 1 microbes and will be excluded from the core. The only place that cheaters have a competitive advantage is at the interface between stripes or spots, because both resources are similarly abundant there (figure 4e). Thus, there may be some group-level selection at the edges between stripes; however, cross-feeders gain an individual-level advantage over much of the environment (figure 8). Thus, spatial pattern formation can allow the cross-feeders to coexist with, or even exclude the cheater (figure 2).
Figure 8.
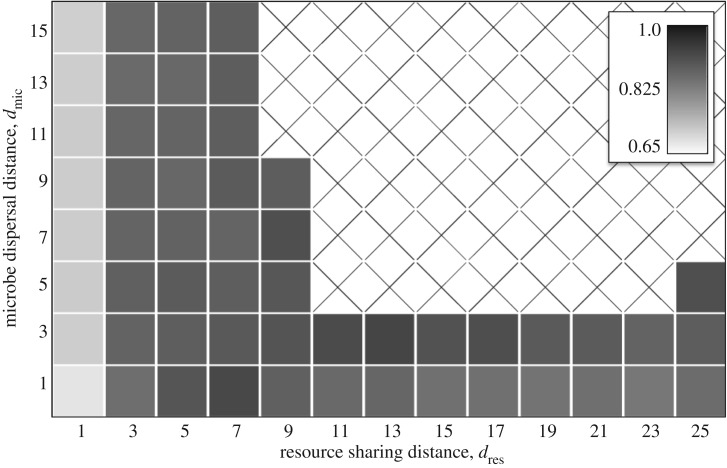
Amount that the cheater was limited because the resources were separated. We calculated the cheater's average reproductive rate (B0x, averaged across all sites) for each community in figure 2. We divided this value by what the average would have been if under well-mixed conditions (i.e. dres → ∞). Lower values indicate that the cheater was highly limited because each resource was found in different areas, and higher values indicated that both resources tended to have similar values. The cross-feeders have a birth rate disadvantage of b2/b0 ≈ 0.88; therefore, if the cheater and cross-feeders are coexisting, we expect the cheater's reproductive rate to be reduced by about 12% (less if spatial structure is important, figure 7).
A similar pattern occurs when spots form: blue spots are blue because they receive green resources from four neighbours, and the cheater dominates between the spots (because resource densities are similar), electronic supplementary material, movie A4.
3.4. Neighbour uncertainty (low dres and high dmic)
If offspring disperse long distances (high dmic), but resources are shared over short distances (low dres), then microbes will interact with a small, random subset of the community and their associations will be completely different from their offspring. Group selection has little effect here: a cheater will depress the growth rates of its neighbours and a cross-feeder will increase the growth rates of its neighbours, but the offspring of both will experience totally different conditions. Thus, a cheater could degrade a local community without its offspring suffering the consequences. Nonetheless, simulations again show that cross-feeders can persist under these conditions (figures 2 and 5), showing that another novel mechanism is occurring.
This novel mechanism, which we call neighbour uncertainty, occurs because highly localized interactions will cause resources to segregate, even if associations are completely random. If resources are shared over short distances, then small-scale variation in population density will lead to small-scale variation in resource availability [39]. For example, if microbes receive resource from eight neighbours (i.e. dres = 1) and species 1 occupies 20% of sites, this does not mean that every microbe will have 1.75 species 1 neighbours; instead, some will have two or three, others will have one or zero. As a result, many sites will have less of resource 1 or resource 2 by chance (figure 4g,h). Such variation hurts cheaters, because they need to obtain both resources from neighbours to reproduce. Intuitively, imagine that microbes are distributed randomly, and that each resource is at above-average concentration in half of the sites; in this case, individual cheaters will benefit in the 25% of sites where both compounds are at above-average concentration, but be hindered in the 75% of sites where at least one resource at below-average concentration. Thus, on average the cheater will be hindered. This effect is strongest when dres = 1, because resource variation is highest, but it still occurs at larger dres: figure 8 shows that that the cheater is harmed by resources being separated when dmic ≥ 9 and dres ≤ 5, and figure 9 shows that this effect is not due to spatial structure. Neighbour uncertainty does not harm the cross-feeders: species 1 will benefit in areas where compound 2 is abundant and be hindered where compound 2 is rare, but there is little effect on average. Therefore, most cheaters will be more resource limited than most of the cross-feeders. When this effect is strong enough, the cheater will be at a competitive disadvantage relative to the cross-feeder in most sites (figure 4h). Thus, this mechanism can allow the cross-feeders to exclude or coexist with cheaters (figure 2 and 4i).
Figure 9.
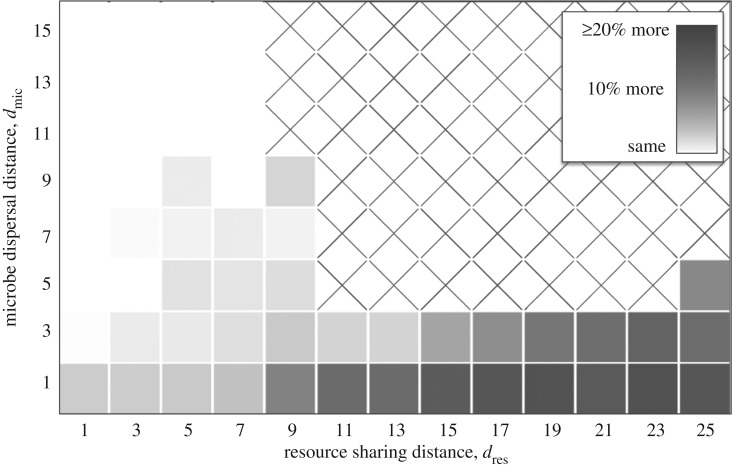
Amount that a cheater would benefit if spatial structure was disrupted. We calculated the cheater's average reproductive rate (B0x, averaged over all sites) for each community in microbes in figure 2. We then randomly rearranged the microbes, and re-measured the mean of B0x. The heat map shows how much the mean of B0x increased in the rearranged community, and thus quantifies how much spatial structure hindered the cheaters.
4. Discussion
How mutualisms such as cross-feeding persist in a world of cheating is a fundamental problem of evolutionary ecology. Spatial factors are often seen as an important explanation [9,18,19]. Studies to date have focused on how spatial factors can allow cross-feeders to escape from cheaters [8,9,13,14,20–22]. Here, we show two novel mechanisms by which cross-feeding is maintained by space. Both mechanisms create individual-level selection for cross-feeding, and can allow cross-feeders to outcompete cheaters (figure 2). These results thus parallel models of within-species cooperator/cheater dynamics, which suggest spatial factors can cause ‘cooperative’ traits to be beneficial for selfish reasons [40,41].
First, if microbes can build up where conditions are most beneficial to them but have weak, large-scale interactions, then cross-feeders will become self-organized into regular stripes or spots (figure 4d). Each individual stripe or spot has a local shortage of one resource, which limits the growth of cheaters (figure 4e). A few previous studies have shown pattern formation in a mutualist–exploiter system [8,20]; however, in those models the mutualists persisted by escaping their cheaters, rather than outcompeting them. This mechanism seems most likely to occur in biofilm systems, especially if shared compounds can diffuse across many fixed microbes. Indeed, many biofilms have been shown to form patterns [42].
Second, if microbes have strong interactions with a few neighbours, but those neighbours are random, then cheaters will often experience a local shortage of one resource (figure 4h). This harms the cheater, because not synthesizing any essential resources is a poor strategy when resources are uncertain. A recent study suggested a similar phenomenon in a model where microbes had random, long-term interactions [14]. This mechanism seems most likely to occur in systems that are well-mixed (e.g. the open ocean) and where compounds quickly degrade (so compound densities vary).
Pattern formation and neighbour uncertainty work in fundamentally the same way: the two essential resources are separated in space, leaving individual cheaters limited by one resource and at a disadvantage relative to one of the cross-feeders. Each mechanism achieves this effect by different means. Under pattern formation, population dynamics arrange the cross-feeders such that there is regular, large-scale variation in resource density (figure 4e). Under neighbour uncertainty, localized interactions create random, small-scale variation in resources (figure 4h), without the need for self-organization. Thus, artificially mixing the system will harm cross-feeders that persist via pattern formation, but not those that persist via random localized interactions (figure 9). In fact, neighbour uncertainty appears to function whenever dres is small, and thus works in tandem with partner fidelity feedback (figure 6).
The second difference between these mechanisms is how dependably cross-feeders find themselves in favourable locations. Under pattern formation, individuals of species 1 are almost always in areas beneficial to species 1 (figures 4d and 7); thus, cross-feeders can exclude cheaters when the effect of resource limitation is weak. Under neighbour uncertainty, individuals of species 1 are equally likely to be in areas beneficial to species 1 or species 2 (figures 4g and 7); thus, the effect of resource limitation on the cheaters must be much stronger for the cross-feeders to maintain dominance. This is why cheaters are excluded in figure 4d, but not figure 4g, even though resource limitation is similar in both communities (figure 8).
Like any model, our results are based on the specific assumptions we used, such as uniform dispersal and cheaters being limited by the rarest resource (i.e. Liebig's Law). The critical assumptions needed to produce neighbour uncertainty are (i) microbes interact with a small number of neighbours, (ii) the microbes associate randomly, and (iii) a cheater who is limited by one resource gains less benefit from taking up the other resource. Thus, we expect neighbour uncertainty to be robust to our assumptions: any resource sharing kernel should produce ingredient (i) if it is short-ranged, any rapid and random movement should produce ingredient (ii) [39], and many concave uptake functions should produce ingredient (iii). Our model assumed that resource levels quickly equilibrate, rather than building up when not used. It is not clear whether this assumption increased or decreased the between-site variation in resource density. If it decreased between-site variation, then a model with slower resource removal could actually have stronger effect of neighbour uncertainty.
The critical assumptions needed to produce pattern formation are (a) microbes disperse short distances, (b) a cheater who is limited by one resource gains less benefit from the other resource and (c) the resource sharing kernel must be shaped such that it is better to be at an intermediate distance from two partners than right next to one partner. Ingredients (a) and (b) should be easy to produce, but some sharing kernels will probably not produce (c); for example, preliminary simulations suggest that Gaussian kernels may not have that property. We expect that if (c) does not hold, then patterns will not be stable because the most abundant resource in a stripe or spot will be the one produced by the microbes there. Future studies should determine how robust this mechanism is to different resource sharing kernels.
Both novel mechanisms work because cheaters need both resources. Thus, we suspect that if a cheater only needed only one resource, and could make the other resource without sharing it, then the novel mechanism will fail. It is not unreasonable to assume that microbes cannot produce a resource without sharing it: many microbes excrete compounds to maintain homeostasis, and all microbes excrete compounds when they lyse [11]. More generally, detoxification, biofilm production and many other microbial functions produce some public benefit [11]. Thus, we feel the assumption that cheaters need both mutualists is valid for some microbial mutualisms (though unlikely for non-microbial mutualisms). Future studies should examine how leaky traits must be for our mechanisms to function.
Our results suggest novel ways that cross-feeding can be maintained by population dynamics alone. However, many active behaviours have also been proposed to explain how cross-feeding persists [31]. For example, mutualisms can be maintained if mutualists can choose their partners [7], provide fewer resources to cheaters [6] or actively punish cheaters [43]. It is likely that both behavioural and population dynamics mechanisms act in real populations. Future work should examine if such active behaviours would enhance or undermine pattern formation and neighbour uncertainty.
In addition to providing two novel explanations for how cross-feeding is maintained, our work suggests strategies for making synthetic consortia robust against non-producing cheaters. Pattern formation and random local interactions do not require complex behaviours like quorum sensing, and will be more temporally stable than partner fidelity feedback (figure 4; electronic supplementary material, movies A1, A2 and A3). Many of the technologies needed to produce these effects have already been developed. For example, gels, semi-permeable membranes and microfluidic devices can stop microbes from moving without stopping them from sharing compounds [44]; these could be used to generate spatial patterns. Similarly, microfluidic devices have been developed which partition consortia into small groups by injecting them into tiny droplets [45]; these could be used to generate random local interactions. Future work should examine what are effective ways to implement these mechanisms in synthetic consortia.
Acknowledgements
We thank members of the Klausmeier-Litchman lab group and five reviewers for discussion and comments on the manuscript. Our work was funded by DARPA; however, this publication does not necessarily reflect the position or policy of DARPA or the US government, and no official endorsement should be inferred. This is W. K. Kellogg Biological Station contribution no. 2007.
Appendix A. Model implementation
Most results were generated using simulations. The community is modelled on a grid (typically 200 × 200 sites) with periodic boundary conditions. Each site can be empty or contain a single microbe of any type. Each time step in a simulation represents Δt units of time (typically 0.1). During each time step, we determine if empty sites become occupied by new microbes and if occupied sites become empty via a microbe dying. We assume that both events occur simultaneously.
An empty site became filled if a nearby microbe gives birth and disperses its offspring there. The average number of offspring produced in a given time step, Bjx for species j at site x, is
 |
A 1 |
The probability that a site x became filled with an individual of species j was therefore  . We selected values of Δt such that this average was much less than 1 to minimize the possibility that multiple microbes colonize a site in the same time step (such effects were ignored).
Microbes die in each time step with probability δΔt. Microbes can reproduce during the time step they die. A site cannot be recolonized the same time step it becomes empty, and a microbe cannot die during the time step it was born; such events do not have an effect when Δt is small.
The simulation was written in Java and interfaced through R, and some of the analysis was performed in Matlab.
For figure 2, we initiated a community with 3000 individuals of each cross-feeder (7.5% of sites occupied). This was enough to allow the cross-feeders to persist for these parameters in the absence of cheaters. After 20 000 time steps (2000 time units or approximately 300 generations), we introduced 150 cheater individuals (0.375% of sites) at random locations, displacing any individuals there. We then ran the simulation for an additional 50 000 time steps to approach a steady state. Figure 4 was generated using similar methods, except that the cheater was introduced after 5000 time steps and then the simulation was run for an additional 30 000 time steps. Figure 4 displays the spatial distribution at 29 400 time steps, in order to show the population in figure 4a as it was transitioning between a boom and a bust (at 30 000 time steps, there are few empty locations, but the population is about to crash in many localities, making the figure less illustrative). The neighbour uncertainty case (figure 4g–i) was run for 50 000 time steps, because it took longer for the community to equilibrate. Movies of each can be found in the electronic supplementary material.
Appendix B. Analytical results
B.1. Derivation of mean field model
Under mean-field conditions, the finite rate of increase of an individual of species j (i.e. its geometric growth rate), λj, is λ = 1 + birth–death. This expression simplifies to
| B 1 |
where Bj is the average number of times that species j reproduces (equation (A 1)) and Nj is the fraction of sites held by species j. In this appendix, we use Nj and Bj without the x to represent the mean of Nxj and Bxj across space. The parenthetical term is the fraction of sites that are empty. Taking the limit of (B 1) as Δt → 0 results in the continuous-time model
 |
B 2 |
For the analysis used to generate figure 3, we make the additional simplifying assumption that b1 = b2 and N1 = N2 (which we call N1–2), to reduce the model dimensionality to aid intuition. With this assumption of species symmetry, we can model both cross-feeders with a single equation, and (B 2) simplified to
 |
B 3 |
We justify this symmetry assumption below.
B.2. Stability of mean-field model
We will conduct most of the analysis on equation (B 2) (i.e. without the symmetry assumption), though add that assumption when needed.
If the cheater is absent, this system will have one of three equilibria. This system always has an extinction equilibrium
| B 4 |
Additionally, when birth rates and compound production are sufficiently high relative to death rates, then it will have two positive equilibria,
 |
B 5 |
If b1= b2, these simplify to
 |
B 6 |
which exists whenever Qb1 > 8δ. Thus, N1 and N2 approach equality when b1 = b2 and the cheater is absent, which justifies our symmetry assumption that N1 = N2.
At the extinction equilibrium, the Jacobian matrix is
| B 7 |
which is always stable. At a positive equilibrium, the Jacobian matrix is
| B 8 |
Plugging in (B 5), we find that the smaller positive equilibrium is unstable but the larger positive equilibrium is stable (if they exist). Thus, this system has multiple stable equilibria.
Next, we show that the cheater will inevitably crash the system.
No positive equilibrium can exist in a system with the cheater. To see this, we will assume that one does exist and arrive at a contradiction. We assume WLOG that  . If a positive equilibrium exists, then dN2/dt = 0 and
  . In this case, we can rearrange species 2's growth equation to
| B 9 |
Substituting this into the cheater's growth rate (when  ), we find that
| B 10 |
This is positive whenever N0 > 0, by our assumption that b0 > b2. Thus, because dN0/dt > 0 when dN2/dt = 0 and each species has a positive density, a positive equilibrium with all three species cannot exist.
The equilibrium  cannot be stable, because if dN1/dt = 0 and dN2/dt = 0, then the cheater must have a positive growth rate (as shown above). The extinction equilibrium has Jacobian matrix
 |
B 11 |
Thus, only the extinction equilibrium,  , is stable.
If we assume that b1 = b2 and N1 = N2, then we can reduce our system to a two-dimensional system, shown in figure 3. In this case, we have a closed, bounded, two-dimensional system with no internal equilibria; therefore, no limit cycle exists. Because the system is bounded, does not contain a closed loop, and contains no other stable equilibria, the extinction equilibrium is globally stable. Hundreds of computer simulations across a variety of parameters suggest that the same results hold when b1 ≠ b2.
Appendix C. Additional analysis of spatial patterns
Here we present an additional analysis of the spatial patterns observed in our simulations.
For figure 5, we used a bisection method to calculate the maximum birth rate b0 a cheater could have without driving the cross-feeders extinct. We checked values between b0 = 0.6 (equal to b1 and b2) and 2.4. For each value of b0, we allowed the cross-feeders to reach an equilibrium, introduced a small number of cheaters, and determined if the cross-feeders persisted after 20 000 time steps. If the cross-feeders persisted at a given b0, then we checked if they persisted at a b0 half way between this and the lowest b0 where they did not persist; if the cross-feeders did not persist, then we checked if they persisted at a b0 half way between this and the highest b0 where they did persist. We repeated this for eight trials, reaching an accuracy of 1.8 × 2−8 ≈ 0.007. We measured the minimum b0 needed to invade using the same method, and the results were similar. Two simulations runs showed extremely similar results, suggesting that stochastic extinctions had only a minor effect on our estimates of b0.
Figures 6–9 were generated using the communities in figure 2. We used the final distribution of microbes (those displayed) and ignored communities which collapsed. To test whether sites that were favourable to the cross-feeders were also favourable to the cheater (figure 6), we correlated B0x with B1x and with B2x across each site. Figure 6 shows the mean of these two correlations. Results were similar for the correlation between B0x and 1/2 (B1x + B2x), though the correlations were higher. To test whether microbes were more likely to be in favourable spots (figure 7), we calculated the mean of probability of reproduction in sites where the microbe could be found and compared to its probability of reproduction averaged across all sites [47]. To determine how much the cheater was harmed because the resources were in different areas (figure 8), we calculated the mean of min(R1x, R2x) across all sites and divided this by the mean of R1x and R2x across all sites. The denominator here represented the mean-field level of resource levels, and thus the ratio shows how much variation in resources harms the cheater. To test the effect of spatial structure (figure 9), we randomly reorganized each of the communities. After reorganization, we tested how much the cheater's mean probability of reproduction (B0x averaged across all sites) changed. Because B1x and B2x are linear functions of species 2 and 1 densities, mean values of B1x and B2x did not change when the microbes were reorganized.
Data accessibility
Code and data available at the Dryad Digital Repository (http://dx.doi.org/10.5061/dryad.s1v3801) [46].
Authors' contributions
C.A.K. conceived the research. S.M.S. and C.A.K. developed the model. E.K.J. and S.M.S. wrote code and performed simulations. S.M.S. performed mathematical analysis in the supplementary material. All authors contributed to writing the manuscript.
Competing Interests
We declare we have no competing interests.
Funding
Our work was funded by the Defense Advanced Research Projects Agency (DARPA) through the Biological Robustness in Complex Systems (BRICS) programme.
References
- 1.Bronstein JL. 2001. The exploitation of mutualisms. Ecol. Lett. 4, 277–287. ( 10.1046/j.1461-0248.2001.00218.x) [DOI] [Google Scholar]
- 2.Bertrand EM, et al. 2015. Phytoplankton–bacterial interactions mediate micronutrient colimitation at the coastal Antarctic sea ice edge. Proc. Natl Acad. Sci. USA 112, 9938–9943. ( 10.1073/pnas.1501615112) [DOI] [PMC free article] [PubMed] [Google Scholar]
- 3.Rivière A, Gagnon M, Weckx S, Roy D, De Vuyst L. 2015. Mutual cross-feeding interactions between Bifidobacterium longum subsp. longum NCC2705 and Eubacterium rectale ATCC 33656 explain the bifidogenic and butyrogenic effects of arabinoxylan oligosaccharides. Appl. Environ. Microbiol. 81, 7767–7781. ( 10.1128/AEM.02089-15) [DOI] [PMC free article] [PubMed] [Google Scholar]
- 4.Kwong WK, Engel P, Koch H, Moran NA. 2014. Genomics and host specialization of honey bee and bumble bee gut symbionts. Proc. Natl Acad. Sci. USA 111, 11 509–11 514. ( 10.1073/pnas.1405838111) [DOI] [PMC free article] [PubMed] [Google Scholar]
- 5.Rosenthal AZ, Matson EG, Eldar A, Leadbetter JR. 2011. RNA-seq reveals cooperative metabolic interactions between two termite–gut spirochete species in co-culture. ISME J. 5, 1133–1142. ( 10.1038/ismej.2011.3) [DOI] [PMC free article] [PubMed] [Google Scholar]
- 6.Steidinger BS, Bever JD. 2014. The coexistence of hosts with different abilities to discriminate against cheater partners: an evolutionary game-theory approach. Am. Nat. 183, 762–770. ( 10.1086/675859) [DOI] [PubMed] [Google Scholar]
- 7.Foster KR, Kokko H. 2006. Cheating can stabilize cooperation in mutualisms. Proc. R. Soc. B 273, 2233–2239. ( 10.1098/rspb.2006.3571) [DOI] [PMC free article] [PubMed] [Google Scholar]
- 8.Wilson WG, Morris WF, Bronstein JL. 2003. Coexistence of mutualists and exploiters on spatial landscapes. Ecol. Monogr. 73, 397–413. ( 10.1890/02-0297) [DOI] [Google Scholar]
- 9.Yamamura N, Higashi M, Behera N, Wakano JY. 2004. Evolution of mutualism through spatial effects. J. Theor. Biol. 226, 421–428. ( 10.1016/j.jtbi.2003.09.016) [DOI] [PubMed] [Google Scholar]
- 10.Akashi H, Gojobori T. 2002. Metabolic efficiency and amino acid composition in the proteomes of Escherichia coli and Bacillus subtilis . Proc. Natl Acad. Sci. USA 99, 3695–3700. ( 10.1073/pnas.062526999) [DOI] [PMC free article] [PubMed] [Google Scholar]
- 11.Morris JJ. 2015. Black queen evolution: the role of leakiness in structuring microbial communities. Trends Genet. 31, 475–482. ( 10.1016/j.tig.2015.05.004) [DOI] [PubMed] [Google Scholar]
- 12.West SA, Griffin AS, Gardner A, Diggle SP. 2006. Social evolution theory for microorganisms. Nat. Rev. Microbiol. 4, 597–607. ( 10.1038/nrmicro1461) [DOI] [PubMed] [Google Scholar]
- 13.Boyle RA, Williams HTP, Lenton TM. 2012. Natural selection for costly nutrient recycling in simulated microbial metacommunities. J. Theor. Biol. 312, 1–12. ( 10.1016/j.jtbi.2012.07.018) [DOI] [PubMed] [Google Scholar]
- 14.Oliveira NM, Niehus R, Foster KR. 2014. Evolutionary limits to cooperation in microbial communities. Proc. Natl Acad. Sci. USA 111, 17 941–17 946. ( 10.1073/pnas.1412673111) [DOI] [PMC free article] [PubMed] [Google Scholar]
- 15.Jeffrey Morris J, Papoulis SE, Lenski RE. 2014. Coexistence of evolving bacteria stabilized by a shared black queen function. Evolution 68, 2960–2971. ( 10.1111/evo.12485) [DOI] [PubMed] [Google Scholar]
- 16.Klayman BJ, Volden PA, Stewart PS, Camper AK. 2009. Escherichia coli 0157:H7 requires colonizing partner to adhere and persist in a capillary flow cell. Environ. Sci. Technol. 43, 2105–2111. ( 10.1021/es802218q) [DOI] [PubMed] [Google Scholar]
- 17.Cordero OX, Ventouras L-A, DeLong EF, Polz MF. 2012. Public good dynamics drive evolution of iron acquisition strategies in natural bacterioplankton populations. Proc. Natl Acad. Sci. USA 109, 20 059–20 064. ( 10.1073/pnas.1213344109) [DOI] [PMC free article] [PubMed] [Google Scholar]
- 18.Escalante AE, Rebolleda-Gomez M, Benitez M, Travisano M. 2015. Ecological perspectives on synthetic biology: insights from microbial population biology. Front. Microbiol. 6, 1–10. ( 10.3389/fmicb.2015.00143) [DOI] [PMC free article] [PubMed] [Google Scholar]
- 19.Nowak MA. 2006. Five rules for the evolution of cooperation. Science 314, 1560–1563. ( 10.1126/science.1133755) [DOI] [PMC free article] [PubMed] [Google Scholar]
- 20.Smith CA, Wilson WG. 2007. Evolutionary stable dispersal with pattern formation in a mutualist–antagonist system. Evol. Ecol. Res. 9, 987–1004. [Google Scholar]
- 21.Allison SD. 2005. Cheaters, diffusion and nutrients constrain decomposition by microbial enzymes in spatially structured environments. Ecol. Lett. 8, 626–635. ( 10.1111/j.1461-0248.2005.00756.x) [DOI] [Google Scholar]
- 22.Nadell CD, Foster KR, Xavier JB. 2010. Emergence of spatial structure in cell groups and the evolution of cooperation. PLoS Comput. Biol. 6, 9 ( 10.1371/journal.pcbi.1000716) [DOI] [PMC free article] [PubMed] [Google Scholar]
- 23.Momeni B, Waite AJ, Shou W. 2013. Spatial self-organization favors heterotypic cooperation over cheating. Elife 2, e00960 ( 10.7554/eLife.00960) [DOI] [PMC free article] [PubMed] [Google Scholar]
- 24.Wilson DS, Sober E. 1994. Reintroducing group selection to the human behavioral sciences. Behav. Brain Sci. 17, 585–608. ( 10.1017/S0140525X00036104) [DOI] [Google Scholar]
- 25.Mee MT, Wang HH. 2012. Engineering ecosystems and synthetic ecologies. Mol. Biosyst. 8, 2470–2483. ( 10.1039/c2mb25133g) [DOI] [PMC free article] [PubMed] [Google Scholar]
- 26.Brenner K, You LC, Arnold FH. 2008. Engineering microbial consortia: a new frontier in synthetic biology. Trends Biotechnol. 26, 483–489. ( 10.1016/j.tibtech.2008.05.004) [DOI] [PubMed] [Google Scholar]
- 27.Mee MT, Collins JJ, Church GM, Wang HH. 2014. Syntrophic exchange in synthetic microbial communities. Proc. Natl Acad. Sci. USA 111, E2149–E2156. ( 10.1073/pnas.1405641111) [DOI] [PMC free article] [PubMed] [Google Scholar]
- 28.Wintermute EH, Silver PA. 2010. Dynamics in the mixed microbial concourse. Genes Dev. 24, 2603–2614. ( 10.1101/gad.1985210) [DOI] [PMC free article] [PubMed] [Google Scholar]
- 29.Shou W, Ram S, Vilar JMG. 2007. Synthetic cooperation in engineered yeast populations. Proc. Natl Acad. Sci. USA 104, 1877–1882. ( 10.1073/pnas.0610575104) [DOI] [PMC free article] [PubMed] [Google Scholar]
- 30.Kim HJ, Boedicker JQ, Choi JW, Ismagilov RF. 2008. Defined spatial structure stabilizes a synthetic multispecies bacterial community. Proc. Natl Acad. Sci. USA 105, 18 188–18 193. ( 10.1073/pnas.0807935105) [DOI] [PMC free article] [PubMed] [Google Scholar]
- 31.Travisano M, Velicer GJ. 2004. Strategies of microbial cheater control. Trends Microbiol. 12, 72–78. ( 10.1016/j.tim.2003.12.009) [DOI] [PubMed] [Google Scholar]
- 32.Brenner K, Karig DK, Weiss R, Arnold FH. 2007. Engineered bidirectional communication mediates a consensus in a microbial biofilm consortium. Proc. Natl Acad. Sci. USA 104, 17 300–17 304. ( 10.1073/pnas.0704256104) [DOI] [PMC free article] [PubMed] [Google Scholar]
- 33.Durrett R, Levin SA. 1994. Stochastic spatial models: a user’s guide to ecological applications. Phil. Trans. R. Soc. Lond. B 343, 329–350. ( 10.1098/rstb.1994.0028) [DOI] [Google Scholar]
- 34.Von Liebig J. 1840. Die organische chemie in ihre anwendung auf agricultur und physiologie. Braunschweig, Germany: F. Vieweg und Sohn. [Google Scholar]
- 35.Harpole WS, et al. 2011. Nutrient co-limitation of primary producer communities. Ecol. Lett. 14, 852–862. ( 10.1111/j.1461-0248.2011.01651.x) [DOI] [PubMed] [Google Scholar]
- 36.Armstrong RA. 1987. A patch model of mutualism. J. Theor. Biol. 125, 243–246. ( 10.1016/S0022-5193(87)80045-0) [DOI] [Google Scholar]
- 37.Nisbet RM, Gurney WSC. 1982. Modelling fluctuating populations. Caldwell, NJ: The Blackburn Press. [Google Scholar]
- 38.Turing AM. 1952. The chemical basis of morphogenesis. Phil. Trans. R. Soc. Lond. B 237, 37–72. ( 10.1098/rstb.1952.0012) [DOI] [PMC free article] [PubMed] [Google Scholar]
- 39.Durrett R, Levin S. 1994. The importance of being discrete (and spatial). Theor. Popul. Biol. 46, 363–394. ( 10.1006/tpbi.1994.1032) [DOI] [Google Scholar]
- 40.Driscoll WW, Pepper JW. 2010. Theory for the evolution of diffusible external goods. Evolution 64, 2682–2687. ( 10.1111/j.1558-5646.2010.01002.x) [DOI] [PubMed] [Google Scholar]
- 41.Dobay A, Bagheri HC, Messina A, Kümmerli R, Rankin DJ. 2014. Interaction effects of cell diffusion, cell density and public goods properties on the evolution of cooperation in digital microbes. J. Evol. Biol. 27, 1869–1877. ( 10.1111/jeb.12437) [DOI] [PubMed] [Google Scholar]
- 42.Nadell CD, Drescher K, Foster KR. 2016. Spatial structure, cooperation and competition in biofilms. Nat. Rev. Microbiol. 14, 589–600. ( 10.1038/nrmicro.2016.84) [DOI] [PubMed] [Google Scholar]
- 43.Archetti M, Scheuring I, Hoffman M, Frederickson ME, Pierce NE, Yu DW. 2011. Economic game theory for mutualism and cooperation. Ecol. Lett. 14, 1300–1312. ( 10.1111/j.1461-0248.2011.01697.x) [DOI] [PubMed] [Google Scholar]
- 44.Goers L, Freemont P, Polizzi KM. 2014. Co-culture systems and technologies: taking synthetic biology to the next level. J. R. Soc. Interface 11, 20140065 ( 10.1098/rsif.2014.0065) [DOI] [PMC free article] [PubMed] [Google Scholar]
- 45.Park J, Kerner A, Burns MA, Lin XN. 2011. Microdroplet-enabled highly parallel co-cultivation of microbial communities. PLoS ONE 6, 317019 ( 10.1371/journal.pone.0017019) [DOI] [PMC free article] [PubMed] [Google Scholar]
- 46.Stump SM, Johnson EC, Klausmeier CA. 2018. Data from: Local interactions and self-organized spatial patterns stabilize microbial cross-feeding against cheaters Dryad Digital Repository. ( 10.5061/dryad.s1v3801) [DOI] [PMC free article] [PubMed]
- 47.Stump SM, Chesson P. 2015. Distance-responsive predation is not necessary for the Janzen–Connell hypothesis. Theor. Popul. Biol. 106, 60–70. ( 10.1016/j.tpb.2015.10.006) [DOI] [PubMed] [Google Scholar]
Associated Data
This section collects any data citations, data availability statements, or supplementary materials included in this article.
Data Citations
- Stump SM, Johnson EC, Klausmeier CA. 2018. Data from: Local interactions and self-organized spatial patterns stabilize microbial cross-feeding against cheaters Dryad Digital Repository. ( 10.5061/dryad.s1v3801) [DOI] [PMC free article] [PubMed]
Data Availability Statement
Code and data available at the Dryad Digital Repository (http://dx.doi.org/10.5061/dryad.s1v3801) [46].


