Abstract
Microfluidic devices are versatile tools for studying transport processes at a microscopic scale. A demand exists for microfluidic devices that are resistant to low molecular-weight oil components, unlike traditional polydimethylsiloxane (PDMS) devices. Here, we demonstrate a facile method for making a device with this property, and we use the product of this protocol for examining the pore-scale mechanisms by which foam recovers crude oil. A pattern is first designed using computer-aided design (CAD) software and printed on a transparency with a high-resolution printer. This pattern is then transferred to a photoresist via a lithography procedure. PDMS is cast on the pattern, cured in an oven, and removed to obtain a mold. A thiol-ene crosslinking polymer, commonly used as an optical adhesive (OA), is then poured onto the mold and cured under UV light. The PDMS mold is peeled away from the optical adhesive cast. A glass substrate is then prepared, and the two halves of the device are bonded together. Optical adhesive-based devices are more robust than traditional PDMS microfluidic devices. The epoxy structure is resistant to swelling by many organic solvents, which opens new possibilities for experiments involving light organic liquids. Additionally, the surface wettability behavior of these devices is more stable than that of PDMS. The construction of optical adhesive microfluidic devices is simple, yet requires incrementally more effort than the making of PDMS-based devices. Also, though optical adhesive devices are stable in organic liquids, they may exhibit reduced bond-strength after a long time. Optical adhesive microfluidic devices can be made in geometries that act as 2-D micromodels for porous media. These devices are applied in the study of oil displacement to improve our understanding of the pore-scale mechanisms involved in enhanced oil recovery and aquifer remediation.
Keywords: Environmental Sciences, Issue 131, Microfluidics, oil recovery, multi-phase flow, porous media, optical adhesive, pore-scale, pore-level, rapid prototyping
Introduction
The purpose of this method is to visualize and analyze multi-phase, multi-component fluid interactions and complex pore-scale dynamics in porous media. Fluid flow and transport in porous media have been of interest for many years because these systems are applicable to several subsurface processes such as oil recovery, aquifer remediation, and hydraulic fracturing1,2,3,4,5. Using micromodels to mimic these complex pore-structures, unique insights are gained by visualizing pore-level dynamic events between the different fluid phases and the media6,7,8,9,10,11.
The fabrication of traditional silica-based micromodels is expensive, time consuming, and challenging, yet constructing micromodels from optical adhesive offers a relatively inexpensive, fast, and easy alternative12,13,14,15. Compared with other polymer-based micromodels, optical adhesive exhibits more stable surface wetting properties. For example, polydimethylsiloxane (PDMS) micromodel surfaces will quickly become hydrophobic during the course of a typical displacement experiment16. Furthermore, the Young's modulus of PDMS is 2.5 MPa whereas that of optical adhesive is 325 MPa13,17,18. Thus, optical adhesive is less prone to pressure induced deformation and channel failure. Importantly, cured optical adhesive is much more resistant to swelling by low molecular weight organic components, which allows experiments involving crude oil and light solvents to be conducted18. Overall, optical adhesive is a superior alternative to PDMS for displacement studies involving crude oil when silica-based micromodels are prohibitively complex or expensive and high temperature and pressure studies are not required.
The protocol described in this publication provides the step-by-step fabrication instructions for optical adhesive micromodels and reports the subtle tricks that ensure success in the manipulation of small quantities of fluids. The design and fabrication of optical adhesive based micromodels with soft lithography is first described. Then, the fluid displacement strategy is given for ultra-low flow rates that are commonly unattainable with mass flow controllers. Next, a representative experimental result is given as an example. This experiment reveals foam destabilization and propagation behavior in the presence of crude oil and heterogeneous porous media. Lastly, typical image processing and data analysis is reported.
The method provided here is appropriate for visualization applications involving multi-phase flow and interactions in confined microchannel spaces. Specifically, this method is optimized for characteristic micro-feature resolutions greater than 5 and less than 700 µm. Typical flow rates are on the order of 0.1 to 1 mL/h. In studies of crude oil or light solvent displacement by aqueous or gaseous fluids on the order of these optimized parameters at ambient conditions, this protocol should be appropriate.
Protocol
Caution: This protocol involves handling a high temperature oven, toxic chemicals, and UV light. Please read all the material safety data sheets carefully and follow your institution's chemical safety guidelines.
1. Device Design
- Design a photomask in a CAD software application.
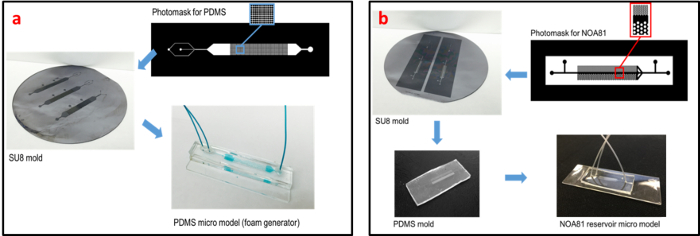
- Draw a rectangular channel that is 3 cm long and 0.5 cm wide (Figure 1b-top right).
- Create an array of enclosed shapes representing the grains of the porous media. NOTE: These shapes are referred to as posts because they will become three-dimensional structures during the soft lithography process. The shape and size of the posts should be on the order of tens of microns, and have a spacing of ten to one hundred microns. Multiple post sizes may be employed to create heterogeneity, and a section can be left bare of posts to simulate a fracture in the media.
- Draw inlet and outlet channels that are approximately one-third as wide as the porous media section. Draw a channel stemming from the inlet port to act as a drain.
- Draw a bounding box around the entire design with a minimum of 1.0 cm of clearance from the design. NOTE: The area between the bounding box and the borders of the design, as well as the posts, are to be made transparent on the photomask.
Submit the CAD file to a company for high-resolution CAD printing NOTE: Optional: For a foam displacement experiment, design a microfluidic foam generator (Figure 1a). Repeat step 1, omitting the design heterogeneity and bounding box. A flow-focusing geometry is recommended at the inlet before the porous media design. The flow spaces should be transparent on the photomask.
2. PDMS Mold Fabrication
- Create a photoresist-patterned silicon wafer master mold in a clean room
- Spin-coat a 20 µm layer of photoresist onto a new silicon wafer at 2,000 rpm for 30 s.
- Soft bake the wafer on a hot plate in two increments: 65 °C for 1 min followed by 95 °C for 3 min.
- Use a mask aligner to pattern the photoresist layer with the CAD design using a constant dosage of 150 mJ/cm2.
- Perform a post-exposure bake on a hot plate in two increments: 65 °C for 1 min followed by 95 °C for 3 min. Allow the wafer to cool for 5 min.
- Immerse the wafer in 100 mL of propylene-glycol-methyl-ether-acetate in a glass crystallization dish. Gently agitate by hand for 10 min to develop the photoresist pattern. Rinse it with isopropanol and dry the wafer under a stream of dry air.
- Hard bake the wafer on a hot plate in two increments: 120 °C for 5 min followed by 150 °C for 10 min. Allow the wafer to cool for 15 min.
- Cast PDMS onto the silicon wafer master mold
- Mix a total of 30 g of the PDMS elastomer and curing agent in a 5:1 ratio inside a dust-free disposable container.
- Degas the PDMS in a vacuum desiccator for 30 min.
- Pour the PDMS onto the photoresist-patterned silicon wafer master mold in a 150 mm glass Petri dish.
- Place the Petri dish containing the wafer and PDMS in an 80 °C oven for 1 h.
- Remove the Petri dish from the oven and allow the contents to reach room temperature. NOTE: The procedure may be paused at this point.
- Prepare the PDMS mold for pattern transfer to optical adhesive
- Carefully cut the PDMS mold out using a scalpel, and peel the mold away from the wafer.
- Clean and protect the PDMS mold using clear adhesive tape. NOTE: The procedure may be paused at this point.
- Place the PDMS mold, pattern-side up, in the bottom of a dust-free 60 mm plastic Petri dish. Allow 10 s for the PDMS to stick to the plastic.
- Protect the surface of the PDMS with clear plastic tape until step 3.1.1. NOTE: Optional: To make the foam generator, repeat steps 2.1. through 2.3.2. for the foam-generator design.
3. Optical Adhesive Device Fabrication
- Cast optical adhesive onto the PDMS mold
- Remove the tape from the patterned surface of the PDMS, and pour optical adhesive into the 150 mm Petri dish to a depth of approximately 0.9 cm above the top surface of the PDMS mold. Gently remove any bubbles with any type of cotton swab.
- Cure the optical adhesive under UV light for a total of 40 min as outlined in steps 3.2.1 - 3.2.5 in a PSD-UV system. Caution: Wear appropriate protection when working with UV light.
- Expose the Petri dish to UV light (254 nm) for 5 min.
- Invert the Petri dish such that the bottom is now facing the UV source, and expose the under-side to UV light for 5 min.
- Invert the Petri dish, return it to the upright position, and re-expose the top side to UV light for 5 min.
- Invert the Petri dish upside down again, and re-expose the bottom side to UV light for 10 min.
- Invert the Petri dish back to the upright position, and re-expose the top side to UV light for 15 min. NOTE: The curing procedure in steps 3.2.1 through 3.2.5 is only applicable when the specified PSD-UV apparatus is used (Table of Materials). Cure times will vary depending on the specific lamp that is used and on the exact thickness of the optical adhesive layer.
- Remove the cured optical adhesive from the PDMS mold
- Use a box cutter to carefully break the optical adhesive out of the Petri dish mold. Caution: Box cutter blades are very sharp and can easily cut flesh. Be careful when working around the sharp edges of broken Petri dishes.
- Use a sturdy pair of scissors to remove excess optical adhesive from the edge of the design.
- Slowly peel the PDMS mold away from the optical adhesive puck. Protect the patterned portions of the optical adhesive surface and the PDMS surface with clear tape.
- Use a 1.0 mm biopsy punch to create inlet, outlet, and drain holes. Protect the patterned optical adhesive with clear tape.
- Prepare the substrate
- Dispense 1 mL of optical adhesive onto a new glass slide, and spin-coat the slide in two steps: 500 rpm for 5 s then 4,000 rpm for 20 s.
- Quickly transfer the substrate to the UV light treatment, and partially cure the thin optical adhesive layer under UV light for 30 s.
- Bond the optical adhesive cast to the substrate
- Place the optical adhesive cast, patterned side up, and the substrate, coated-side up, in an O2 plasma cleaner. Plasma clean the surface for 20 s at 540 mTorr.
- Firmly press the two treated surfaces together until all undesired air pockets have been minimized or removed.
- Fully cure the device under UV light for 20 min. Caution: For UV light, wear appropriate protection such as protective glasses, lab coat, gloves, etc.
- Place the device on a hot plate at 50 °C for 18 h.
Insert a 6-inch long segment of 0.58 mm ID low density polyethylene tubing (PE/3) into each of the ports on the device.
Use a 5 min quick-set epoxy to secure the tubing in place. NOTE: Optional: To complete the foam generator, repeat steps 3.5.1, 3.5.2, 3.6, and 3.7. using the foam-generator PDMS cast and a new glass slide, instead of the optical adhesive cast and prepared substrates, respectively.
4. Oil Displacement Experiment
Prepare the microfluidic device to be imaged on an inverted microscope equipped with a high-speed camera. Fix the device to the microscope stage using tape. Using a 4X objective, focus on the area of interest (AOI).
- Prepare the injection fluids NOTE: For three-phase systems, a dye should be added to clear displacing fluids to provide color contrast for image analysis.
- Load 3 mL of crude oil or model oil sample into a 10 mL glass syringe equipped with a 23 gauge industrial dispensing tip. Secure the syringe in the syringe pump holder and set the appropriate diameter value on the syringe pump settings.
- Load 1 mL of the displacing fluid into a 3 mL plastic syringe equipped with a 23 gauge industrial dispensing tip. Secure the syringe in the syringe pump holder and set the appropriate diameter value on the syringe pump settings. NOTE: Optional: For foam generation experiments, connect a 10 m long 25 µm diameter glass capillary tube to an N2 gas tank and set the gas pressure to the desired value for the required gas flow rate as obtained from a calibration curve. Allow 10 min for the gas flow to equilibrate.
- Saturate the OPTICAL ADHESIVE model porous media device with oil
- Connect the displacing fluid to the inlet of the device by inserting the needle tip into the PE/3 tubing. NOTE: Optional: When foam is used as the displacing phase, connect the displacing fluid syringe to the inlet of the foam generator. Connect the gas capillary to the second inlet port on the foam generator by inserting the capillary tube into a 23-gauge industrial dispensing tip and sealing the annulus with quick-set epoxy. The outlet of the foam generator is then connected to the inlet of the optical adhesive device using a 23-gauge connector.
- Connect the oil-filled syringe to the inlet of the device by inserting the needle tip into the PE/3 tubing.
- Begin flowing the oil into the outlet port of the OPTICAL ADHESIVE device at 2 mL/h while simultaneously flowing the displacing fluid into the inlet port at 0.8 mL/h such that the two fluids both flow out the drain port. The displacing fluid should not enter the porous media. Collect the effluent in a 20 mL glass vial.
Begin filming the AOI on the porous media device at a frame rate fast enough to capture the desired phenomena. A typical frame rate is 50 fps. Capture a still image of the 100% oil-saturated area.
Swiftly and simultaneously cut the PE/3 tubing that is flowing in the oil using scissors while clamping the drain tube with a 5 cm binder clamp.
Allow the displacing fluid to invade the device until either the oil displacement reaches steady-state or the camera runs out of memory.
5. Image and Data Analysis
- Use a free image analysis software such as Image J or use the image analysis toolbox in MATLAB to analyze the footage from the experiment.
- Using the still image of the 100% oil-saturated channel, calculate the porosity in units of percent for the porous media AOI.
Calculate the pore volume using the following equation:

Use image analysis software to determine the oil saturation, as a fraction of the total flow space, in each frame of the video footage from the experiment. For two phase displacement experiments, the displacing phase saturation in each frame may be calculated as:

Prepare a plot of oil saturation in percent vs. pore volumes of injected fluid NOTE: Optional: For three phase systems such as those of foam displacement experiments, use the MATLAB image analysis toolbox to categorize each displacing phase by color using the characteristic RGB range for each phase. Prepare a plot showing the saturations of all three phases with injected pore volumes.
Representative Results
In this example experiment, aqueous foam is used to displace Middle East crude oil (with a viscosity of 5.4 cP and API gravity of 40°) in a heterogeneous porous media with layered permeability contrast. A PDMS foam generator is connected to an optical adhesive micromodel which was previously completely saturated with crude oil. Figure 1a shows the CAD design of the photomask for the PDMS foam generator, the photoresist-patterned silicon wafer, and the completed foam generator with inlet and outlet tubes inserted. Figure 1b shows corresponding images for the heterogeneous optical adhesive model porous media with layered permeability contrast. Note the respective transparent and opaque portions of the photomask design. As shown in Figure 2, coarse foam is generated by a flow-focusing geometry into which gas and liquid are co-injected. The total flow rate selected for this demonstration is 0.8 mL/h with a nitrogen gas fractional flow of approximately 90%. The surfactant solution used is a 1:1 ratio of alpha olefin sulfonate C14-16 to lauryl betaine at a concentration of 1 wt%. A 1 wt% concentration of blue food grade dye is used in the aqueous phase to aid in distinguishing this phase from the device posts. A finer foam texture is produced as foam from the flow-focusing section propagated through the homogeneous foam-generator micromodel. Smaller bubbles are typically observed exiting the patterned matrix than those that are made by the flow-focusing geometry alone. Once steady foam generation is achieved, foam flow is then diverted to the optical adhesive micromodel to displace crude oil. Videos of the displacement process were captured at 50 fps by a high-speed camera, which allowed for frame by frame processing of the footage. In Figure 3, saturation profiles for each fluid phase were plotted as a function of total injected fluid pore volumes.
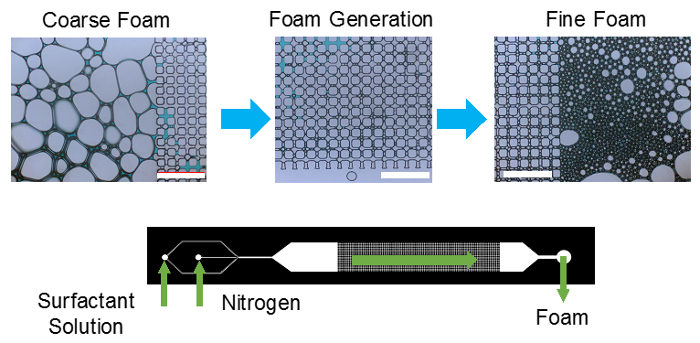
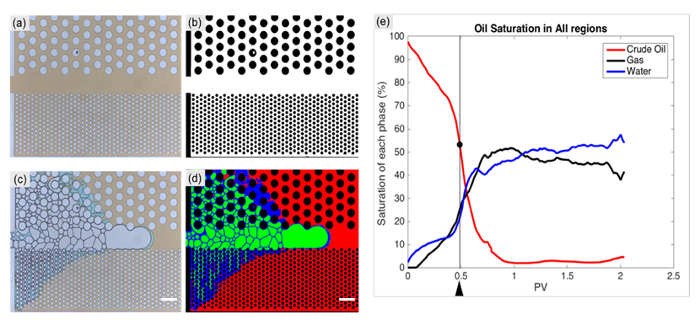
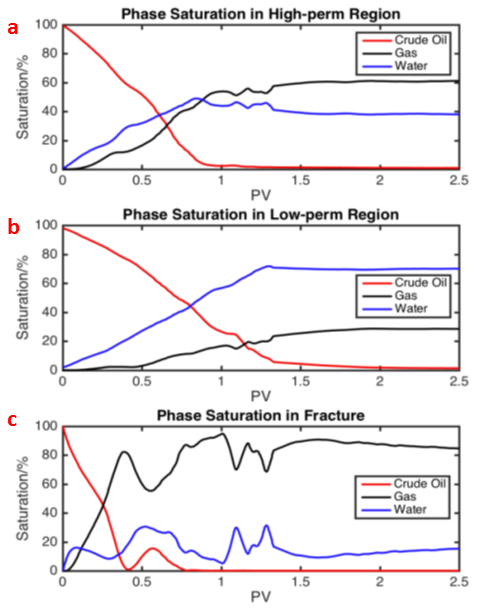
Image processing techniques also enable us to quantify the fluid diversion and foam phase separation in different layers. Capillary forces between different phases will drive more of the liquid to the lower permeability region and more of the gas to the higher permeability region. Figure 4 shows the saturation changes that occurred during the crude oil displacement experiment as a function of total injected fluid pore volumes. As predicted, at steady state, gas saturation was significantly higher in the high-permeability region compared to that in the low-permeability region.
In addition to analyzing the saturation change during the oil displacement experiment, a series of pore-level events such as foam destabilization, bubble generation, oil lamellae formation, and crude oil emulsification could also be easily identified. In Figure 5, some of these foam dynamics in presence of crude oil are shown. In this figure, the bubbles of interest are colored green. Foam is thermodynamically metastable and coalesces in porous media by mechanisms such as capillary suction (Figure 5c), gas diffusion (Figure 5e), thermal, or mechanical fluctuations. Crude oil also has a detrimental effect on foam (Figure 5b and Figure5d). The success of foam flooding depends on various mechanisms for bubble regeneration. We identify in-situ foam generation mechanisms like bubble pinch-off (Figure 5a) and lamella division (Figure 5f).
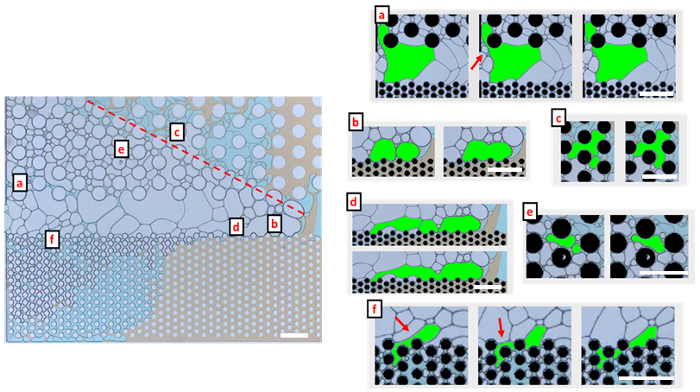
Figure 1: The fabrication of porous media micromodel devices.(a) PDMS-based Foam Generator: the CAD design, the photoresist mold on a silica wafer, and the completed device; (b) Optical adhesive-based heterogeneous porous media micromodel with layered permeability contrast: the CAD design, the photoresist mold, the PDMS mold, and the completed device. The scale bars indicate approximately one inch. Please click here to view a larger version of this figure.
Figure 2: Foam generation in the PDMS based homogeneous micromodel. Coarse foam is generated through the flow focusing device which becomes finer as foam passes through the device. The scale bar indicates 1 mm. Please click here to view a larger version of this figure.
Figure 3: Characterizing crude oil displacement by foam.(a) Initial condition: 100% oil saturation (crude oil in brown, posts in white); (b) binary background image for the micromodel; (c) a sample frame from the crude oil displacement video; (d) converted image after Matlab processing to distinguish distinct phases where green = gas, blue = aqueous phase, red = oil phase; (e) saturation history (Black arrow indicates the time when (c) was taken). The scale bar indicates 400 µm. Please click here to view a larger version of this figure.
Figure 4: Saturation history at different regions to show fluid diversion and foam phase separation.(a) high permeability region; (b) low permeability region; (c) fracture region. The label on the vertical axes stands for saturation of each phase (%).
Figure 5: Foam dynamics in the presence of crude oil.(a) Foam generation by bubble pinch-off mechanism; (b) bubble coalescence in presence of crude oil; (c) bubble coalescence by capillary suction; (d) foam destruction in the fracture region; (e) foam coarsening by gas diffusion; (f) foam generation by lamella-division. Gas bubbles of interest are colored green. The scale bar indicates 400 µm. Please click here to view a larger version of this figure.
Discussion
This protocol for studying oil recovery processes in optical adhesive micromodels strikes a balance between the robustness of non-polymeric micromodels – such as glass or silicon – and the facile fabrication of PDMS microfluidic devices. Unlike micromodels made of glass or optical adhesive, PDMS devices lack resistance to light organic species. PDMS micromodels are also not ideal for many experiments because the surfaces of these devices have unstable wetting properties, and the polymer matrix is permeable to gas19. In contrast, optical adhesive has shown much more stable wettability than PDMS, and it is much less permeable to gas20,21,22. Specifically, the water contact angle of optical adhesive remains stable for days after O2 plasma treatment, compared to hours for PDMS21. Therefore, with minimal extra effort, constructing micromodels of optical adhesive, rather than PDMS, grants better solvent resistance, more stable wetting properties, and lower permeability to gas. optical adhesive replaces neither glass nor silicon micromodels, however, as these materials can withstand much higher temperatures and pressures. Furthermore, optical adhesive microfluidic devices may exhibit bond degradation during long-term experiments14. Given the difficulty and expense of constructing glass and silicon micromodels, optical adhesive is still the material of choice for short-term ambient displacement experiments involving light organic substances. Therefore, employing optical adhesive micromodels for studying oil recovery processes with crude oil is a facile and cost-effective alternative to using labor-intensive glass and silicon micromodels.
Careful attention should be paid to several critical aspects of the photoresist-patterned silicon wafer master-mold preparation portion of the protocol to avoid unsuccessful results. First, best practice dictates ramping the temperatures slowly (5 °C per min) during all baking steps. Fast heating can cause thermal stress fractures in the wafer. Second, photoresist adhesion to the silicon wafer should be promoted as necessary. When using a new wafer, separation incidents should occur infrequently, but if separation of the cured photoresist from the wafer is a problem, then preventative measures can be taken. A quick isopropyl alcohol rinse followed by a pre-bake step at 110 °C for 10 min can result in better photoresist affinity for the surface of the wafer. Third, note that the parameters given in the procedure for UV dosage, baking times, baking temperatures, and developing times can be sensitive to changes in environmental conditions, instrument brand, and chemical batch number. Thus, resources should be allocated for several trials to tune these important parameters to eliminate issues such as over-polymerization, under-developed features, unresolved features, or poor adhesion to the wafer. Provided these tips are taken into consideration, silicon wafers should be successfully patterned with relative ease.
Later in the protocol, several nuances of the device fabrication and experimental steps of this procedure can contribute significantly to successful results. For example, the nonstandard PDMS component ratio offers a couple advantages. Commonly for PDMS cross-linking, a 10:1 elastomer to curing agent ratio is used; however, a 5:1 ratio allows for a tougher polymer that cures faster and can be reused more times. For the actual optical adhesive device preparation, one should note that the curing steps are all precisely tuned to avoid potential pitfalls. As such, partially curing the thin layer of optical adhesive on the substrate for the device is crucial for an extra strong bond to the cast portion. Furthermore, the optical adhesive is cured from both sides to ensure even curing throughout. If the optical adhesive has not fully cured, then the PDMS mold could be torn during removal from the cast. Conversely, if the optical adhesive is cured for too long, then the material becomes unfavorably tough. Over-cured epoxy can potentially break the punching tool used to make the port holes. If the cast is over-cured, the ports can be sand blasted or drilled with a 1 mm diameter drill bit on a drill press. Lastly, while conducting the displacement experiments, the displacing fluid should not be allowed to enter the micromodel before the crude oil. The wettability of the micro-channels is made initially oil-wet by first contacting the crude oil, but allowing components of the displacing fluid to alter the micromodel surfaces might change the performance of the displacement strategy. Following these steps carefully in the microfluidic device construction and displacement experiment will help ensure resources do not go to waste.
In the future, optical adhesive micromodels will continue to be a valuable tool for microfluidics research. These devices can serve as a robust screening platform for injection fluids tailored to specific crude oils. Additionally, these tools can be used to study fundamental mechanisms of oil recovery, mobility control, foam flow, or anaerobic microbial enhanced oil recovery (EOR) experiments. The cost effectiveness and favorable properties of optical adhesive micromodels naturally lend these tools an advantage in the microfluidic oil recovery field.
Disclosures
The authors have nothing to disclose.
Acknowledgments
We acknowledge the financial support from the Rice University Consortium for Processes in Porous Media (Houston, TX, USA).
References
- Blaker T, et al. Foam for Gas Mobility Control in the Snorre Field: The FAWAG Project. SPE Reserv Eval Eng. 2002;5(04):317–323. [Google Scholar]
- Mannhardt K, Svorstøl I. Effect of oil saturation on foam propagation in Snorre reservoir core. J Petrol Sci Eng. 1999;23(3-4):189–200. [Google Scholar]
- Falls AH, Lawson JB, Hirasaki GJ. The Role of Noncondensable Gas in Steam Foams. J Petrol Technol. 1988;40(01):95–104. [Google Scholar]
- Hirasaki GJ, Miller CA, Szafranski R, Lawson JB, Akiya N. Surfactant/Foam Process for Aquifer Remediation. Houston, Texas: International Symposium on Oilfield Chemistry; 1997. [Google Scholar]
- Lv Q, Li Z, Li B, Li S, Sun Q. Study of Nanoparticle-Surfactant-Stabilized Foam as a Fracturing Fluid. Ind Eng Chem Res. 2015;54(38):9468–9477. [Google Scholar]
- Conn CA, Ma K, Hirasaki GJ, Biswal SL. Visualizing oil displacement with foam in a microfluidic device with permeability contrast. Lab Chip. 2014;14(20):3968–3977. doi: 10.1039/c4lc00620h. [DOI] [PubMed] [Google Scholar]
- Ma K, Liontas R, Conn CA, Hirasaki GJ, Biswal SL. Visualization of improved sweep with foam in heterogeneous porous media using microfluidics. Soft Matter. 2012;8(41):10669. [Google Scholar]
- Anna SL, Bontoux N, Stone HA. Formation of dispersions using "flow focusing" in microchannels. Appl Phys Lett. 2003;82(3):364. [Google Scholar]
- Gauteplass J, Chaudhary K, Kovscek AR, Fernø MA. Pore-level foam generation and flow for mobility control in fractured systems. Colloid Surface A. 2015;468:184–192. [Google Scholar]
- Kovscek AR, Radke CJ. Gas bubble snap-off under pressure-driven flow in constricted noncircular capillaries. Colloid Surface A. 1996;117(1-2):55–76. [Google Scholar]
- Géraud B, Jones SA, Cantat I, Dollet B, Méheust Y. The flow of a foam in a two-dimensional porous medium: FOAM FLOW IN A 2-D POROUS MEDIUM. Water Resour Res. 2016;52(2):773–790. [Google Scholar]
- Lin Y-J, et al. Examining Asphaltene Solubility on Deposition in Model Porous Media. Langmuir. 2016;32(34):8729–8734. doi: 10.1021/acs.langmuir.6b02376. [DOI] [PubMed] [Google Scholar]
- Bartolo D, Degré G, Nghe P, Studer V. Microfluidic stickers. Lab Chip. 2008;8(2):274–279. doi: 10.1039/b712368j. [DOI] [PubMed] [Google Scholar]
- Kenzhekhanov S. Chemical EOR process visualization using NOA81 micromodels. 2017. Master's degree Thesis.
- Zhuang YG, et al. Proceedings of the 1st Thermal and Fluid Engineering Summer Conference. New York, NY, USA: 2016. Experimental Investigation of Asphaltene Deposition in a Transparent Microchannel. [Google Scholar]
- Ma K, Rivera J, Hirasaki GJ, Biswal SL. Wettability control and patterning of PDMS using UV-ozone and water immersion. J Colloid Interf Sci. 2011;363(1):371–378. doi: 10.1016/j.jcis.2011.07.036. [DOI] [PubMed] [Google Scholar]
- Duffy DC, McDonald JC, Schueller OJA, Whitesides GM. Rapid Prototyping of Microfluidic Systems in Poly(dimethylsiloxane) Anal Chem. 1998;70(23):4974–4984. doi: 10.1021/ac980656z. [DOI] [PubMed] [Google Scholar]
- Sollier E, Murray C, Maoddi P, Di Carlo D. Rapid prototyping polymers for microfluidic devices and high pressure injections. Lab Chip. 2011;11(22):3752. doi: 10.1039/c1lc20514e. [DOI] [PubMed] [Google Scholar]
- Lee JN, Park C, Whitesides GM. Solvent Compatibility of Poly(dimethylsiloxane)-Based Microfluidic Devices. Anal Chem. 2003;75(23):6544–6554. doi: 10.1021/ac0346712. [DOI] [PubMed] [Google Scholar]
- Silvestrini S, et al. Tailoring the wetting properties of thiolene microfluidic materials. Lab Chip. 2012;12(20):4041. doi: 10.1039/c2lc40651a. [DOI] [PubMed] [Google Scholar]
- Wägli P, Homsy A, de Rooij NF. Norland optical adhesive (NOA81) microchannels with adjustable wetting behavior and high chemical resistance against a range of mid-infrared-transparent organic solvents. Sensor Actuat B-Chem. 2011;156(2):994–1001. [Google Scholar]
- Hung L-H, Lin R, Lee AP. Rapid microfabrication of solvent-resistant biocompatible microfluidic devices. Lab Chip. 2008;8(6):983. doi: 10.1039/b717710k. [DOI] [PubMed] [Google Scholar]


