Abstract
The thermal scanning conductometry protocol is a new approach in studying ionic gels based on low molecular weight gelators. The method is designed to follow the dynamically changing state of the ionogels, and to deliver more information and details about the subtle change of conductive properties with an increase or decrease in the temperature. Moreover, the method allows the performance of long term (i.e. days, weeks) measurements at a constant temperature to investigate the stability and durability of the system and the aging effects. The main advantage of the TSC method over classical conductometry is the ability to perform measurements during the gelation process, which was impossible with the classical method due to temperature stabilization, which usually takes a long time before the individual measurement. It is a well-known fact that to obtain the physical gel phase, the cooling stage must be fast; moreover, depending on the cooling rate, different microstructures can be achieved. The TSC method can be performed with any cooling/heating rate that can be assured by the external temperature system. In our case, we can achieve linear temperature change rates between 0.1 and approximately 10 °C/min. The thermal scanning conductometry is designed to work in cycles, continuously changing between heating and cooling stages. Such an approach allows study of the reproducibility of the thermally reversible gel-sol phase transition. Moreover, it allows the performance of different experimental protocols on the same sample, which can be refreshed to initial state (if necessary) without removal from the measuring cell. Therefore, the measurements can be performed faster, in a more efficient way, and with much higher reproducibility and accuracy. Additionally, the TSC method can be also used as a tool to manufacture the ionogels with targeted properties, like microstructure, with an instant characterization of conductive properties.
Keywords: Environmental Sciences, Issue 131, Thermal scanning conductometry (TSC), low molecular weight gelator, solid electrolytes, physical gelation, ionic gels, sol-gel technique
Introduction
Thermally Reversible Ionogels Physical gelation is a process which allows the construction of structures of self-assembled gelator molecules in presence of the solvent molecules. Due to non-covalent nature of the interactions responsible for this phenomenon (e.g. hydrogen bonding, van der Waals interactions, dispersion forces, electrostatic forces, π-π stacking, etc.), these systems are thermally reversible. This thermal reversibility, together with the very low concentration of the gelator and the wide variety of the systems that can be created, are some of the main advantages of physical gels over chemical ones. Thanks to the unique properties of the physical gel state, the ionogels are characterized with desirable features like easy recycling, long cycle life, enhanced physical properties (e.g. ionic conductivity), ease of production, and lowering of the production costs. Taking into the account the above advantages of physical gels (which already have a wide range of different applications1,2,3,4), these were thought to be used as an alternative way for electrolyte solidification and obtaining of ionogels5,6,7,8. However, the classical conductometry was not sensitive and accurate enough to follow such dynamically changing systems. Therefore,it could not detect the phase transitions and enhanced dynamics of ions in the gel matrix9. The reason for this insensitivity was the time needed for the temperature stabilization, during which dynamic changes of the sample properties were underway before the measurement was started. Furthermore, the number of measured temperatures was limited in order, not to significantly extend the experimental time. Therefore, to fully and accurately characterize the ionogels, a new method was needed, which would be able to follow the dynamic changes of properties as a function of temperature, and record data continuously in real time. The way the gelation process is conducted determines the properties of the created ionogel. The intermolecular non-covalent interactions are defined during the cooling stage; by changing the gelation temperature and cooling rates, one can strongly influence those interactions. Therefore, it was extremely important to measure the system during cooling when the gelation takes place. With the classical approach, this was impossible due to temperature stabilization time for the measurement, and the fast cooling rates required for successful gelation. However, with the thermal scanning conductometry method this task is very simple, delivers accurate and reproducible results, and allows the investigation of the influence of different kinetics of thermal changes applied to the sample on sample properties10. As a result, the ionogels with targeted properties can be studied and manufactured at the same time.
Thermal Scanning Conductometry (TSC) The thermal scanning conductometry is supposed to deliver a reproducible, accurate, and fast responding experimental method for the conductivity measurement of dynamically changing and thermally reversible systems, like ionogels based on low molecular weight gelators. However, it can be also used with electrolytes, ionic liquids, and any other conducting sample that can be placed in the measuring cell and has conductivity in the measuring range of the sensor. Additionally, besides the research application, the method was successfully used to manufacture ionogels with targeted properties like microstructure, optical appearance or thermal stability, and phase transition temperature in an accurate and easy way. Depending on the kinetics and history of thermal treating with use of the TSC method, we gain full control over some basic properties of physical gel systems. Additionally the chamber have been equipped in a video camera to inspect the sample state and record the changes of the sample especially during gelation and dissolution processes. An additional advantage of the TSC method is its simplicity, as the system can be built from a standard conductometer, a programmable temperature controller, the gaseous nitrogen line for the heating/cooling medium, the refrigerator, measuring chamber, and a PC, which can be found in most laboratories.
The TSC Experimental Site The thermal scanning conductometry experimental setup can be built in almost every laboratory with relatively low costs. In return, one obtains an accurate, reproducible, and fast method for measuring liquid and semisolid conductive samples at different external conditions. A detailed scheme of the TSC experimental setup built in our laboratory is given in Figure 1.
Figure 1: Block diagram of the measurement site. The components consisting on working experimental setup for thermal scanning conductometry method. Please click here to view a larger version of this figure.
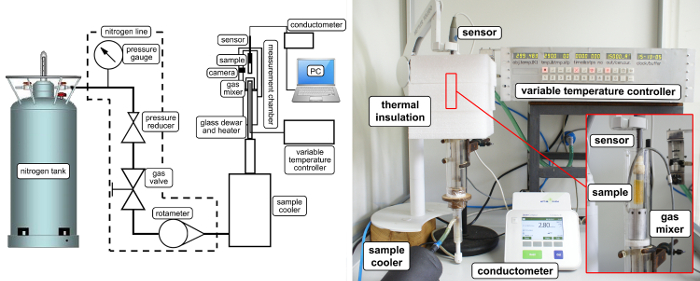
For the temperature change, a homemade temperature controller was used, but any kind of programmable temperature controller, which can change the temperature linearly with a defined change rate, can be used. For thermal isolation, a special chamber has been built. The purpose of using an isolation chamber is to minimize temperature horizontal gradients in the sample, and to assure fast cooling rates. The chamber consists of a glass cylinder with a 40-mm inner diameter and 300 mm length. At the bottom side, where the heater with gaseous nitrogen inlets are located, the end of the inlet is equipped with a diffusor to evenly spread the hot or cold gas. This is also the place where the temperature sensor PT100 of the variable temperature controller (VTC) is located. The temperature of the sample is recorded independently by the temperature sensor located in the conductivity sensor. Additionally, the chamber have been equipped in a video camera to inspect the sample state and record the changes of the sample especially during gelation and dissolution processes. The gaseous nitrogen obtained from evaporation of liquid nitrogen in the 250 L high pressure tank is used as a heating and cooling medium. The working pressure in the nitrogen line is set to 6 bars, and reduced to 2 bars at the measuring site. Such settings allow the obtainment of flow rates between 4 and 28 L/min without any disturbances, which allows a cooling rate of 10 °C/min. To lower the initial temperature of the nitrogen gas, the external refrigerator has been used, and the decreased temperature was 10 °C. This allows the obtainment of good linearity of the temperature change, starting from room temperature. During fast cooling, the temperature of the nitrogen gas is decreased to -15 °C to assist high cooling rates. It is necessary to use gaseous nitrogen, and not even dry air, to avoid icing the refrigerator because of low temperatures.
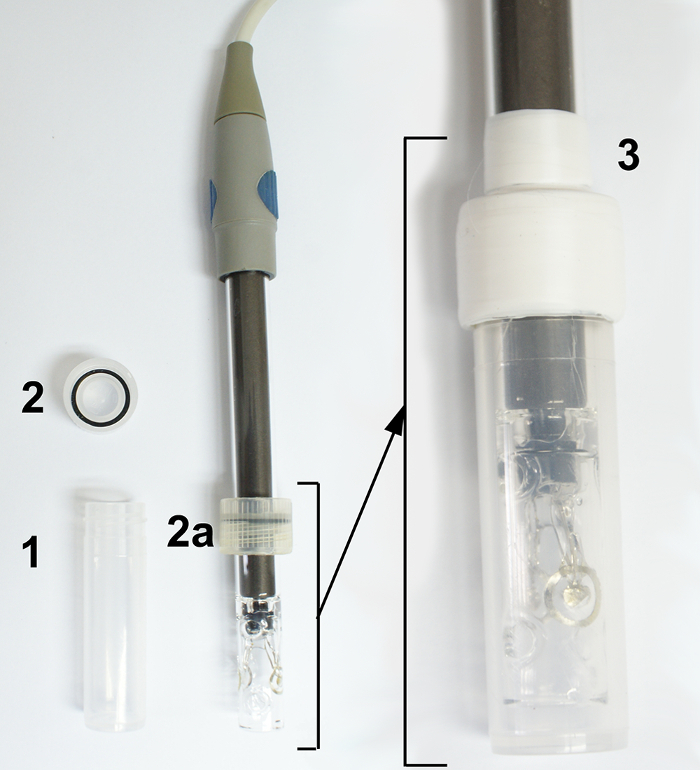
The samples were inserted into a vial of 9 mm inner diameter and length of 58 mm, made of polypropylene, and equipped with a screw cap, which has a rubber ring for tight closing. The vials can be used up to 120 °C. (see Figure 2).
Figure 2: The picture of a polypropylene vial and its mounting on the conductivity sensor. (1) the polypropylene vial, (2) the screw cap with rubber ring, 2a - the screw cap mounted on the conductivity sensor, (3) the vial with mounted conductivity sensor, the screw cap secured with Teflon tape. Please click here to view a larger version of this figure.
Protocol
1. Preparation of the Experimental Site for TSC Measurement
To measure the full characteristics of the TSC method, use the commercially available conductometer equipped with four electrode cells (alternatively, two electrode cells can be used for low conductivities) and a temperature sensor. Connect it to the PC and record the conductivity and temperature of the sample (4% wt% of methyl-4,6-O-(p-nitrobenzylidene)-α-D-glucopyranoside in 1 M molar concentration of tetraethylammonium bromide - TEABr in glycerol - Glyc used in studied case, see paragraph 3 for ionic gel sample preparation) along with computer time.
For automatic readouts, use the software supplied by the manufacturer along with the conductometer, and set the measuring mode to continuous with interval readings every 1 s.
Prepare the nitrogen line (fill the high-pressure nitrogen tank with liquid nitrogen and start to evaporate it to get gaseous nitrogen in the nitrogen line), and set the pressure to 2 bars and required flow, then decrease the initial temperature of the nitrogen gas with the aid of a refrigerator.
Tightly mount the screw cap of the vial on the conductive sensor, and secure it with a piece of teflon tape (crucial with volatile samples) (see Figure 2).
2. Preparation of Electrolyte Solution
Prepare the electrolytes by mixing an appropriate amount of glycerol, used as a solvent, and tetraethylammonium bromide (TEABr) (use scale to weigh the required amount of compounds accordingly for the concentration needed for investigation), used as a solute, in a glass vial tightly closed and heated at 100 °C for 15 min.
Next, stir the mixture for 1 min and heat it again at 100 °C for 5 min to ensure that all the solute is dissolved and the mixture is homogeneous.
Use these prepared electrolyte solutions for measurements, and afterwards for preparation of ionogels.
3. Preparation of Low Molecular Weight Ionic Gels
Prepare the ionogels from the electrolyte solutions (see section 2) by adding 178.6 mg of the low molecular weight gelator to 4 mL of 1 M TEABr/Glyc electrolyte solution to obtain 4% wt% of ionic gel sample. NOTE: The chemical synthesis of the used gelator was described elsewhere11.
To dissolve the gelator, add it to the glass vial with the electrolyte solution and heat it at 130 °C for 20 min with additional stirring to assist dissolution.
After completely dissolving the gelator, heat the mixture for an additional 5 min to ensure the sample is homogenous.
Next, quickly cool down the sample in a dry cooling block at 10 °C to ensure physical gelation. After the procedure, a homogeneous, transparent, or opaque gel phase should be obtained (Figure 3). NOTE: After the first gelation has been performed, the sample becomes liquid when turning to sol phase at high temperatures, but after returning to room temperature it turns to the gel phase again. The temperature needed for the gel-sol phase transition is lower than the temperature needed for dissolution of the crystalline gelator. By changing the kinetics of the cooling stage, one can influence the physical properties of the obtained ionogel, like microstructure, optical appearance, or the gel-sol phase transition temperature (Tgs).
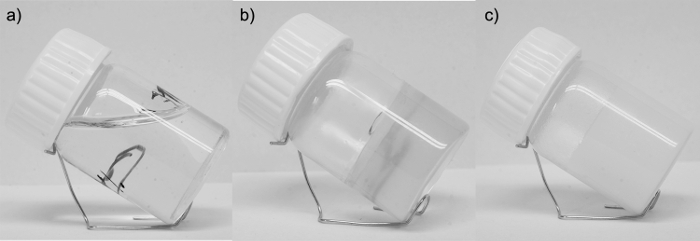
Figure 3: The physical appearance of the investigated sample. The 1M TEABr/Glyc electrolyte (a), 4% ionogel with 1M TEABr/Glyc electrolyte in transparent phase (b), 4% ionogel with 1M TEABr/Glyc electrolyte in opaque phase (c). Please click here to view a larger version of this figure.
4. In Situ Thermal Scanning Conductometry of Ionogels
To prepare the sample for TSC measurement, heat the ionogel above the Tgs temperature, 94.85 °C in the studied case. Transfer it to the precooled polypropylene vial after it turns to sol phase. Due to the fast cooling down of the sol, the gel phase is created.
Insert the conductivity sensor (with the screw cap of the vial on it) into the vial by pushing it into the gel, tighten the screw cap, and secure it with Teflon tape.
Perform the TSC measurement and record conductivity, temperature, and time to prepare conductivity vs temperature, temperature vs time, and conductivity vs time dependencies. Repeat the measurement in the investigated temperature range (9.85 - 99.85 °C) in heating-cooling cycles (at least 2 times). NOTE: Remember the 1st cycle is used to eliminate all discrepancies of the sample caused by the preparation procedure.
Perform the measurements with different cooling rates (7 °C/min, 4 °C/min, and 1 °C/min in studied case) to explore how it influences the conductive and thermal properties of investigated ionogels. NOTE:To demonstrate how the TSC method can be used as a tool to obtain ionogels with targeted properties, a series of experiments with non-aqueous ionogel based on gelator 1, glycerol, and TEABr was performed and presented in this manuscript.
5. Example of TSC Measurement
Insert the investigated ionogel into the vial, and push in the conductivity sensor.
Perform the 1st heating-cooling cycle to improve the electrode contact, and remove all imperfections of the ionogel microstructure resulting from placing the sample in the vial and seen as scratches, cracks, and air bubbles included in the gel.
Measure the conductivity and temperature along with time during the 2nd and 3rd heating-cooling cycle to investigate the performance of the ionogel, and the reproducibility of the system. Set the heating rate to 2 °C/min and cooling rate to 7 °C/min, and gelation temperature to 10 °C. As a result, obtain a transparent gel phase.
Perform the 4th and 5th heating-cooling cycle, with the heating and cooling rates equal to 2 °C/min, and the gelation temperature equal to 10 °C. As a result, obtain a mixture of the transparent and opaque gel phases.
Perform the 6th and 7th heating-cooling cycle with heating and cooling rates equal to 2 °C/min, and a gelation temperature equal to 60 °C. As a result, obtain an opaque, white gel phase.
Perform the analysis of the 1st derivatives for recorded data to see differences between samples.
Keep the sample for 20 min at each of the gelation temperatures to ensure that the gelation process is completed.
Representative Results
The organic ionic gels constitute a new class of functional materials which can become an alternative solution for polymer gel electrolytes. However, to achieve this aim, these gels have to be deeply investigated and understood. The thermally reversible character of the gelation process, and the dynamically changing properties of temperature and phase occurrence, required a new experimental method which will allow the recording of data and detection of subtle changes in temperature change. Thermal scanning conductometry is the only method which allows the recording of the conductivity and temperature of the sample in heating-cooling cycles, and the linear change of the temperature. The TSC method is the first capable of performing measurements during the gelation process, which delivered new details about changing properties of the ionogel sample during this stage.
Figure 4:The TSC heating-cooling cycle measured for [im]HSO4 ionic liquid. The TSC heating-cooling cycle measured for [im]HSO4 ionic liquid synthesized according to Bielejewski et al.12 The red points show the influence of bad electrode contact effects resulting from cracks and air bubbles present after immersing electrodes in the ionogel phase of [im]HSO4. The orange points show how the bad contact was removed by processing the sample with the TSC method. Please click here to view a larger version of this figure.
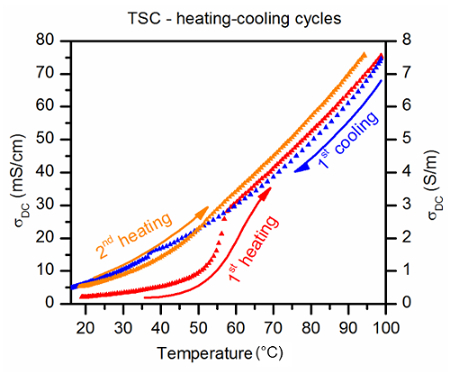
Figure 4 shows a typical temperature dependence of the conductivity, recorded by the TSC method. The first heating-cooling cycle shows how imperfections of the sample microstructure, and bad electrical contact with the electrodes created during the manufacturing process, decreases the performance of the gelled electrolyte. This unfavorable effect constitutes a major problem in the case of the polymer gel electrolytes. However, in the case of organic ionic gels, this issue can be easily solved by performing a second heating-cooling cycle in the device. The temperature dependence of the conductivity recorded during the second heating shows an increase of the conductivity, which indicates that contact with the electrodes has been improved. Moreover, by analyzing the TSC curve, one can detect some subtle anomalies. These anomalies have their origin in phase transitions from gel to sol phase during the heating stage, and from sol to gel phase during the cooling stage, as well as other types of phase transitions which influence ion mobility. The analysis of the first derivative of the conductivity in function of temperature delivers a clear picture of the anomalies.
Figure 5:The temperature dependence of 4% ionogel made with 1 M TEABr/Glyc electrolyte. The temperature dependence of 4% ionogel made with 1 M TEABr/Glyc electrolyte at transparent gel phase (a). The 1st derivative of σDC recorded for the ionogel at the transparent gel phase (b). The single anomaly observed results from the presence of one phase transition from the transparent gel phase to sol phase. Please click here to view a larger version of this figure.
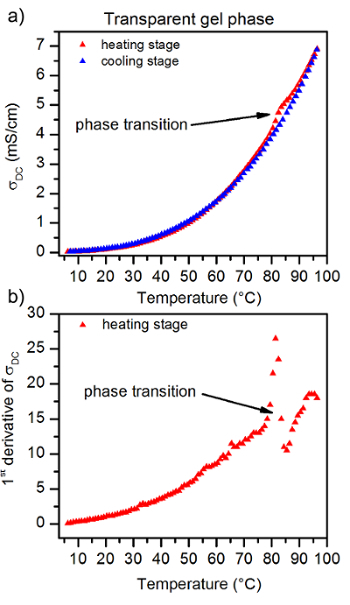
Figure 6: The temperature dependence of 4% ionogel made with 1 M TEABr/Glyc electrolyte at the mixture of two gel phases. The temperature dependence of 4% ionogel made with 1 M TEABr/Glyc electrolyte at the mixture of two gel phases, the transparent and opaque one, (a). The 1st derivative of σDC recorded for the ionogel, (b). Two anomalies of observed results from two phase transitions present in the sample. The anomaly at the lower temperature results from a phase transition from the transparent gel phase to sol, and the anomaly at the higher temperature results from a phase transition from the opaque gel phase to the sol phase, respectively. Both gel phases (transparent and opaque) were created in the gel sample, as a result of moderate temperature change rates (4 °C/min) used during cooling of the sample. Please click here to view a larger version of this figure.
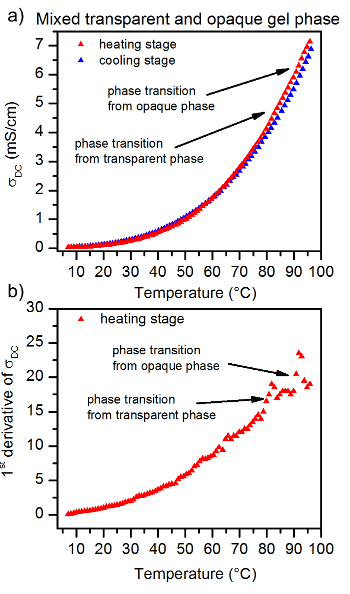
Figure 7: The temperature dependence of 4% ionogel made with 1 M TEABr/Glyc electrolyte. At the opaque gel phase(a) The 1st derivative of σDC recorded for the ionogel, (b) The single anomaly observed here results from the presence of one phase transition from the opaque gel phase to sol phase. Please click here to view a larger version of this figure.
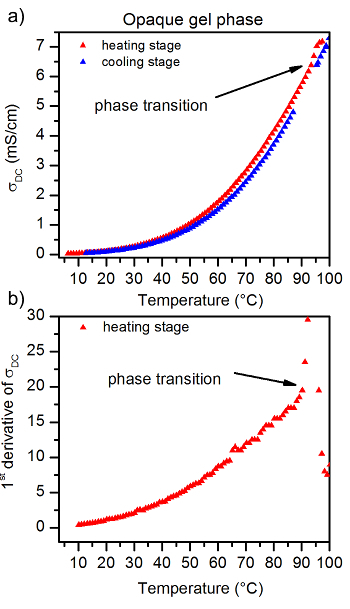
Figures 5 - 7 show a series of TSC curves, together with the first derivative recorded for the same ionogel sample, but obtained with differently performed cooling stages. The results show how the cooling stage influences the properties of the obtained sample. Moreover, these data show how sensitive the TSC method is.Figure 5shows the TSC curve recorded for the transparent sample, Figure 6 for the mixture of transparent and opaque sample, and Figure 7 for the white, opaque sample. By performing the analysis of the recorded TSC data, we found that besides the optical appearance of the ionic gel phase, the thermal properties were also changed. For the white, opaque gel phase (Figure 7), the thermal stability and Tgs phase transition temperatures were higher than for the transparent phase (Figure 5). In the case of mixed transparent and opaque phases (Figure 6), we observed two Tgs phase transition temperature characteristics for each of the phases.
Discussion
The thermal scanning conductometry is a new experimental method which has proven to be an efficient and effective way of investigating dynamically changing systems, like ionogels based on low molecular weight gelators, electrolytes, or ionic liquids. However, its applicability is not restricted only to ionogels. The TSC method can be easily used with other types of conducting soft matter systems like hydrogels, emulsions, creams, or any other charge containing carriers into which the conductivity sensor can be inserted. The limitations of the method are its dependence on the conductivity sensor itself, and the types of samples that it can work with, but the protocol can be used with any other type of conductivity cell, broadening the applicability of the method beyond the conducting physical gels. Because of the continuous workflow with heating-cooling cycles in the TSC method, one can investigate the influence of different physical properties of the substrates, e.g. initial viscosity of the solution to examine its impact on the properties of created system, such as stiffness of the gel phase. As the TSC method proved to be very sensitive to phase transition converting solid like sample to liquid state, the higher stiffness of the gel will result in bigger anomaly observed at higher phase transition temperature.
To get all the details about the investigated system, one has to perform the analysis of the 1st derivatives for recorded data in heating-cooling cycles to determine presence of different phases in the studied system, Tgs and Tsg phase transition temperatures, stability and reproducibility of the conductive properties12. Moreover, it has been shown that the TSC can be successfully used for manufacturing ionogels with targeted properties together with in situ characterization of its conductive and thermal properties. Performing the TSC measurement is a straightforward task, and is easy to control and modify according to actual requirements. The user doesn't have to pay any special attention during preparation of the ionogel sample for the TSC measurement. Imperfections, like bad electrode contact with the sample, disruption of the gel microstructure, or air bubbles entrapped in the gel phase during transferring of the hot sol to the vial, negatively influence the conductive properties of the ionogel. However, in the case of physical gels and usage of TSC method, none of the above constitute a real problem, as all of them can be easily removed at one time during the heating-cooling cycle applied in the TSC measurement (Figure 3). The low costs of the experimental setup can make it accessible for many laboratories. In return, one obtains an accurate and reproducible method, fast enough to register subtle changes at the sol-gel and gel-sol phase transition temperature, and sensitive enough to distinguish between two coexisting phases in one system. To ensure high reproducibility of the measurements over many of heating-cooling cycles, it is important that the measured sample preserves its chemical composition. Therefore, in the case of volatile samples or samples that become volatile at higher temperatures, the mounting of the conductivity sensor in the vials must be firm and tight to eliminate leakage. In comparison with classical conductometry, it delivers much more data and can be used in automatic mode, allowing the repetition of the same conditions for different samples. Thanks to the TSC method, studying the conductive and thermal properties during the gelation stage has become possible. Since the gelation process defines the properties of created ionic gels (e.g., creation of different gel microstructures upon different cooling rate used during gelation process12), the TSC method will allow a better understanding of its underlying processes, and intentional designing of target specific ionogels in the future.
The TSC method presented in the article can be modified by adding a light source to stimulate investigated samples (light responding LMWG), or a camera to instantly record the macroscopic changes of the sample as a function of temperature. If the temperature change is not linear during measurements, the user should check if the flow of nitrogen gas is constant and sufficient to achieve the set temperature. If the repeatability of measured data for second and following heating-cooling cycles is not sufficient, the user should check the mounting of the sensor and check if it is tight, as evaporation of volatile samples affects the results. If the change of the sample temperature measured by the internal sensor in the conductivity cell does not follow the change of the temperature measured by the VTC, the user should check if enough sample was put into the vial. The temperature sensor in the conductivity cell should be covered by the measured sample. If the number of measured point during heating or cooling stage is not appropriate (too small or too large), the user should change the readout interval in the conductometer.
Concerning the TSC method, the known limitations are the dependence on the conductivity cell for the measuring range and type of samples, the temperature control unit in terms of linearity of temperature change during heating and cooling stages, the efficiency of cooling circuit for high temperature change rates, and the capacity of the high-pressure nitrogen tank in terms of time, as measurements take place continuously over a number of days.
The TSC method can follow the dynamically changing properties of measured samples during the heating and cooling stages. For the first time, it allowed measurements during the gelation process. The protocol is straightforward and delivers results with high reliability. The measurements can be done automatically and performed for a very long time, depending on the capacity of the high-pressure nitrogen tank.
In the future, the TSC protocol can be used in commercial devices equipped with organic ionic gels to self-monitor the state of the ionogel, and inform the user about usage levels and indication for performing the renewing of the gel phase via the heating -cooling cycle. Moreover, by changing the sensor, which measures some physical quantity, the TSC protocol can be used for other types of measurements as well.
The only critical steps within the TSC method are the setting of operating temperatures, which cannot exceed the allowed temperature range for the conductivity sensor, and the tight mounting of the conductivity sensor within the vial to eliminate evaporation of volatile samples. The way in which the sensor is placed in the sample is not important, as all disruptions will be eliminated during the first heating-cooling cycle.
Disclosures
The author has nothing to disclose
Acknowledgments
Financial support for this work was provided by the National Center for Science as grant No. DEC-2013/11/D/ST3/02694.
References
- Bielejewski M. Novel approach in determination of ionic conductivity and phase transition temperatures in gel electrolytes based on Low Molecular Weight Gelators. Electochim. Acta. 2015;174:1141–1148. [Google Scholar]
- Bielejewski M, Łapiński A, Luboradzki R, Tritt-Goc J. Influence of solvent on the thermal stability and organization of self-assembling fibrillar networks in methyl-4,6-O-(p-nitrobenzylidene)-α-D-glucopyranoside gels. Tetrahedron. 2011;67:7222–7230. [Google Scholar]
- Atsbeha T, et al. Photophysical characterization of low-molecular weight organogels for energy transfer and light harvesting. J. Mol. Struct. 2011;993:459–463. [Google Scholar]
- Gronwald O, Snip E, Shinkai S. Gelator for organic liquids based on self-assembly: a new facet of supramolecular and combinatorial chemistry. Curr. Opinion in Coll. Interface Sci. 2002;7:148–156. [Google Scholar]
- Vintiloiu A, Leroux JC. Organogels and their use in drug delivery-a review. Control. Rel. 2008;125:179–192. doi: 10.1016/j.jconrel.2007.09.014. [DOI] [PubMed] [Google Scholar]
- Wang Z, Fujisawa S, Suzuki M, Hanabusa K. Low Molecular Weight Gelators Bearing Electroactive Groups as Cathode Materials for Rechargeable Batteries. Macromol. Symp. 2016;364:38–46. [Google Scholar]
- Sharma N, et al. Physical gels of [BMIM][BF4] by N-tert-butylacrylamide/ethylene oxide based triblock copolymer self-assembly: Synthesis, thermomechanical, and conducting properties. J. Appl. Polym. Sci. 2013;128:3982–3992. [Google Scholar]
- Tao L, et al. Stable quasi-solid-state dye-sensitized solar cell using a diamide derivative as low molecular mass organogelator. J. Power Sources. 2014;262:444–450. [Google Scholar]
- Kataoka T, Ishioka Y, Mizuhata M, Minami H, Maruyama T. Highly Conductive Ionic-Liquid Gels Prepared with Orthogonal Double Networks of a Low-Molecular-Weight Gelator and Cross-Linked Polymer. ACS Appl. Mater. Interfaces. 2015;7:23346–23352. doi: 10.1021/acsami.5b07981. [DOI] [PubMed] [Google Scholar]
- Bielejewski M, Nowicka K, Bielejewska N, Tritt-Goc J. Ionic Conductivity and Thermal Properties of a Supramolecular Ionogel Made from a Sugar-Based Low MolecularWeight Gelator and a Quaternary Ammonium Salt Electrolyte Solution. J. Electrochem. Soc. 2016;163:G187–G195. [Google Scholar]
- Gronwald O, Shinkai S. Bifunctional' sugar-integrated gelators for organic solvents and water-on the role of nitro-substituents in 1-O-methyl-4,6-O-(nitrobenzylidene)-monosaccharides for the improvement of gelation ability. J. Chem. Soc., Perkin Trans. 2001;2:1933–1937. [Google Scholar]
- Bielejewski M, Ghorbani M, Zolfigol M, Tritt-Goc J, Noura S, Narimani M, Oftadeh M. Thermally reversible solidification of novel ionic liquid [im]HSO4 by self-nucleated rapid crystallization: investigations of ionic conductivity, thermal properties, and catalytic activity. RSC Adv. 2016;6:108896–108907. [Google Scholar]


