

Abstract
Gradual dissociation of detergent molecules from water-insoluble membrane proteins culminates in protein aggregation. However, the time-dependent trajectory of this process remains ambiguous, because the signal-to-noise ratio of most spectroscopic and calorimetric techniques is drastically declined by the presence of protein aggregates in solution. Here, we show that by using steady-state fluorescence polarization (FP) spectroscopy, the dissociation of the protein-detergent complex (PDC) can be inspected in real time at detergent concentrations below the critical micelle concentration (CMC). This article provides experimental evidence for the coexistence of two distinct phases of the dissociations of detergent monomers from membrane proteins. We first noted a slow detergent predesolvation process, which was accompanied by a relatively modest change in the FP anisotropy, suggesting a small number of dissociated detergent monomers from the proteomicelles. This predesolvation phase was followed by a fast detergent desolvation process, which was highlighted by a major alteration in the FP anisotropy. The durations and rates of these phases were dependent on both the detergent concentration and interfacial PDC interactions. Further development of this approach might lead to the creation of a new semi-quantitative method for the assessment of the kinetics of association and dissociation of proteomicelles.
Keywords: FhuA, OmpG, Protein engineering, Protein-detergent interactions, Fluorescence polarization spectroscopy
TOC image

INTRODUCTION
Interactions of detergents with membrane proteins are ubiquitous in structural and chemical biology, as well as biotechnology.1–5 These interactions are complex because of the diversity of architectural fingerprints of membrane proteins in various reconstitution systems, such as liposomes, nanodiscs, and planar lipid membranes.6 The complicated behavior of membrane proteins in solution is driven by the subtle balance among their physicochemical features, which include the interfacial forces with detergent micelles.7–8 In many instances, the inability of membrane proteins to optimally interact with detergents leads to their loss of activity,6, 9 stability,10–12 and proper solubilization,2, 12–15 preceding the protein aggregation.16–17 The presence of aggregates in solution adds to the difficulty of many approaches to characterize the stability and interfacial dynamics of insoluble membrane proteins in aqueous phase.18 This is especially a frequent problem at detergent concentrations comparable with or below the critical micelle concentration (CMC). Therefore, the interfacial protein-detergent complex (PDC) interactions are not normally assessed under these harsh, low-detergent concentration conditions.16, 19
Recently, we have shown that these challenges of measuring the interfacial PDC interactions can be overcome using steady-state fluorescence polarization (FP) spectroscopy.20 Additional advantageous traits of this approach included its amenability for a high-throughput microplate reader-based setting, low-nanomolar concentration of protein sample, and an increased optical signal-to-noise ratio due to a bright and photostable fluorophore.21 These attributes enabled us to determine the isothermal Hill-Langmuir desorption curves of the proteomicelles containing either α-helical or β-barrel membrane proteins of varying size, charge, stability, and structure.22
Here, we show that this approach can be extended to infer the time-dependent detergent desorption curves of membrane proteins at detergent concentrations below the CMC. The primary attribute of this approach is the fact that the FP readout for a noninteracting fluorophore is not dependent on its effective concentration.4, 29 Therefore, the dissociation of detergent micelles from membrane proteins was observed as a relative change in the population of the fluorescent proteins between detergent solvated and desolvated states. The membrane proteins were first incubated in solubilizing mild detergents at concentrations much greater than the CMC. Under these circumstances, all proteins were detergent solvated, so that a high FP anisotropy was noted, reflecting a slow tumbling rate of the proteomicelles. Interestingly, a time-dependent reduction in the FP anisotropy was noted when the proteins were diluted at a detergent concentration below the CMC, suggesting that there was a gradual detergent desolvation process. This finding was in good accord with an increased rotational diffusion coefficient of the dissociated membrane proteins.
In this work, we explored this time-dependent detergent desorption process for three β-barrel membrane proteins of varying charge and size, which were solubilized using a panel of four detergents of diverse hydrophobic tails and polar head groups. These studies were conducted using a wild-type outer membrane protein G (OmpG),25 a medium-size, 14-stranded β-barrel, and two extensive-truncation derivatives of ferric hydroxamate uptake component A (FhuA),26 a large 22-stranded β-barrel (Fig. 1; Supporting Information, Table S1). The FhuA derivatives FhuA ΔC/Δ5L_25N and FhuA ΔC/Δ7L_30N featured a complete deletion of an internal cork domain (C) as well as the truncation of five (L3, L4, L5, L10, and L11) and seven (L3, L4, L5, L7, L8, L10, and L11) extracellular loops, respectively. OmpG is an acidic protein at physiological conditions, showing an isoelectric point pI 4.4. On the contrary, these truncation FhuA variants encompass 25 and 30 negative charge neutralizations, respectively, producing a charge reversal of the wild-type FhuA from acidic to basic values under physiological circumstances.30 These basic FhuA variants feature pI values of 9.3 and 9.6, respectively. Here, we were interested to examine whether the FP anisotropy is a robust readout of the time-dependent desorption process of these three β-barrel membrane proteins solubilized in detergents of varying physicochemical properties (Supporting Information, Table S2). These detergents included 1-lauroyl-2-hydroxy-sn-glycero-3-phosphocholine (LysoFos), a zwitterionic molecule, as well as n-undecyl-β-D-maltopyranoside (UM), n-decyl-β-D-maltopyranoside (DM), and 4-cyclohexyl-1-butyl-β-D-maltoside (CYMAL-4), three neutral molecules of varying hydrophobic tails. These maltoside-containing detergents have 11, 10, and 4 alkyl groups, respectively. Furthermore, CYMAL-4 differs from UM and DM through the addition of a benzene ring.
Figure 1. Side-view of the molecular structures of OmpG and truncation FhuA mutants.

(A) OmpG; (B) FhuA ΔC/Δ5L_25N;
(C) ΔC/Δ7L_30N. The positions of the fluorophore were marked in yellow. For OmpG, Texas Red21 was tethered at position D224C on loop L6. For the two truncation FhuA derivatives, Texas Red was attached to an engineered GS-rich, cysteine-containing loop on the T7 β turn. FhuA ΔC/Δ5L_25N and FhuA ΔC/Δ7L_30N show charge neutralizations, which are marked in red with respect to the native FhuA. For the latter FhuA mutant, there are three additional lysine mutations within the β turns, which are marked in blue, out of which two are negative-to-positive charge reversals.23–24 The arrows indicate molecular dimensions, as inferred from Cα to Cα, which were obtained from the X-ray crystal structure of both proteins.25–26 Cartoons show proteomicelles in a prolate geometrical packing.27 The homology structure of truncation FhuA derivatives was accomplished using Swiss-model28 and FhuA PDB ID:1FI1.26
EXPERIMENTAL METHODS
Expression, extraction, and purification of the OmpG and FhuA proteins
Expression, extraction, and purification of OmpG,22, 31 as well as the truncation FhuA32–33 proteins FhuA ΔC/Δ5L_25N and FhuA ΔC/Δ7L_30N, were previously reported. The deletion FhuA mutants lacked the internal cork domain (C) and either five (L3, L4, L5, L10, and L11) or seven (L3, L4, L5, L7, L8, L10, and L11) extracellular loops, respectively.30, 34 In addition, they featured either 25 (FhuA ΔC/Δ5L_25N) or 30 (FhuA ΔC/Δ7L_30N) negative charge neutralizations with respect to the wild-type FhuA barrel scaffold, making them basic proteins. For the fluorophore covalent attachment, the T7 β turn (V331PEDRP336) of the truncation FhuA mutants was replaced with a cysteine-containing, GS-rich flexible loop (GGSSGCGSSGGS). In the case of OmpG, the cysteine sulfhydryl was engineered directly on extracellular loop L6 at position D224.
Refolding of the β-barrel membrane proteins
A rapid-dilution refolding protocol was employed for the refolding of all proteins.35 40 μl of 6×His tag-purified and guanidinium hydrochloride (Gdm-HCl)-denatured protein was 50-fold diluted into 200 mM NaCl, 50 mM HEPES, pH 7.4 solutions at 4°C, which contained detergents (Anatrace, Maumee, OH) at concentrations above their CMC. The starting detergent concentrations were the following: (i) 20 mM LysoFos; (ii) 5 and 20 mM UM; (iii) 5 and 20 mM DM; (iv) 50 mM CYMAL-4.
FP anisotropy determinations
Texas Red C2-maleimide (Thermo Fisher Scientific, Waltham, MA) was used for fluorescent labeling of all membrane proteins, as previously reported.20, 22 The time-dependent FP anisotropy traces were acquired using a SpectraMax I3 plate reader (Molecular Devices, Sunnyvale, CA), which was equipped with a Paradigm detection cartridge for rhodamine FP spectroscopy.20 Texas Red fluorophore21, 36 was covalently attached to an engineered cysteine sulfhydryl of the membrane proteins. The FP traces were collected using the excitation and emission wavelengths of 535 and 595 nm, respectively. The time-dependent, steady-state FP anisotropy traces were acquired with diluted detergents either above or below their CMC, while keeping the final protein concentration constant at 28 nM.20 This was achieved by titrating the same protein sample with buffer solutions of varying detergent concentration. The buffer solution contained 200 mM NaCl, 50 mM HEPES, pH 7.4. The equilibration of the samples was conducted using an incubation time of ~15 min, which was followed by a time-dependent FP anisotropy read. Drastic detergent reduction within the well increased the protein aggregation over time, but without a severe deterioration in the signal-to-noise ratio of the FP anisotropy. In addition, we checked that the self-quenching of Texas Red did not induce a time-dependent reduction in the FP anisotropy.22
Determination of the observed predesolvation and desolvation rates
The observed predesolvation rates (kobspre) were determined at various detergent concentrations below the CMC (Supporting Information, Table S3). This was accomplished using a linear fit of the time-dependent FP anisotropy (i.e., kobspre is Δr/Δt), r (t):
| (1) |
Here, rmax is the maximum FP anisotropy at the initial recording time, whereas t shows the elapsed time during the predesolvation phase. The observed desolvation rates, kobsdes, were also determined at various detergent concentrations below the CMC (Supporting Information, Table S4). This was accomplished using a single-exponential fit of the time-dependent FP anisotropy (i.e., kobsdes is 1/τ, where τ is the time constant), r (t), as follows:
| (2) |
Here, rmin denotes the minimum FP anisotropy at the infinite time of the desolvation reaction. t shows the elapsed time during the desolvation phase, including the total time of the predesolvation phase. Tpre is the total predesolvation time, so that t > Tpre. In the most cases, the observed desolvation rate, kobsdes, was derived by fitting the single-exponential decay of the time-dependent FP anisotropy, r (t), except in a number of cases that were approached with a linear time dependence. In Eq. (2), rd is an FP anisotropy constant, so that the initial FP anisotropy during desolvation phase, rin, is given as follows (rmax > rin > rmin),
| (3) |
which provides the following expression for rd:
| (4) |
Using eqns. (2) and (4), one obtains the final form of the time-dependent FP anisotropy function for the detergent desolvation phase of proteomicelles:
| (5) |
In general, the experimental uncertainty was greater at detergent concentrations below the CMC than that measured at concentrations above the CMC. We think that this alteration in the experimental uncertainty was primarily determined by the coexistence of complex sub-states of soluble and insoluble protein aggregates.
The reduction in light scattering effects
One obvious difficulty of these steady-state FP-based determinations was the presence of light scattering signals produced by the detergent micelles and proteomicelles in solution and at detergent concentrations either below or above the CMC. Therefore, their scattering effects must be minimized. Both Raman and Rayleigh scattering factors feature light intensity contributions, which are proportional to the power of λ−4, where λ is the wavelength.37–38 Therefore, we tactically employed a large wavelength of the emission to preclude these light scattering effects. During the preliminary stage of this work, we gradually amplified the concentrations of Texas Red-labeled proteins until a value, beyond which the emission was independent of the protein concentration. This value was in the low-nanomolar range. Moreover, the SpectraMax I3 plate reader (Molecular Devices) is equipped with excitation and emission filters that form a spectral gap of 60 nm, ensuring that the scattering effect contributions are minimized. Finally, the light scattering effects are always significantly reduced when the FP anisotropy signals are independent of both protein concentration and emission wavelength.38
RESULTS AND DISCUSSION
In Fig. 2, we illustrated the time-dependent change in the FP anisotropy when these β-barrel membrane proteins were incubated in LysoFos at concentrations either above or below the CMC value of this zwitterionic detergent (0.7 mM). As a common feature, at detergent concentrations much greater than the CMC, all proteins showed a fairly unchanged FP anisotropy for long periods, suggesting robust proteomicelles formed with LysoFos. In contrast, at detergent concentrations comparable with or less than the CMC, the FP anisotropy underwent a time-dependent significant modification. Moreover, the FP readout was also sensitive upon the dilution of detergent concentration within the well at values below the CMC. Another similar trait among all proteins was coexistence of a slow, low-FP amplitude change phase, which was followed by a fast, high-FP amplitude alteration phase. In this article, we will call these phases predesolvation and desolvation, respectively. Notably, the predesolvation phase, as the longer of the two phases, lasted for a few minutes (Supporting Information, Table S3). The desolvation phase followed an exponential decay (Supporting Information, Figs. S1-S3, Table S4). For the basic FhuA proteins, the observed desorption rate, kobsdes, increased by decreasing the detergent concentration within the well. For example, at LysoFos concentrations of 0.4, 0.2, and 0.1 mM, the observed desorption rates, kobsdes, for FhuA ΔC/Δ5L_25N were (140 ± 9)×10−5 s−1, (360 ± 22)×10−5 s−1, and (510 ± 27)×10−5 s−1, respectively. The corresponding kobsdes rates for FhuA ΔC/Δ7L_30N were (182 ± 9)×10−5 s−1, (284 ± 14)×10−5 s−1, and (719 ± 29 s−1)×10−5 s−1, respectively.
Figure 2. Time-dependent alterations in the FP anisotropy when the membrane proteins were incubated at different concentrations of LysoFos, a zwitterionic detergent.

(A) OmpG; (B) FhuA ΔC/Δ5L_25N; (C) FhuA ΔC/Δ7L_30N. The solubilized protein concentration was 28 nM. The buffer solution contained 200 mM NaCl, 50 mM HEPES, pH 7.4. The experimental FP anisotropy data were presented as average ± SD over a number of at least three distinct acquisitions.
In Fig. 3, we show the time-dependent alteration in the FP anisotropy when these β-barrel membrane proteins were incubated in UM. Again, at concentrations below the CMC for this detergent (~0.59 mM), we noted two distinct phases: a slow predesolvation phase, which was followed by a fast desolvation phase. The duration of the predesolvation phase recorded with an UM concentration of 0.1 mM was shorter than those found by using higher detergent concentrations (Supporting Information, Figs. S4-S6, Table S3). In general, the desolvation of these membrane proteins from UM followed faster rates that those observed with LysoFos (Supporting Information, Table S4). This outcome indicates a specific, time-dependent FP-based signature of this detergent desorption process, despite closely similar CMC values and apparent dissociation constants of their proteomicelles, Kd. For example, the CMC values of LysoFos and UM are ~0.7 and ~0.6 mM (Supporting Information, Table S2), respectively. On the other hand, their previously determined Kd are in the range 0.3-0.7 and 0.5-0.7 mM, respectively.22 To conclude, this finding shows that in the case of UM, the adhesion forces between proteins and detergent monomers were weaker as compared to those in the case of LysoFos.
Figure 3. Time-dependent alterations in the FP anisotropy when the membrane proteins were incubated at different concentrations of UM, a neutral maltoside-containing detergent.
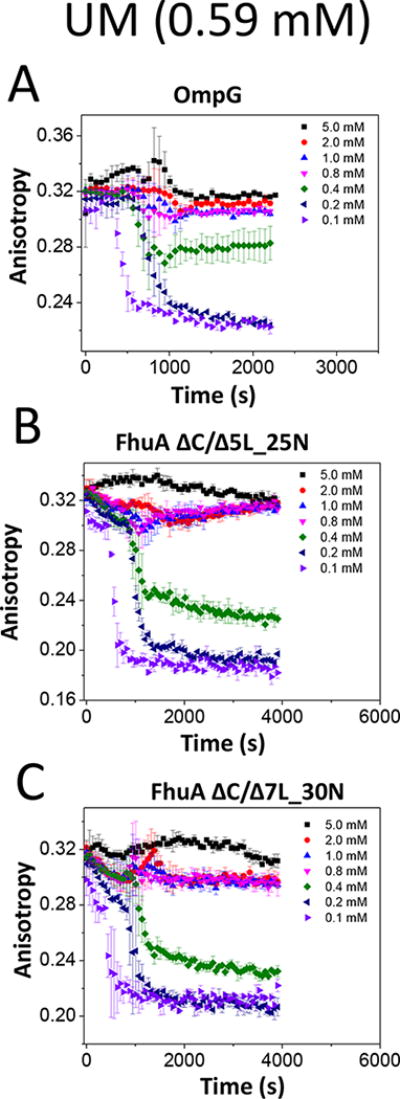
(A) OmpG; (B) FhuA ΔC/Δ5L_25N; (C) FhuA ΔC/Δ7L_30N. The other experimental conditions were the same as those in Fig. 2.
When the proteins were incubated in DM at concentrations below the CMC (~1.8 mM), the predesolvation and desolvation were also dependent on the detergent concentration within the well (Fig. 4; Supporting Information, Figs. S7-S9). Specifically, at the lowest DM detergent concentration of 0.45 mM, the predesolvation phases were shortest. At the same time, the observed desolvation rates were faster at decreased detergent concentrations (Supporting Information, Table S3, Table S4). At DM concentrations of 0.45, 0.85, and 1 mM, the observed predesolvation rates, kobspre, recorded for FhuA ΔC/Δ5L_25N were (54 ± 1)×10−6 s−1, (29 ± 1)×10−6 s−1, and (20 ± 1)×10−6 s−1, respectively. On the other hand, the corresponding kobsdes values for FhuA ΔC/Δ5L_25N were (629 ± 59)×10−5 s−1, (353 ± 36)×10−5 s−1, and (191 ± 19)×10−5 s−1, respectively. At the same time, the kobsdes values noted with FhuA ΔC/Δ7L_30N were (599 ± 50)×10−5 s−1, (478 ± 37)×10−5 s−1, and (369 ± 44)×10−5 s−1, respectively. These rates indicate that at a lower detergent concentration there is a shift of the association-dissociation equilibrium of the proteomicelles with the coexistent micelles towards dissociation.
Figure 4. Time-dependent alterations in the FP anisotropy when the membrane proteins were incubated at different concentrations of DM, a neutral maltoside-containing detergent.

(A) OmpG; (B) FhuA ΔC/Δ5L_25N; (C) FhuA ΔC/Δ7L_30N. The other experimental conditions were the same as those in Fig. 2.
Finally, we show the time-dependent change in the FP anisotropy recorded when the proteins were incubated in CYMAL-4 (Fig. 5; Supporting Information, Figs. S10-S12). Remarkably, very long predesolvation durations were recorded at detergent concentrations below the CMCCYMAL-4 (~7.6 mM). For example, the predesolvation durations recorded with all proteins at 2 mM CYMAL-4 were greater than 20 min, suggesting strong adhesive interactions between CYMAL-4 detergent monomers and these proteins. Moreover, no FP anisotropy changes were noted when the truncation FhuA proteins were incubated at 4 mM CYMAL-4, a concentration significantly smaller than the corresponding CMC. These results illuminate that the adhesive PDC interactions between membrane proteins and CYMAL-4 are greater than the cohesive interactions among the detergent monomers. These time-dependent FP anisotropy reads are in good accord with the recently determined apparent equilibrium constants, Kd, for CYMAL-4 with β-barrel membrane proteins.22 Specifically, these Kd values for the PDC formed by CYMAL-4 with OmpG, FhuA ΔC/Δ5L_25N, and FhuA ΔC/Δ7L_30N are 4.6, 5.7, and 4.5 mM, respectively. Indeed, these apparent Kd values are significantly smaller than the CMC value of 7.6 mM.
Figure 5. Time-dependent alterations in the FP anisotropy when the membrane proteins were incubated at different concentrations of CYMAL-4, a neutral maltoside-containing detergent.

(A) OmpG;
(B) FhuA ΔC/Δ5L_25N;
(C) FhuA ΔC/Δ7L_30N. The other experimental conditions were the same as those in Fig. 2.
It is now clear that satisfactory detergent-mediated solvation forces of β-barrel membrane proteins contribute to the existence of a predesolvation phase. We found that the characteristics of the predesolvation phase strongly depends not only on these adhesive PDC interactions, but also the available detergent concentration within the well. It is conceivable that a very weak interfacial PDC interaction of a certain detergent-membrane protein pair might impede the presence of a predesolvation phase, whereas the desolvation should normally occur within a matter of seconds. Therefore, we illustrated a cartoon in Fig. 6, which presents three distinct FP anisotropy-based trajectories of the time-dependent desolvation of a β-barrel membrane protein. A predesolvation phase occurs when these adhesive PDC interactions between the detergent molecules and membrane proteins overcome the cohesive forces among the detergent monomers. Because of the low FP anisotropy alteration during this predesolvation phase, we think that the average proteomicelle still maintains most of the solubilizing detergent monomers under these conditions. It is more than likely that the predesolvation phase represents a relatively small loss of detergent monomers of the proteomicelle, inducing a reconfiguration of the internal packing forces of the proteomicelle. This proteomicelle rearrangement leads to fast desolvation phase.
Figure 6. Cartoon showing different FP anisotropy-based trajectories of the proteodemicellization.

The predesolvation phase underwent a linear change in the FP anisotropy, whereas the desolvation phase followed either a linear regime, which was marked in green, or an exponential decay, which was marked in red. In the case of weak PDC interactions and low incubating detergent concentration, there is no a predesolvation phase, whereas the desolvation phase, which is marked in blue, is rapid.
The desolvation rate is always greater than the predesolvation rate and occurs in an exponential fashion. Assuming a simple bicomponent model of association of the β-barrel membrane protein to a detergent micelle and a high detergent concentration below the CMC, the observed desolvation rate, kobsdes, is -kon[D] + koff.39 Here, the detergent concentration, [D], is in the micromolar to millimolar range, which is much greater than the protein concentration, [P], which is present at low-nanomolar concentration. That means a linear dependence of kobsdes on detergent concentration, [D], with a slope of -kon and an intercept with the vertical axis of koff. Among all cases examined in this work, we only found this behavior in the case of the desolvation process of the truncation FhuA derivatives from LysoFos (Supporting Information, Fig. S13, Table S5). For example, kon and koff of the PDC made with FhuA ΔC/Δ5L_25N were 12.1 ± 1 M−1s−1 and (6.2 ± 0.3)×10−3 s−1, respectively, giving an apparent Kd of 0.51 mM. This value is in excellent agreement with the apparent Kd of 0.71 mM for the same PDC, which was determined from isothermal Hill-Langmuir desorption curves.22 A certain numerical difference between the two equilibrium constants might also arise from the fact that the predesolvation phase was neglected in the determination of Kd via kinetic FP anisotropy-based measurements. The above kinetic rate constants illustrate a very slow association process and a relatively long τoff binding time. Taken together, the weak binding interactions leading to millimolar values of the apparent dissociation constant, Kd, are primarily determined by the very slow association process (kon) (Supporting Information, Fig. S13, Table S5). However, we determined other scaling functions of kobsdes with the final detergent concentration in the well, [D], suggesting diverse kinetic models of varying order of the desolvation reaction (Supporting Information, Figs. S14-S16, Table S6). This finding shows that the desolvation kinetic scheme strongly depends on the architectural and biophysical fingerprints of the membrane proteins as well as the physicochemical characteristics of the solubilizing detergents.
In summary, this study sheds light on the time-dependent detergent desorption of membrane proteins at detergent concentrations below the CMC. We were able to observe this process by employing a steady-state FP spectroscopy approach that featured a bright and photostable fluorophore, maintaining the optical signal-to-noise ratio within a satisfactory range. Notably, the approach that we present in this paper requires extremely small quantities of membrane proteins (e.g., tens of nanograms per trial). Moreover, these time-dependent FP anisotropy reads were conducted using a microplate format, potentially allowing for parallel assessment of hundreds-thousands of conditions in minutes-hours. This experimental formulation reinforces the informative power of this approach, which shows realistic prospects for the high-throughput screening of the interfacial PDC interactions. We pointed out that the detergent desolvation of membrane proteins using both zwitterionic and uncharged detergents is preceded by a slow predesolvation phase that can be even longer than 20 minutes. This predesolvation phase might either be slowed at detergent concentrations approaching the CMC value or accelerated at very low detergent concentrations within the well. Future developments of this steady-state FP spectroscopy-based approach might lead to the creation of a detailed kinetic analysis of the interfacial PDC interactions, involving membrane proteins and detergents of varying physicochemical properties. Finally, these semi-quantitative studies might stimulate novel discoveries in membrane protein solubilization, refolding, stabilization, and crystallization.17, 40–41
Supplementary Material
Acknowledgments
We thank Yi-Ching Hsueh, Adam Blanden, and Bach Pham for their assistance during the very early stages of these studies. This research project was supported by the US National Institutes of Health grants R01 GM115442 (M.C.) and R01 GM088403 (L.M.).
Footnotes
SUPPORTING INFORMATION. (i) Properties of the membrane proteins used in this work; (ii) Properties of the detergents used in this work; (iii) Detailed graphical presentation of the fits of the predesolvation and desolvation phases; (iv) Results of the fits of the predesolvation phase; (v) Results of the fits of the desolvation phase; (vi) Dependence of the observed desolvation rates on the detergent concentration. These materials are available free of charge via the Internet at http://pubs.acs.org
References
- 1.Pocanschi CL, Popot JL, Kleinschmidt JH. Folding and stability of outer membrane protein A (OmpA) from Escherichia coli in an amphipathic polymer, amphipol A8-35. Eur Biophys J. 2013;42(2-3):103–118. doi: 10.1007/s00249-013-0887-z. [DOI] [PubMed] [Google Scholar]
- 2.Sadaf A, Cho KH, Byrne B, Chae PS. Amphipathic agents for membrane protein study. Methods Enzymol. 2015;557:57–94. doi: 10.1016/bs.mie.2014.12.021. [DOI] [PubMed] [Google Scholar]
- 3.Pollock NL, Satriano L, Zegarra-Moran O, Ford RC, Moran O. Structure of wild type and mutant F508del CFTR: A small-angle X-ray scattering study of the protein-detergent complexes. J Struct Biol. 2016;194(1):102–11. doi: 10.1016/j.jsb.2016.02.004. [DOI] [PubMed] [Google Scholar]
- 4.Li J, Qiu XJ. Quantification of membrane protein self-association with a high-throughput compatible fluorescence assay. Biochemistry. 2017;56(14):1951–1954. doi: 10.1021/acs.biochem.7b00009. [DOI] [PubMed] [Google Scholar]
- 5.Ehsan M, Du Y, Scull NJ, Tikhonova E, Tarrasch J, Mortensen JS, Loland CJ, Skiniotis G, Guan L, Byrne B, Kobilka BK, Chae PS. Highly branched pentasaccharide-bearing amphiphiles for membrane protein studies. J Am Chem Soc. 2016;138(11):3789–96. doi: 10.1021/jacs.5b13233. [DOI] [PMC free article] [PubMed] [Google Scholar]
- 6.Frey L, Lakomek NA, Riek R, Bibow S. Micelles, bicelles, and nanodiscs: comparing the impact of membrane mimetics on membrane protein backbone dynamics. Angew Chem Int Ed Engl. 2017;56(1):380–383. doi: 10.1002/anie.201608246. [DOI] [PMC free article] [PubMed] [Google Scholar]
- 7.Linke D. Detergents: an overview. Methods Enzymol. 2009;463:603–617. doi: 10.1016/S0076-6879(09)63034-2. [DOI] [PubMed] [Google Scholar]
- 8.Khao J, Arce-Lopera J, Sturgis JN, Duneau JP. Structure of a protein-detergent complex: the balance between detergent cohesion and binding. Eur Biophys J. 2011;40(10):1143–55. doi: 10.1007/s00249-011-0745-9. [DOI] [PubMed] [Google Scholar]
- 9.Raschle T, Rios Flores P, Opitz C, Muller DJ, Hiller S. Monitoring backbone hydrogen-bond formation in beta-barrel membrane protein folding. Angew Chem Int Ed Engl. 2016;55(20):5952–5. doi: 10.1002/anie.201509910. [DOI] [PubMed] [Google Scholar]
- 10.Stangl M, Veerappan A, Kroeger A, Vogel P, Schneider D. Detergent properties influence the stability of the glycophorin A transmembrane helix dimer in lysophosphatidylcholine micelles. Biophys J. 2012;103(12):2455–64. doi: 10.1016/j.bpj.2012.11.004. [DOI] [PMC free article] [PubMed] [Google Scholar]
- 11.Yang Z, Wang C, Zhou Q, An J, Hildebrandt E, Aleksandrov LA, Kappes JC, DeLucas LJ, Riordan JR, Urbatsch IL, Hunt JF, Brouillette CG. Membrane protein stability can be compromised by detergent interactions with the extramembranous soluble domains. Protein Sci. 2014;23(6):769–89. doi: 10.1002/pro.2460. [DOI] [PMC free article] [PubMed] [Google Scholar]
- 12.Yang Z, Brouillette CG. A guide to differential scanning calorimetry of membrane and soluble proteins in detergents. Methods Enzymol. 2016;567:319–58. doi: 10.1016/bs.mie.2015.08.014. [DOI] [PubMed] [Google Scholar]
- 13.Roy A. Membrane preparation and solubilization. Methods Enzymol. 2015;557:45–56. doi: 10.1016/bs.mie.2014.11.044. [DOI] [PubMed] [Google Scholar]
- 14.Le Roy A, Wang K, Schaack B, Schuck P, Breyton C, Ebel C. AUC and small-angle scattering for membrane proteins. Methods in enzymology. 2015;562:257–86. doi: 10.1016/bs.mie.2015.06.010. [DOI] [PubMed] [Google Scholar]
- 15.Baker LA, Folkers GE, Sinnige T, Houben K, Kaplan M, van der Cruijsen EA, Baldus M. Magic-angle-spinning solid-state NMR of membrane proteins. Methods Enzymol. 2015;557:307–28. doi: 10.1016/bs.mie.2014.12.023. [DOI] [PubMed] [Google Scholar]
- 16.Jahnke N, Krylova OO, Hoomann T, Vargas C, Fiedler S, Pohl P, Keller S. Real-time monitoring of membrane-protein reconstitution by isothermal titration calorimetry. Analytical chemistry. 2014;86(1):920–927. doi: 10.1021/ac403723t. [DOI] [PMC free article] [PubMed] [Google Scholar]
- 17.Neale C, Ghanei H, Holyoake J, Bishop RE, Prive GG, Pomes R. Detergent-mediated protein aggregation. Chem Phys Lipids. 2013;169:72–84. doi: 10.1016/j.chemphyslip.2013.02.005. [DOI] [PMC free article] [PubMed] [Google Scholar]
- 18.Miles AJ, Wallace BA. Circular dichroism spectroscopy of membrane proteins. Chem Soc Rev. 2016;45(18):4859–72. doi: 10.1039/c5cs00084j. [DOI] [PubMed] [Google Scholar]
- 19.Textor M, Keller S. Automated analysis of calorimetric demicellization titrations. Anal Biochem. 2015;485:119–21. doi: 10.1016/j.ab.2015.06.009. [DOI] [PubMed] [Google Scholar]
- 20.Wolfe AJ, Hsueh YC, Blanden AR, Mohammad MM, Pham B, Thakur AK, Loh SN, Chen M, Movileanu L. Interrogating detergent desolvation of nanopore-forming proteins by fluorescence polarization spectroscopy. Analytical chemistry. 2017;89(15):8013–8020. doi: 10.1021/acs.analchem.7b01339. [DOI] [PMC free article] [PubMed] [Google Scholar]
- 21.Titus JA, Haugland R, Sharrow SO, Segal DM. Texas Red, a hydrophilic, red-emitting fluorophore for use with fluorescein in dual parameter flow microfluorometric and fluorescence microscopic studies. J Immunol Methods. 1982;50(2):193–204. doi: 10.1016/0022-1759(82)90225-3. [DOI] [PubMed] [Google Scholar]
- 22.Wolfe AJ, Si W, Zhang Z, Blanden AR, Hsueh YC, Gugel JF, Pham B, Chen M, Loh SN, Rozovsky S, Aksimentiev A, Movileanu L. Quantification of membrane protein-detergent complex interactions. J Phys Chem B. 2017;121(44):10228–10241. doi: 10.1021/acs.jpcb.7b08045. [DOI] [PMC free article] [PubMed] [Google Scholar]
- 23.Mohammad MM, Movileanu L. Impact of distant charge reversals within a robust beta-barrel protein pore. J Phys Chem B. 2010;I114(26):8750–8759. doi: 10.1021/jp101311s. [DOI] [PMC free article] [PubMed] [Google Scholar]
- 24.Bikwemu R, Wolfe AJ, Xing X, Movileanu L. Facilitated translocation of polypeptides through a single nanopore. JPhys : Condens Matter. 2010;22(45):454117. doi: 10.1088/0953-8984/22/45/454117. [DOI] [PMC free article] [PubMed] [Google Scholar]
- 25.Yildiz O, Vinothkumar KR, Goswami P, Kuhlbrandt W. Structure of the monomeric outer-membrane porin OmpG in the open and closed conformation. EMBO J. 2006;25(15):3702–3713. doi: 10.1038/sj.emboj.7601237. [DOI] [PMC free article] [PubMed] [Google Scholar]
- 26.Ferguson AD, Hofmann E, Coulton JW, Diederichs K, Welte W. Siderophore-mediated iron transport: crystal structure of FhuA with bound lipopolysaccharide. Science. 1998;282(5397):2215–2220. doi: 10.1126/science.282.5397.2215. [DOI] [PubMed] [Google Scholar]
- 27.le Maire M, Champeil P, Moller JV. Interaction of membrane proteins and lipids with solubilizing detergents. Biochim Biophys Acta. 2000;1508(1-2):86–111. doi: 10.1016/s0304-4157(00)00010-1. [DOI] [PubMed] [Google Scholar]
- 28.Guex N, Peitsch MC, Schwede T. Automated comparative protein structure modeling with SWISS-MODEL and Swiss-PdbViewer: a historical perspective. Electrophoresis. 2009;30(Suppl 1):S162–S173. doi: 10.1002/elps.200900140. [DOI] [PubMed] [Google Scholar]
- 29.Rossi AM, Taylor CW. Analysis of protein-ligand interactions by fluorescence polarization. Nat Protoc. 2011;6(3):365–87. doi: 10.1038/nprot.2011.305. [DOI] [PMC free article] [PubMed] [Google Scholar]
- 30.Wolfe AJ, Mohammad MM, Thakur AK, Movileanu L. Global redesign of a native beta-barrel scaffold. Biochim Biophys Acta. 2016;1858(1):19–29. doi: 10.1016/j.bbamem.2015.10.006. [DOI] [PMC free article] [PubMed] [Google Scholar]
- 31.Fahie M, Chisholm C, Chen M. Resolved single-molecule detection of individual species within a mixture of anti-biotin antibodies using an engineered monomeric nanopore. ACS nano. 2015;9(2):1089–1098. doi: 10.1021/nn506606e. [DOI] [PMC free article] [PubMed] [Google Scholar]
- 32.Niedzwiecki DJ, Mohammad MM, Movileanu L. Inspection of the engineered FhuA deltaC/delta4L protein nanopore by polymer exclusion. Biophys J. 2012;103(10):2115–2124. doi: 10.1016/j.bpj.2012.10.008. [DOI] [PMC free article] [PubMed] [Google Scholar]
- 33.Thakur AK, Larimi MG, Gooden K, Movileanu L. Aberrantly large single-channel conductance of polyhistidine arm-containing protein nanopores. Biochemistry. 2017;56(36):4895–4905. doi: 10.1021/acs.biochem.7b00577. [DOI] [PMC free article] [PubMed] [Google Scholar]
- 34.Mohammad MM, Howard KR, Movileanu L. Redesign of a plugged beta-barrel membrane protein. J Biol Chem. 2011;286(10):8000–8013. doi: 10.1074/jbc.M110.197723. [DOI] [PMC free article] [PubMed] [Google Scholar]
- 35.Mohammad MM, Iyer R, Howard KR, McPike MP, Borer PN, Movileanu L. Engineering a rigid protein tunnel for biomolecular detection. J Am Chem Soc. 2012;134(22):9521–9531. doi: 10.1021/ja3043646. [DOI] [PMC free article] [PubMed] [Google Scholar]
- 36.Gradinaru CC, Marushchak DO, Samim M, Krull UJ. Fluorescence anisotropy: from single molecules to live cells. Analyst. 2010;135(3):452–9. doi: 10.1039/b920242k. [DOI] [PubMed] [Google Scholar]
- 37.Splinter R, H BA. An introduction to biomedical optics. Taylor & Francis; New York: 2007. p. 602. [Google Scholar]
- 38.Lea WA, Simeonov A. Fluorescence polarization assays in small molecule screening. Expert opinion on drug discovery. 2011;6(1):17–32. doi: 10.1517/17460441.2011.537322. [DOI] [PMC free article] [PubMed] [Google Scholar]
- 39.Kwok KC, Cheung NH. Measuring binding kinetics of ligands with tethered receptors by fluorescence polarization and total internal reflection fluorescence. Anal Chem. 2010;82(9):3819–3825. doi: 10.1021/ac1002245. [DOI] [PubMed] [Google Scholar]
- 40.Prive GG. Detergents for the stabilization and crystallization of membrane proteins. Methods. 2007;41(4):388–397. doi: 10.1016/j.ymeth.2007.01.007. [DOI] [PubMed] [Google Scholar]
- 41.Prive GG. Lipopeptide detergents for membrane protein studies. Curr Opin Struct Biol. 2009;19(4):379–85. doi: 10.1016/j.sbi.2009.07.008. [DOI] [PubMed] [Google Scholar]
Associated Data
This section collects any data citations, data availability statements, or supplementary materials included in this article.